Golden State Warriors vs Orlando Magic Match Player Stats
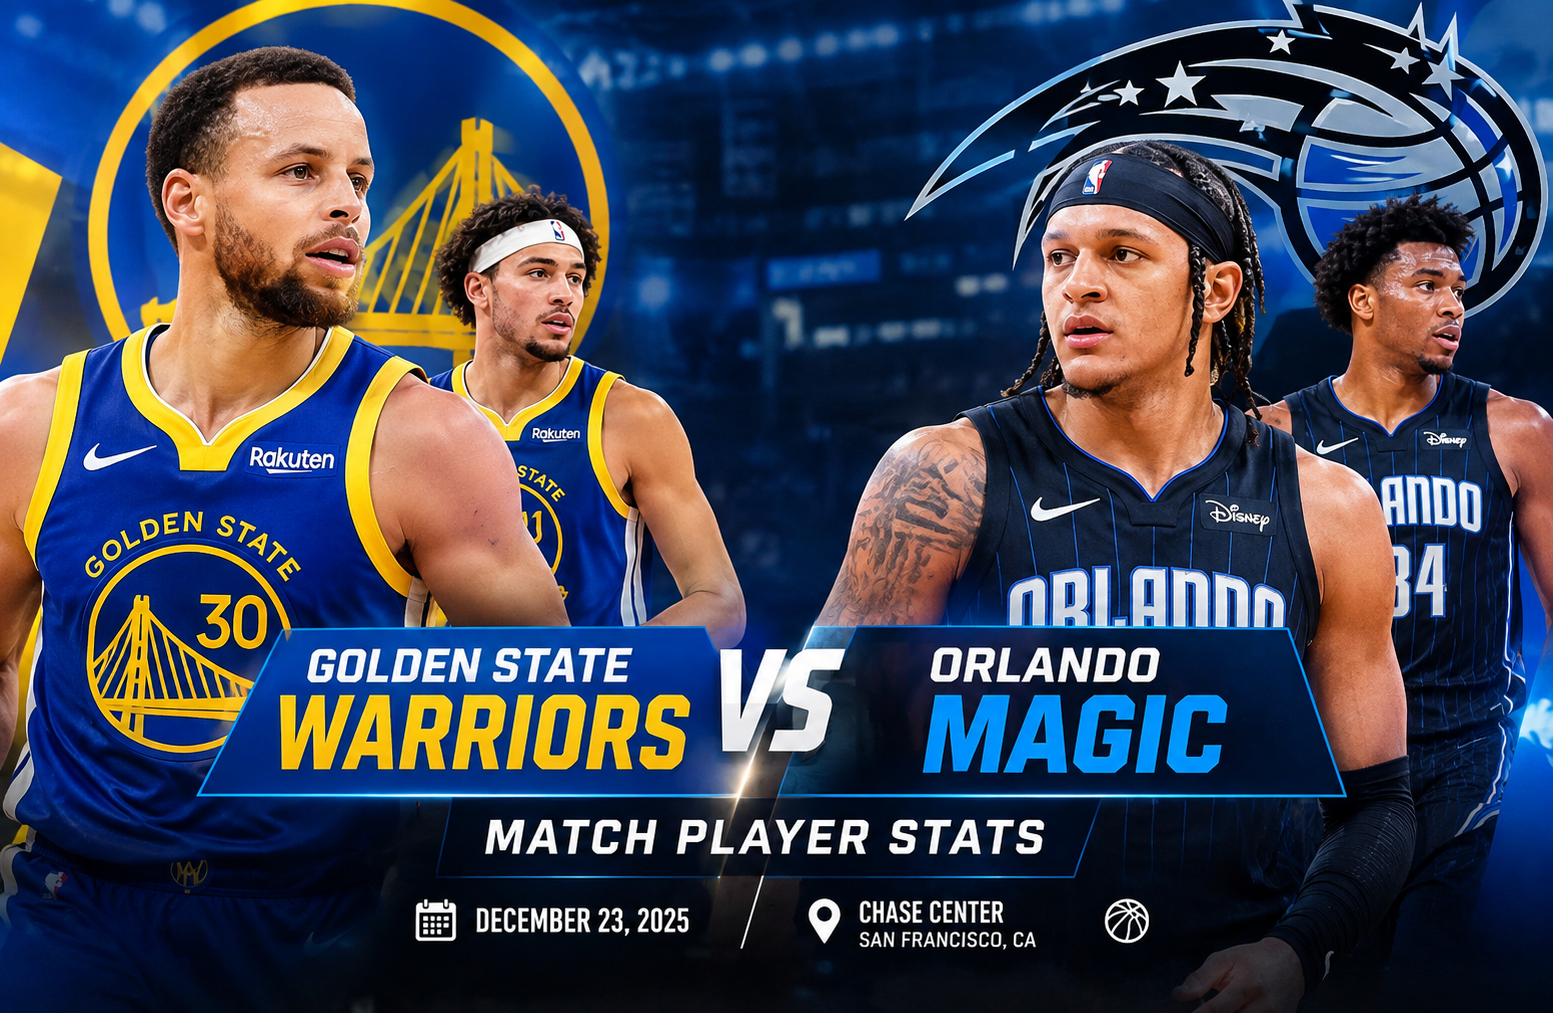
The golden state warriors vs orlando magic match player stats from December 22, 2025, tell a much more detailed story than the final score alone. Golden State defeated Orlando 120-97 at Chase Center in San Francisco, turning a competitive first half into a dominant second-half performance. Stephen Curry led the Warriors with 26 points and six assists, while Paolo Banchero posted 21 points, 12 rebounds, and seven assists for Orlando.
The matchup was particularly interesting because Orlando actually led 30-26 after the opening quarter. Golden State then reversed the game in the second quarter, winning that period 32-27, and continued to build separation with a 31-26 third quarter and a 31-14 fourth quarter. The Warriors finished with a significant shooting advantage, making 52% of their field-goal attempts compared with 41% for the Magic.
This article breaks down the complete team and individual numbers, explains why the game changed after halftime, and identifies the player statistics that best explain the 23-point difference.
Game Overview
The game was played at Chase Center, where Golden State entered with a 9-4 home record. Orlando came into the contest at 16-13 overall and 6-8 on the road, while Golden State was 15-15 overall.
The final score was:
Golden State Warriors 120, Orlando Magic 97
The quarter-by-quarter scoring shows how dramatically the contest changed:
| Quarter | Orlando Magic | Golden State Warriors |
| Q1 | 30 | 26 |
| Q2 | 27 | 32 |
| Q3 | 26 | 31 |
| Q4 | 14 | 31 |
| Final | 97 | 120 |
The first quarter belonged to Orlando, but Golden State scored 94 points over the final three quarters while allowing only 71.
That 23-point final margin therefore does not fully describe the shape of the game. The Magic were competitive early, but Golden State steadily improved its offensive efficiency and eventually controlled the game on both ends.
The official NBA box score lists Chase Center as the venue and identifies the matchup as Orlando at Golden State on December 22, 2025.
Golden State Warriors vs Orlando Magic Match Player Stats: Key Numbers
The central player statistics from the game reveal two different stories.
Golden State received its biggest scoring contribution from Stephen Curry, but the victory was not based on one player’s scoring alone. Jimmy Butler scored 21, Moses Moody scored 20, and Brandin Podziemski added 16 off the bench. Curry also contributed six assists.
Orlando, meanwhile, relied heavily on Paolo Banchero. He produced 21 points, 12 rebounds, and seven assists, making him the Magic’s leader in all three categories. Desmond Bane added 20 points, while Anthony Black scored 19.
Leading individual performances
Golden State
- Stephen Curry: 26 points, 6 assists, 3 rebounds, 2 steals
- Jimmy Butler: 21 points, 4 assists, 3 rebounds
- Moses Moody: 20 points, 3 rebounds, 3 assists
- Brandin Podziemski: 16 points, 5 assists, 4 rebounds
- Quinten Post: 8 points, 12 rebounds, 4 assists
- Draymond Green: 9 points, 7 rebounds, 2 assists
Orlando
- Paolo Banchero: 21 points, 12 rebounds, 7 assists
- Desmond Bane: 20 points, 4 rebounds, 3 assists
- Anthony Black: 19 points, 6 rebounds, 3 assists
- Jase Richardson: 11 points, 4 rebounds
- Wendell Carter Jr.: 9 points, 4 rebounds, 2 assists
- Tyus Jones: 7 points, 3 rebounds, 4 assists, 4 steals
The official box score confirms these individual totals and also provides each player’s shooting, turnover, defensive, and plus/minus figures.
Stephen Curry’s 26 Points Were More Important Than the Total Suggests
Stephen Curry finished with 26 points, which was the highest scoring total of the game. His shooting line was 10-for-23 from the field, including 4-for-13 from three-point range, along with 2-for-2 at the free-throw line. He also recorded six assists and two steals.
On the surface, a 4-for-13 three-point performance is not an especially efficient night from deep.
The context matters.
Curry had a difficult opening stretch and missed his first six three-point attempts. According to the Associated Press recap carried by ESPN, he started 3-for-13 from the field before finding his rhythm after halftime.
Curry eventually hit a three-pointer with 8:20 remaining in the third quarter, bringing Golden State within 71-69. The Warriors then went on a 14-4 run.
That sequence is one of the clearest examples of why individual player stats should be read alongside game flow. Curry did not need to shoot efficiently from three for all 48 minutes to have a major impact. His second-half scoring helped change the pressure on Orlando’s defense and opened opportunities for Golden State’s other offensive players.
The AP reported that Curry scored 18 of his 26 points after halftime.
That means his scoring distribution was particularly important.
Curry’s statistical profile
| Statistic | Stephen Curry |
| Minutes | 31 |
| Points | 26 |
| Field goals | 10-23 |
| 3-pointers | 4-13 |
| Free throws | 2-2 |
| Rebounds | 3 |
| Assists | 6 |
| Steals | 2 |
| Turnovers | 3 |
| Plus/minus | +17 |
His six assists also matter because Golden State finished the game with 33 team assists. That is a strong indication that the Warriors were not simply relying on isolation scoring.
Paolo Banchero Was Orlando’s Statistical Anchor
Paolo Banchero delivered Orlando’s most complete individual performance.
He finished with 21 points, 12 rebounds, and seven assists in 34 minutes. He shot 7-for-19 from the field and 7-for-8 from the free-throw line.
His 12 rebounds were the highest total on either team, matching Quinten Post’s 12 rebounds for Golden State.
Banchero’s seven assists were also the highest total for Orlando.
That makes his performance unusual because he simultaneously led his team in scoring, rebounding, and assists.
However, the overall result demonstrates why individual production cannot be separated from team efficiency. Banchero’s 21 points came on 19 field-goal attempts, while Orlando as a team shot 41%.
His plus/minus was -8, which was actually better than several Orlando players despite the 23-point defeat.
The numbers suggest that Banchero was able to generate offense and control the glass, but Orlando did not produce enough efficient offense around him to sustain pressure on Golden State.
Jimmy Butler Quietly Added 21 Points
Stephen Curry received the headline attention, but Jimmy Butler’s performance was another important part of Golden State’s offensive balance.
Butler scored 21 points in 30 minutes while shooting 7-for-9 from the field and 6-for-7 at the free-throw line. He also recorded four assists and three rebounds.
His 7-for-9 shooting was particularly efficient.
Butler did not need a large number of attempts to reach 21 points. His ability to score efficiently gave Golden State another source of pressure when Orlando’s defense was focused on Curry.
This is one of the most useful details in the golden state warriors vs orlando magic match player stats. Golden State had three players score at least 20 points:
- Stephen Curry: 26
- Jimmy Butler: 21
- Moses Moody: 20
Orlando had three players reach 19 or more:
- Paolo Banchero: 21
- Desmond Bane: 20
- Anthony Black: 19
The difference was not simply the number of high scorers. It was how efficiently Golden State converted its possessions.
Moses Moody Delivered Efficient Scoring
Moses Moody finished with 20 points and was one of the most efficient high-volume scorers in the game.
He shot 8-for-11 from the field and 3-for-6 from three-point range. He also went 1-for-1 from the free-throw line.
His complete line included:
- 20 points
- 3 rebounds
- 3 assists
- 2 blocks
- 32 minutes
- 8-for-11 shooting
- 3-for-6 from three
- +23 plus/minus
The +23 figure was especially notable because it was the second-highest individual plus/minus among Golden State starters.
Moody’s efficiency gave the Warriors another perimeter scoring threat. When a team has Curry drawing defensive attention, efficient shooting from teammates can make defensive help extremely difficult.
Brandin Podziemski Produced the Best Plus/Minus
Brandin Podziemski did not lead Golden State in scoring, but he posted the game’s highest plus/minus at +36.
He scored 16 points, grabbed four rebounds, and recorded five assists in 28 minutes. He shot 6-for-10 from the field, including 2-for-6 from three-point range.
His plus/minus was nine points better than Moody’s +23 and 19 points better than Curry’s +17.
Plus/minus should not be treated as a standalone measure of individual quality. It measures the team’s point differential while a player is on the floor and can be affected by lineups, opponent combinations, and game context.
Still, Podziemski’s +36 fits the broader story of the game. Golden State’s bench units helped create separation rather than merely protecting a lead.
Quinten Post Won the Rebounding Battle for Golden State
Quinten Post led the Warriors with 12 rebounds, matching Banchero’s game-high total.
He played 25 minutes and finished with:
- 8 points
- 12 rebounds
- 4 assists
- 1 block
- 4 offensive rebounds
- 8 defensive rebounds
- 0 turnovers
The zero-turnover figure is useful because Post was not only collecting rebounds. He also provided four assists without giving the ball away.
His 12 rebounds helped Golden State remain competitive on the glass despite Orlando collecting 48 total rebounds compared with Golden State’s 47.
That detail is important.
The Warriors did not win because they dominated the overall rebounding count. They won because their offensive execution, ball movement, shooting efficiency, and second-half defense were stronger.
Orlando’s Desmond Bane Was Highly Efficient
Desmond Bane scored 20 points for Orlando and shot 8-for-16 from the field.
More importantly, he went 2-for-2 from three-point range.
His final line included four rebounds, three assists, two blocks, and two turnovers.
Bane’s 50% field-goal shooting was considerably better than Orlando’s team mark of 41%.
That suggests Orlando did receive efficient scoring from its leading perimeter option, but the team needed more players to sustain that efficiency.
The contrast with Golden State was significant. The Warriors had several players contributing efficiently at the same time, which reduced the consequences of any one player’s cold shooting spell.
Anthony Black Added 19 Points
Anthony Black scored 19 points on 8-for-12 shooting.
He also contributed six rebounds, three assists, and one block.
His 8-for-12 shooting was one of Orlando’s strongest individual shooting performances.
However, Black finished with a -16 plus/minus.
Again, that does not mean his individual shooting was ineffective. Instead, it shows how the team’s overall performance during his minutes was affected by Golden State’s stronger stretches.
This is why a complete player-stat analysis should include both traditional box-score numbers and context.
Tyus Jones Led Orlando in Steals
Tyus Jones finished with four steals, the highest total by any player in the game.
He scored seven points, collected three rebounds, and recorded four assists.
Orlando finished with eight steals overall, exactly matching Golden State’s eight steals.
Therefore, steals were not the reason for the difference in the final score.
The bigger distinction came from what happened after turnovers.
Golden State committed 13 turnovers compared with Orlando’s 18. ESPN’s team statistics show Orlando scored 21 points off turnovers, while Golden State scored only nine.
That is one area where Orlando actually had an advantage.
Yet the Magic still lost by 23 points.
That fact makes the shooting and half-court execution gap even more important.
Team Shooting Explains a Major Part of the Result
The most obvious statistical difference was field-goal percentage.
| Category | Orlando | Golden State |
| Field goals | 36-87 | 46-89 |
| FG percentage | 41% | 52% |
| 3-pointers | 7-27 | 11-37 |
| 3PT percentage | 26% | 30% |
| Free throws | 18-26 | 17-24 |
| FT percentage | 69% | 71% |
Golden State made 10 more field goals despite taking only two more field-goal attempts.
That is enormous.
The Warriors attempted 89 shots and made 46. Orlando attempted 87 and made 36.
The difference was therefore not primarily shot volume.
It was conversion.
Golden State’s 52% field-goal percentage was 11 percentage points higher than Orlando’s 41%.
That shooting gap produced much of the final margin.
Three-Point Shooting Was Not the Whole Story
It would be easy to look at the three-point numbers and assume Golden State won because it made threes.
That explanation is incomplete.
The Warriors made 11 of 37 three-point attempts for 30%.
Orlando made seven of 27 for 26%.
Golden State therefore made four more three-pointers.
That certainly mattered, but the more important shooting difference was the overall field-goal percentage.
The Warriors were also more productive inside the arc. ESPN recorded Golden State with 62 points in the paint compared with 50 for Orlando.
That means Golden State was not simply launching threes and hoping for variance.
The offense generated scoring from multiple areas.
Ball Movement Was a Major Difference
Golden State finished with 33 assists.
Orlando finished with 21.
That is a 12-assist advantage for the Warriors.
This is arguably one of the most revealing team statistics in the game.
Golden State had 46 made field goals and 33 assists, meaning a large share of its made baskets were connected to team creation.
Orlando made 36 field goals with 21 assists.
The difference suggests that Golden State’s offense generated more connected possessions.
Individual players still mattered, especially Curry, Butler, Moody, and Podziemski, but the assist numbers show a broader team structure.
Turnovers Favored Orlando, But It Was Not Enough
Orlando committed 18 turnovers.
Golden State committed 13.
That gave the Magic a five-turnover advantage.
Normally, a turnover edge can be highly valuable.
In this game, however, Orlando did not convert that advantage into enough overall offense.
The Magic scored 21 points off Golden State turnovers, while the Warriors scored only nine points off Orlando turnovers.
That is a 12-point advantage for Orlando in points generated from turnovers.
Despite that, Orlando lost by 23.
The lesson is straightforward: winning the turnover battle does not automatically produce a win when the opponent has major advantages in shooting and offensive organization.
Rebounding Was Nearly Even
Orlando grabbed 48 rebounds.
Golden State grabbed 47.
That one-rebound difference is too small to explain the final result.
The Magic did have a slight edge on the offensive glass, collecting 16 offensive rebounds compared with Golden State’s 14.
Golden State held the defensive rebounding edge, 33-32.
Again, neither category explains a 23-point margin.
This is an important part of reading the golden state warriors vs orlando magic match player stats correctly. A box score can contain several categories where the losing team performs reasonably well.
Orlando’s rebounding and turnover numbers were competitive.
Its shooting efficiency was not.
The Second Half Changed Everything
The game was effectively divided into two different phases.
First half
Orlando led 30-26 after the first quarter.
Golden State responded by scoring 32 in the second quarter, but the Warriors entered halftime with only a narrow lead.
Second half
Golden State scored 31 points in both the third and fourth quarters.
Orlando scored 26 in the third and only 14 in the fourth.
That fourth-quarter difference was enormous:
Golden State 31, Orlando 14
The Warriors therefore outscored Orlando by 17 points in the final period alone.
The AP recap noted that Curry’s second-half scoring helped spark Golden State’s turnaround after the Warriors had struggled early.
The third quarter was particularly important because Golden State created separation before completely controlling the fourth.
Why Golden State’s 33 Assists Matter
Thirty-three assists on 46 made field goals is a strong indicator of collective offensive involvement.
The Warriors had several players capable of creating or finishing possessions:
- Curry provided six assists.
- Podziemski provided five.
- Butler provided four.
- Post provided four.
- Moody provided three.
- Draymond Green provided two.
This distribution shows that Golden State did not depend on one playmaker.
Curry was the primary offensive engine, but the ball moved through multiple players.
That helped the Warriors maintain offensive pressure even when Curry was struggling early.
Orlando’s Offensive Structure Was More Concentrated
Banchero’s seven assists were a team-high.
Tyus Jones had four.
Bane and Black each had three.
The Magic therefore had several players contributing as passers, but the total remained 21 assists.
Banchero’s all-around line was impressive, but the offensive load was substantial.
He led Orlando in points, rebounds, and assists.
That makes his performance one of the clearest examples of a player producing across several categories while his team still struggled to match the opponent’s efficiency.
Free Throws Were Relatively Even
Golden State made 17 of 24 free throws.
Orlando made 18 of 26.
The Magic therefore had one more made free throw than Golden State.
Free-throw efficiency was also close:
- Orlando: 69%
- Golden State: 71%
So the free-throw line was not a major source of the 23-point difference.
This is another useful example of why the final result should not be reduced to one statistic.
Defensive Production Was Balanced in Some Areas
Both teams recorded eight steals.
Golden State had six blocks.
Orlando had five.
Those numbers were relatively close.
The major defensive difference was therefore less about spectacular defensive statistics and more about limiting efficient scoring.
Golden State held Orlando to 41% shooting.
Orlando allowed Golden State to shoot 52%.
That 11-point field-goal percentage gap is far more significant to the final outcome than the one-block difference.
Full Golden State Player Stats
The official box score provides the following Warriors numbers:
| Player | MIN | PTS | REB | AST | STL | BLK | TO | FG | 3PT | +/- |
| Stephen Curry | 31 | 26 | 3 | 6 | 2 | 0 | 3 | 10-23 | 4-13 | +17 |
| Jimmy Butler | 30 | 21 | 3 | 4 | 0 | 1 | 1 | 7-9 | 1-1 | +4 |
| Moses Moody | 32 | 20 | 3 | 3 | 0 | 2 | 0 | 8-11 | 3-6 | +23 |
| Brandin Podziemski | 28 | 16 | 4 | 5 | 1 | 1 | 2 | 6-10 | 2-6 | +36 |
| Draymond Green | 18 | 9 | 7 | 2 | 0 | 0 | 1 | 4-5 | 0-1 | -5 |
| Quinten Post | 25 | 8 | 12 | 4 | 0 | 1 | 0 | 4-10 | 0-3 | +10 |
| Gary Payton II | 10 | 7 | 4 | 5 | 1 | 0 | 1 | 3-3 | 0-0 | +5 |
| De’Anthony Melton | 16 | 4 | 0 | 1 | 2 | 0 | 0 | 1-6 | 0-2 | +1 |
| Trayce Jackson-Davis | 12 | 4 | 4 | 0 | 0 | 1 | 1 | 2-4 | 0-0 | +8 |
| Buddy Hield | 3 | 3 | 3 | 0 | 0 | 0 | 1 | 1-1 | 1-1 | +2 |
| Pat Spencer | 12 | 2 | 2 | 2 | 0 | 0 | 3 | 0-5 | 0-2 | +1 |
| Will Richard | 13 | 0 | 1 | 1 | 0 | 0 | 0 | 0-2 | 0-2 | -1 |
The table highlights the depth of Golden State’s contribution. Curry led the scoring, but the Warriors had multiple players producing meaningful numbers across the box score.
Full Orlando Player Stats
The official box score lists these Orlando statistics:
| Player | MIN | PTS | REB | AST | STL | BLK | TO | FG | 3PT | +/- |
| Paolo Banchero | 34 | 21 | 12 | 7 | 0 | 0 | 4 | 7-19 | 0-4 | -8 |
| Desmond Bane | 33 | 20 | 4 | 3 | 0 | 2 | 2 | 8-16 | 2-2 | -10 |
| Anthony Black | 31 | 19 | 6 | 3 | 0 | 1 | 2 | 8-12 | 2-5 | -16 |
| Jase Richardson | 22 | 11 | 4 | 0 | 1 | 1 | 3 | 5-11 | 1-3 | -21 |
| Wendell Carter Jr. | 29 | 9 | 4 | 2 | 0 | 0 | 1 | 3-8 | 0-3 | -1 |
| Tyus Jones | 26 | 7 | 3 | 4 | 4 | 0 | 1 | 2-6 | 1-3 | 0 |
| Noah Penda | 15 | 5 | 4 | 0 | 0 | 0 | 1 | 2-3 | 1-2 | -6 |
| Jonathan Isaac | 13 | 1 | 4 | 0 | 1 | 0 | 0 | 0-2 | 0-1 | -10 |
| Goga Bitadze | 14 | 2 | 5 | 0 | 2 | 1 | 1 | 0-3 | 0-0 | -16 |
| Jett Howard | 18 | 2 | 2 | 2 | 0 | 0 | 2 | 1-4 | 0-3 | -21 |
| Jamal Cain | 5 | 0 | 0 | 0 | 0 | 0 | 1 | 0-3 | 0-1 | -6 |
One notable point is the distribution of Orlando’s scoring. Banchero, Bane, and Black combined for 60 points, meaning the rest of the team produced 37.
Golden State’s scoring was more evenly spread among its primary contributors.
What the Plus/Minus Numbers Tell Us
Plus/minus is often misunderstood.
A player’s plus/minus is the team’s point differential while that player is on the court. It is not an individual efficiency rating.
Podziemski’s +36 was the game’s highest mark. Moody finished at +23, Curry at +17, and Post at +10.
For Orlando, Banchero had the least negative mark among its main high-minute players at -8, followed by Carter Jr. at -1 and Jones at 0.
The numbers show how difficult the game became for Orlando’s second units.
Several Magic players finished between -16 and -21, while Golden State’s bench contributors generally remained on the positive side.
That does not establish that one individual caused the result. Instead, it provides evidence that Golden State’s lineups consistently outscored Orlando’s lineups over the course of the game.
The Most Important Statistical Lessons
Several conclusions stand out from the golden state warriors vs orlando magic match player stats.
1. Shooting efficiency created the largest gap
Golden State shot 52% from the field.
Orlando shot 41%.
That 11-percentage-point difference was the clearest statistical separator.
2. Golden State had superior ball movement
The Warriors produced 33 assists.
Orlando produced 21.
The 12-assist difference indicates a major advantage in collective offensive creation.
3. Orlando won the turnover battle
The Magic committed 18 turnovers.
Golden State committed 13.
Orlando also scored 21 points off turnovers compared with nine for Golden State.
This was a genuine area of success for Orlando, even in defeat.
4. Rebounding was essentially even
Orlando had 48 rebounds.
Golden State had 47.
The result therefore was not driven by a major rebounding imbalance.
5. Curry’s second half changed the game
Curry scored 18 of his 26 points after halftime, according to the AP recap.
His scoring surge coincided with Golden State’s major third-quarter improvement.
6. Golden State had several efficient scorers
Butler shot 7-for-9.
Moody shot 8-for-11.
Podziemski shot 6-for-10.
Curry finished 10-for-23.
That balance made it harder for Orlando to neutralize Golden State by concentrating defensive attention on one player.
Previous Meeting and Season Series Context
The December matchup was part of a season series that ultimately stood at 1-1 according to the supplied game data.
The previous meeting listed for the series was November 19, 2025, when Golden State defeated Orlando 121-113.
The second meeting therefore ended with a much larger margin, 120-97.
Comparing the two games can be useful because it shows how individual performances and team efficiency can change from one matchup to another.
For the December game, Golden State’s defensive pressure and offensive efficiency became particularly important after halftime.
The official NBA record confirms the December game as a 120-97 Golden State victory at Chase Center.
How to Read These Player Stats Correctly
If you are using this box score for fantasy basketball research, historical analysis, matchup study, or team performance tracking, it helps to separate four different questions.
Who scored the most?
Stephen Curry led all players with 26 points.
Who produced the most complete line?
Paolo Banchero’s 21 points, 12 rebounds, and seven assists made him Orlando’s most statistically complete player.
Who was most efficient?
Several players were highly efficient, especially Jimmy Butler at 7-for-9 and Moses Moody at 8-for-11.
Which team controlled the game?
Golden State controlled the game through superior shooting, passing, and second-half scoring.
These questions produce different answers, which is why simply searching for the highest scorer does not provide a complete understanding of the matchup.
Why the Final Score Can Be Misleading
A 23-point victory may make it appear that Golden State dominated from the opening tip.
The quarter scores show otherwise.
Orlando scored 30 points in the first quarter while Golden State scored 26.
The Magic then scored 27 in the second quarter.
Golden State’s decisive advantage developed progressively.
The Warriors scored 31 in each of the final two quarters while Orlando dropped from 26 points in the third to only 14 in the fourth.
This is why quarter-by-quarter data should be examined alongside player statistics.
Curry’s second-half scoring, Golden State’s 33 assists, and the Warriors’ 52% field-goal shooting all help explain why the game moved away from Orlando.
A Practical Framework for Analyzing NBA Match Player Stats
A useful way to analyze any NBA box score is to work through the following sequence.
Start with the score
Identify the final margin and determine whether the game was close throughout or decided by a late run.
Check shooting efficiency
Compare field-goal percentage, three-point percentage, and free-throw percentage.
Check possession-related statistics
Look at turnovers, offensive rebounds, and points created from turnovers.
Examine playmaking
Compare assists and identify whether creation was concentrated in one player or distributed across the lineup.
Study individual efficiency
Do not look only at points. Compare points with field-goal attempts, three-point attempts, and free throws.
Add game context
Finally, examine quarter scoring and plus/minus.
This method gives a more reliable picture than focusing on a single box-score category.
Frequently Asked Questions
Who led the Warriors in scoring against the Magic?
Stephen Curry led Golden State with 26 points. He also recorded six assists, three rebounds, and two steals.
Who led Orlando in the game?
Paolo Banchero led Orlando with 21 points. He also had 12 rebounds and seven assists.
What was the final score between the Warriors and Magic?
Golden State defeated Orlando 120-97 at Chase Center.
Which player had the highest plus/minus?
Brandin Podziemski recorded the highest plus/minus at +36.
Which team shot better?
Golden State shot 52% from the field, compared with 41% for Orlando. The Warriors also made 11 of 37 three-point attempts, while Orlando made seven of 27.
Who led the game in rebounds?
Paolo Banchero and Quinten Post each recorded 12 rebounds.
Conclusion
The golden state warriors vs orlando magic match player stats show that Golden State’s 120-97 victory was built on several connected advantages rather than one isolated statistic.
Stephen Curry led all scorers with 26 points and added six assists. Jimmy Butler contributed 21 points on highly efficient shooting, while Moses Moody scored 20 points on 8-for-11 shooting. Brandin Podziemski supplied 16 points, five assists, four rebounds, and the game’s highest plus/minus at +36.
For Orlando, Paolo Banchero produced 21 points, 12 rebounds, and seven assists, while Desmond Bane and Anthony Black added 20 and 19 points respectively.
The team numbers explain the final margin more clearly. Golden State shot 52% compared with Orlando’s 41%, recorded 33 assists against 21, and scored 62 points in the paint compared with Orlando’s 50. Orlando did win the turnover battle and finished with a one-rebound advantage, but those strengths were not enough to offset Golden State’s superior shooting and offensive execution.
The biggest turning point was the second half. Curry scored 18 of his 26 points after halftime, while Golden State scored 31 points in both the third and fourth quarters. Orlando managed only 14 points in the final period.