76ers vs Detroit Pistons Match Player Stats
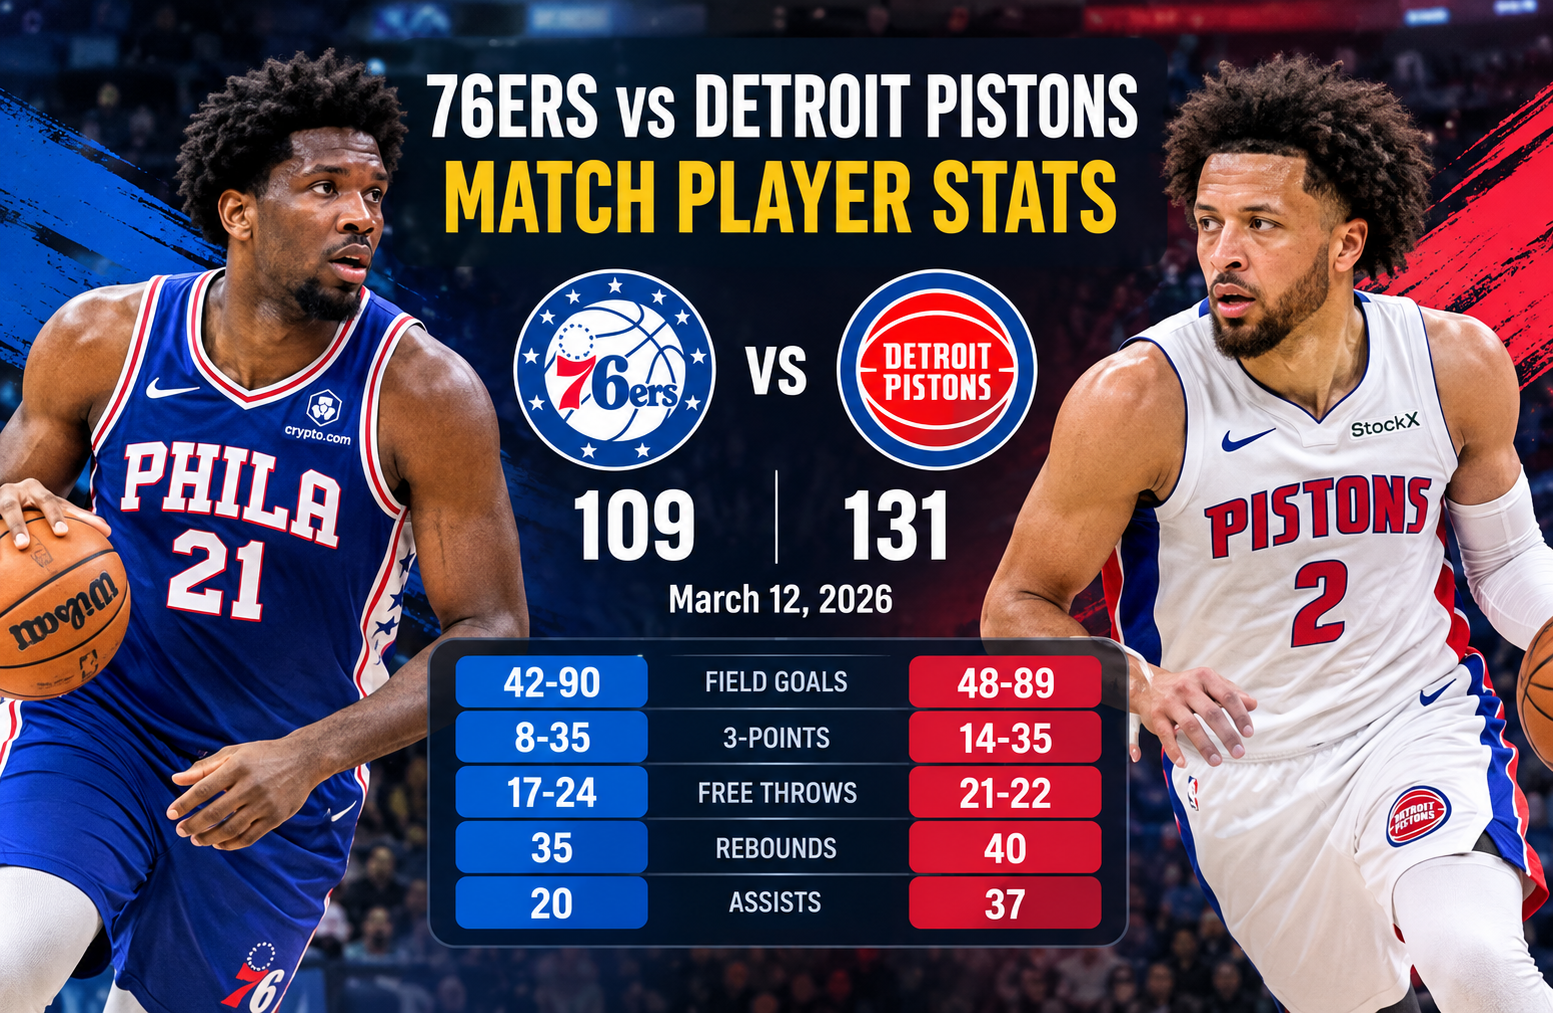
The 76ers vs detroit pistons match player stats from March 12, 2026, show a game that was decided by much more than the final 131-109 score. Detroit controlled the contest from the opening quarter, shooting 54% from the field, making 14 of 35 three-point attempts, and converting 21 of 22 free throws. Philadelphia finished at 47% from the field, just 23% from three-point range, and 71% at the line.
The result also completed a 3-0 season-series sweep for Detroit. The Pistons entered the game with a 47-18 record and a 25-8 home mark, while Philadelphia arrived at 35-31 overall and 17-15 on the road. In front of 20,062 fans at Little Caesars Arena, Detroit produced a balanced offensive performance in which 37 assists helped explain how the team generated 131 points.
This detailed breakdown examines the individual performances, shooting efficiency, playmaking, rebounding, turnovers, plus-minus numbers, and the statistical differences that shaped the game.
76ers vs detroit pistons match player stats at a glance
| CategoryPhiladelphia 76ersDetroit Pistons | ||
| Final Score | 109 | 131 |
| Field Goals | 42-90 | 48-89 |
| Field-Goal % | 47% | 54% |
| Three-Pointers | 8-35 | 14-35 |
| Three-Point % | 23% | 40% |
| Free Throws | 17-24 | 21-22 |
| Free-Throw % | 71% | 95% |
| Rebounds | 35 | 40 |
| Assists | 20 | 37 |
| Turnovers | 15 | 17 |
| Steals | 10 | 10 |
| Blocks | 8 | 7 |
The most striking difference is the assist total. Detroit recorded 17 more assists than Philadelphia while also making six more field goals. That combination points to a major advantage in offensive connectivity rather than simply superior individual scoring.
Game summary: Detroit establishes control early
Detroit won every quarter:
- First quarter: Detroit 36, Philadelphia 27
- Second quarter: Detroit 33, Philadelphia 33
- Third quarter: Detroit 35, Philadelphia 21
- Fourth quarter: Detroit 27, Philadelphia 28
The nine-point first-quarter advantage gave Detroit an immediate platform. Philadelphia matched the Pistons in the second quarter, but that did not reduce the deficit.
The decisive stretch came after halftime.
Detroit scored 35 points in the third quarter while Philadelphia managed only 21. That 14-point swing effectively turned a competitive halftime margin into a game that was difficult for Philadelphia to recover.
Detroit then maintained a comfortable advantage through the fourth quarter.
The game was played at Little Caesars Arena in Detroit, Michigan, with an announced attendance of 20,062.
Detroit’s offensive efficiency explains the 131 points
Detroit’s 48-for-89 shooting was the foundation of the victory.
A 54% field-goal rate over 89 attempts means the Pistons consistently generated quality scoring opportunities. They also hit 14 three-pointers, giving them an important source of efficient offense beyond the arc.
The free-throw numbers were even more efficient.
Detroit converted 21 of 22 attempts, or 95%. Philadelphia attempted 24 free throws but made only 17.
That created an additional four-point advantage for Detroit at the foul line despite Philadelphia actually attempting two more free throws.
The Pistons therefore won all three major shooting categories:
- Field-goal percentage: 54% to 47%
- Three-point percentage: 40% to 23%
- Free-throw percentage: 95% to 71%
That combination is difficult to overcome.
Detroit’s 37 assists were a major difference
The Pistons recorded 37 assists on 48 made field goals.
That is one of the clearest statistical indicators of how well the offense moved the ball.
Cade Cunningham led Detroit with 13 assists despite scoring only eight points. His individual scoring output was modest, but his playmaking was central to the team’s offensive production.
Duncan Robinson added four assists, while Isaiah Stewart, Ronald Holland II, Kevin Huerter and others also contributed to the passing game.
Philadelphia finished with 20 assists on 42 made field goals.
The difference was therefore not simply that Detroit made more shots. The Pistons created considerably more assisted scoring opportunities.
Cade Cunningham’s low-scoring, high-impact game
Cunningham’s line was:
- 8 points
- 3-6 field goals
- 0-2 three-pointers
- 2-2 free throws
- 5 rebounds
- 13 assists
- 4 turnovers
- 2 steals
- 1 block
- +27
The 13 assists stand out immediately.
He did not need to lead Detroit in scoring because the offense had several players capable of converting the opportunities he created.
His +27 plus-minus was also the highest mark among Detroit players listed in the supplied box score.
This is an important reminder when evaluating player statistics: points alone do not capture a player’s offensive influence.
Duncan Robinson provides the shooting spark
Duncan Robinson delivered one of Detroit’s most efficient scoring performances.
He finished with:
- 19 points
- 7-10 field goals
- 5-7 three-pointers
- 2 rebounds
- 4 assists
- 1 steal
- +18
His five made three-pointers were especially important.
Robinson converted 71.4% of his three-point attempts, creating consistent perimeter pressure for Philadelphia’s defense.
Detroit’s 14 total three-pointers came from several players, but Robinson’s five made shots represented more than one-third of the team’s total.
His shooting also complemented Cunningham’s playmaking. When Cunningham created opportunities and Philadelphia’s defense had to react, Robinson provided a high-value perimeter option.
Jalen Duren controls the interior
Jalen Duren produced a double-double:
- 14 points
- 6-7 field goals
- 2-3 free throws
- 10 rebounds
- 2 assists
- 1 block
- +21
His 10 rebounds were particularly important because Detroit finished with a 40-35 overall rebounding advantage.
Duren’s 6-for-7 shooting also contributed to Detroit’s 54% field-goal percentage.
Rather than relying exclusively on perimeter shooting, Detroit received efficient interior production as well.
That balance made the offense more difficult to contain.
Tobias Harris delivers an efficient starter performance
Tobias Harris recorded:
- 15 points
- 6-11 field goals
- 2-3 three-pointers
- 1-1 free throws
- 5 rebounds
- 2 assists
- 1 steal
- +18
Harris was another Detroit starter who combined efficient shooting with secondary contributions.
His 54.5% field-goal shooting and 66.7% three-point shooting gave Detroit another reliable scoring option.
The starting group therefore did not depend on a single high-volume scorer.
Detroit’s bench adds 69 points
The Pistons’ reserves produced substantial scoring:
- Javonte Green: 17 points
- Ronald Holland II: 15 points
- Isaiah Stewart: 13 points
- Kevin Huerter: 12 points
- Paul Reed: 6 points
- Daniss Jenkins: 6 points
- Chaz Lanier: 0 points
That production mattered because Philadelphia’s bench also scored effectively.
Javonte Green was particularly productive. He finished with 17 points on 5-of-8 shooting, including 4-of-6 from three-point range, plus three steals.
Isaiah Stewart was even more efficient from the floor, going 5-for-5 and adding four assists and two blocks.
The Detroit bench therefore combined scoring with defense and ball movement.
Philadelphia’s starting lineup struggles to match Detroit
Philadelphia’s starters produced:
- Trendon Watford: 4 points
- Justin Edwards: 12 points
- Dominick Barlow: 11 points
- Quentin Grimes: 14 points
- VJ Edgecombe: 10 points
The group struggled to maintain Detroit’s shooting efficiency.
Quentin Grimes led the starters with 14 points, but he shot 5-for-14 overall and just 1-for-8 from three-point range.
VJ Edgecombe finished with 10 points on 3-for-14 shooting and missed all five of his three-point attempts.
Trendon Watford scored four points on 2-for-5 shooting.
The starters therefore had difficulty producing efficient perimeter offense against Detroit’s defense.
Justin Edwards provides all-around production
Justin Edwards posted one of Philadelphia’s more complete statistical lines:
- 12 points
- 5-11 field goals
- 0-2 three-pointers
- 2-4 free throws
- 9 rebounds
- 5 assists
- 1 turnover
- 4 steals
- -5
The combination of nine rebounds, five assists and four steals is notable.
Even though Philadelphia lost by 22 points, Edwards’ statistical contribution extended well beyond scoring.
His four steals were tied to Philadelphia’s strong overall defensive activity, with the 76ers recording 10 steals.
The problem was that those defensive plays did not translate into enough efficient offense.
MarJon Beauchamp leads Philadelphia’s bench
MarJon Beauchamp scored 17 points on 7-of-13 shooting.
He also added:
- 2-of-7 three-point shooting
- 1-of-1 free throws
- 6 rebounds
- 2 assists
- 1 block
- -1
His -1 plus-minus was one of Philadelphia’s better marks in the game.
Beauchamp was one of several Philadelphia reserves who supplied useful scoring while the starters struggled.
Jabari Walker is perfect from the field
Jabari Walker delivered perhaps Philadelphia’s most efficient shooting performance.
He recorded:
- 16 points
- 6-6 field goals
- 2-2 three-pointers
- 2-2 free throws
- 1 rebound
- 2 assists
- 2 turnovers
- -5
Walker did not miss a shot.
His 6-for-6 shooting from the field and 2-for-2 performance from three-point range made him an important bright spot in Philadelphia’s offensive numbers.
The challenge for Philadelphia was that this efficiency came in a limited role and could not offset the team’s broader shooting problems.
Cameron Payne adds 15 points
Cameron Payne finished with 15 points on 5-of-10 shooting.
His complete line included:
- 15 points
- 5-10 field goals
- 2-6 three-pointers
- 3-4 free throws
- 1 rebound
- 2 assists
- 2 turnovers
- -9
Payne provided additional scoring from the bench, but Philadelphia still finished with only eight made three-pointers.
That was less than Detroit’s 14.
Dalen Terry and Tyrese Martin provide positive plus-minus numbers
Dalen Terry scored eight points and finished +1.
He also contributed three rebounds, two assists and two blocks.
Tyrese Martin scored only two points but finished +2, the best plus-minus figure among Philadelphia players in the supplied statistics.
These numbers illustrate why plus-minus should be considered alongside traditional box-score totals rather than treated as a standalone measure.
A player can contribute positively without scoring heavily, while a high scorer can still finish with a negative plus-minus if the opposing team controls the game during his minutes.
Shooting efficiency was the central statistical gap
The clearest numerical difference between the teams was shooting.
Philadelphia:
- 42-of-90 overall
- 8-of-35 from three
- 17-of-24 from the line
Detroit:
- 48-of-89 overall
- 14-of-35 from three
- 21-of-22 from the line
Philadelphia took one more field-goal attempt but made six fewer shots.
Detroit also made six more three-pointers.
That produced an 18-point advantage from made three-point baskets alone when comparing total made threes: Detroit’s 14 versus Philadelphia’s eight represents 18 additional points from that category.
The Pistons’ superior free-throw accuracy added another four made free throws.
These differences account for a substantial portion of the 22-point final margin.
Rebounding favored Detroit
Detroit collected 40 rebounds compared with Philadelphia’s 35.
The five-rebound advantage was not enormous, but it helped Detroit maintain possession and limit Philadelphia’s opportunities.
Jalen Duren led the Pistons with 10 rebounds.
Justin Edwards led Philadelphia with nine.
Tobias Harris added five for Detroit, while VJ Edgecombe contributed five for Philadelphia.
The rebounding margin was therefore meaningful, but it was not the primary reason Detroit won.
Shooting and playmaking were more decisive statistical differences.
Turnovers did not decide the game
Philadelphia committed 15 turnovers.
Detroit committed 17.
At first glance, that suggests Philadelphia had a two-turnover advantage.
However, the 76ers were unable to turn that advantage into enough scoring efficiency.
Both teams recorded 10 steals.
This is another useful example of why one statistical category should not be isolated from the rest of the box score.
Philadelphia protected the ball slightly better, but Detroit compensated through much better shooting and passing.
Philadelphia’s defensive activity was not enough
Philadelphia recorded:
- 10 steals
- 8 blocks
Detroit recorded:
- 10 steals
- 7 blocks
The 76ers therefore matched Detroit in steals and actually recorded one more block.
Yet Detroit still scored 131 points.
This suggests that Philadelphia’s defensive activity generated individual disruption without consistently preventing efficient possessions.
Detroit’s 37 assists indicate that the Pistons were generally able to keep the offense connected despite Philadelphia’s defensive plays.
Plus-minus tells an important story
Detroit’s strongest plus-minus figures included:
- Cade Cunningham: +27
- Marcus Sasser: +23
- Jalen Duren: +21
- Javonte Green: +20
- Tobias Harris: +18
- Duncan Robinson: +18
Philadelphia’s best marks were:
- Tyrese Martin: +2
- Dalen Terry: +1
- MarJon Beauchamp: -1
- Justin Edwards: -5
- Jabari Walker: -5
The contrast is substantial.
Every Detroit starter listed in the supplied statistics finished with a positive plus-minus.
Philadelphia’s starters all finished negative.
That does not mean plus-minus alone determines individual performance. It does, however, provide useful context for understanding how consistently the teams performed during different player combinations.
Quarter-by-quarter analysis
First quarter: Detroit creates the initial separation
Detroit opened with 36 points compared with Philadelphia’s 27.
That nine-point advantage immediately placed Philadelphia in a recovery position.
The Pistons’ efficient shooting allowed them to establish offensive rhythm early.
Second quarter: Philadelphia holds the line
Both teams scored 33 points in the second period.
Philadelphia therefore prevented the deficit from growing before halftime.
However, matching Detroit’s scoring was not enough because the 76ers entered halftime already behind.
Third quarter: the decisive period
The third quarter was the most important segment of the game.
Detroit scored 35.
Philadelphia scored 21.
The 14-point difference in one quarter turned Detroit’s existing advantage into a commanding lead.
The third-quarter collapse also explains why the final score became so lopsided despite Philadelphia slightly outscoring Detroit in the fourth quarter.
Fourth quarter: Philadelphia finishes stronger, but too late
Philadelphia scored 28 points in the final period.
Detroit scored 27.
That one-point Philadelphia advantage had little effect because the game was already heavily tilted toward the Pistons.
What the 3-0 season series tells us
Detroit won all three meetings in the season series.
The supplied game information records Detroit as holding a 3-0 advantage over Philadelphia.
However, a season-series record should not be treated as a complete explanation of the matchup.
Different games involve different lineups, shooting performances and game situations.
For this particular meeting, the statistical evidence points most strongly toward three factors:
- Detroit’s superior shooting efficiency
- Detroit’s 37 assists
- Detroit’s ability to produce balanced scoring from starters and reserves
Those factors were visible directly in the March 12 box score.
Key player statistics table
| PlayerTeamPTSFG3PTREBASTSTLBLK+/- | |||||||||
| Duncan Robinson | DET | 19 | 7-10 | 5-7 | 2 | 4 | 1 | 0 | +18 |
| Javonte Green | DET | 17 | 5-8 | 4-6 | 2 | 1 | 3 | 0 | +20 |
| Tobias Harris | DET | 15 | 6-11 | 2-3 | 5 | 2 | 1 | 0 | +18 |
| Ronald Holland II | DET | 15 | 4-7 | 0-3 | 3 | 0 | 1 | 0 | -7 |
| Jalen Duren | DET | 14 | 6-7 | 0-0 | 10 | 2 | 0 | 1 | +21 |
| Isaiah Stewart | DET | 13 | 5-5 | 0-0 | 5 | 4 | 0 | 2 | +9 |
| Kevin Huerter | DET | 12 | 4-13 | 2-7 | 4 | 4 | 2 | 0 | +7 |
| Cade Cunningham | DET | 8 | 3-6 | 0-2 | 5 | 13 | 2 | 1 | +27 |
| MarJon Beauchamp | PHI | 17 | 7-13 | 2-7 | 6 | 2 | 0 | 1 | -1 |
| Jabari Walker | PHI | 16 | 6-6 | 2-2 | 1 | 2 | 0 | 0 | -5 |
| Cameron Payne | PHI | 15 | 5-10 | 2-6 | 1 | 2 | 0 | 0 | -9 |
| Quentin Grimes | PHI | 14 | 5-14 | 1-8 | 3 | 5 | 1 | 1 | -28 |
| Justin Edwards | PHI | 12 | 5-11 | 0-2 | 9 | 5 | 4 | 0 | -5 |
| Dominick Barlow | PHI | 11 | 5-10 | 1-3 | 4 | 0 | 2 | 1 | -16 |
| VJ Edgecombe | PHI | 10 | 3-14 | 0-5 | 5 | 0 | 0 | 2 | -19 |
The most important statistical takeaways
Detroit won through efficiency rather than one huge scoring performance
No Detroit starter scored more than 19 points.
That is significant.
The Pistons reached 131 points without requiring a single player to produce a 30-point performance.
Their scoring came from multiple sources.
Philadelphia’s bench was productive
Philadelphia’s reserves produced several efficient performances, particularly Beauchamp and Walker.
Walker did not miss a shot.
Beauchamp shot 7-for-13.
Payne added 15 points.
The bench therefore was not the central problem.
The starting lineup efficiency gap mattered
Philadelphia’s starters struggled with perimeter shooting.
Grimes went 1-for-8 from three.
Edgecombe went 0-for-5.
Detroit’s starting lineup included Robinson, who went 5-for-7 from three.
That difference created a significant perimeter scoring gap.
Cade’s passing changed the shape of the game
Cunningham’s eight points might appear modest in isolation.
His 13 assists tell a different story.
Detroit’s offense was not built around one player taking a large number of shots. Cunningham’s passing helped distribute opportunities throughout the lineup.
How to interpret these stats correctly
Readers looking at a box score should avoid focusing only on points.
A stronger evaluation considers several dimensions together:
Scoring: How many points did the player produce?
Efficiency: How many attempts were required?
Playmaking: Did the player create opportunities for teammates?
Rebounding: Did the player contribute possessions?
Defense: Were steals, blocks and other defensive contributions present?
Plus-minus: How did the team perform during the player’s minutes?
Using that broader framework makes the March 12 matchup easier to understand.
For example, Cunningham scored only eight points but recorded 13 assists and finished +27.
Walker scored 16 points without missing a shot but finished -5.
Both performances are useful, but they influenced the game in different ways.
Where to verify basketball statistics
For readers who want to cross-check official or historical basketball information, the NBA’s official website is a useful primary reference for league information, schedules and statistics.
Frequently Asked Questions
Who won the 76ers vs Detroit Pistons game on March 12, 2026?
The Detroit Pistons defeated the Philadelphia 76ers 131-109 at Little Caesars Arena in Detroit.
Who led Detroit in scoring?
Duncan Robinson led Detroit with 19 points, shooting 7-for-10 from the field and 5-for-7 from three-point range.
Who led Philadelphia in scoring?
MarJon Beauchamp led Philadelphia with 17 points. He shot 7-for-13 from the field and added six rebounds.
How many assists did Cade Cunningham have?
Cade Cunningham recorded 13 assists, along with eight points, five rebounds, four turnovers, two steals and one block.
Which team shot better?
Detroit shot 54% from the field, 40% from three-point range and 95% from the free-throw line. Philadelphia shot 47%, 23% and 71%, respectively.
What was the season-series record?
Detroit completed a 3-0 season-series sweep over Philadelphia according to the supplied game data.
Conclusion
The 76ers vs detroit pistons match player stats from March 12, 2026, reveal a game shaped by efficiency, ball movement and balanced scoring.
Detroit finished with 131 points on 48-of-89 shooting, including 14 three-pointers and 21 made free throws. The Pistons also produced 37 assists and 40 rebounds.
Philadelphia scored 109 points while shooting 42-of-90 overall and 8-of-35 from three-point range. Several 76ers reserves produced efficient individual performances, but the team could not overcome Detroit’s superior shooting and third-quarter surge.
Cade Cunningham’s 13 assists, Duncan Robinson’s five three-pointers, Jalen Duren’s double-double and Javonte Green’s efficient bench scoring were among the most notable Detroit contributions. For Philadelphia, Beauchamp’s 17 points, Walker’s perfect shooting night and Edwards’ all-around line stood out.
The quarter-by-quarter numbers provide perhaps the clearest summary: Detroit won the first quarter by nine, tied the second, won the third by 14, and entered the final period with enough separation to withstand Philadelphia’s late response.