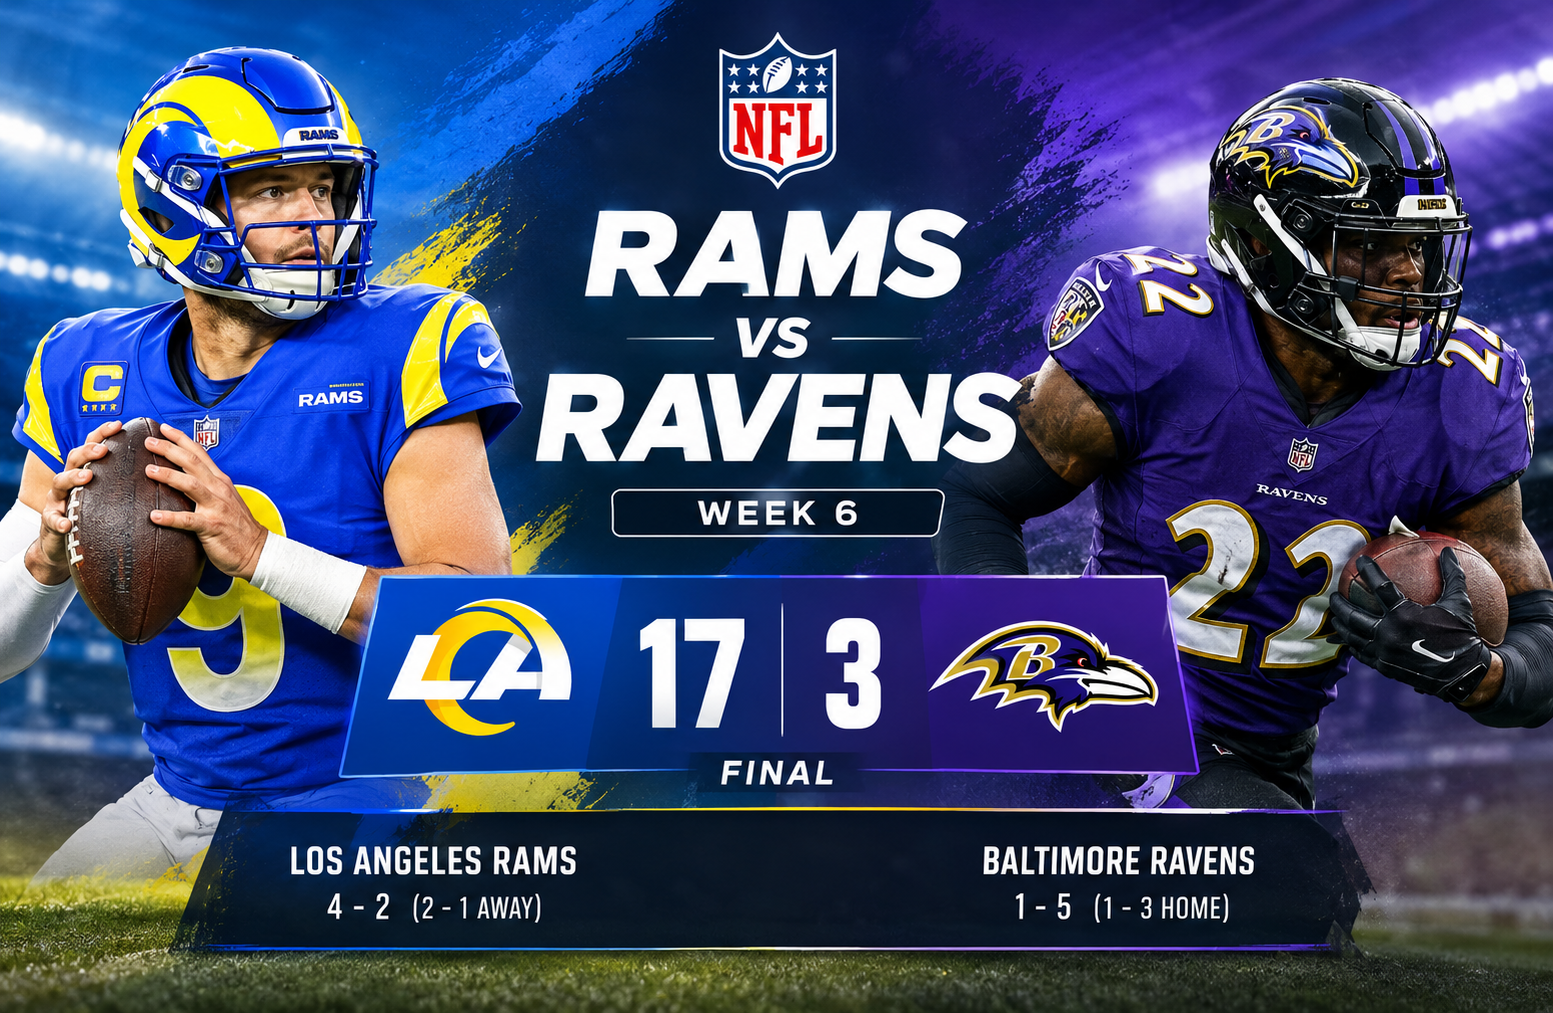
Los Angeles Rams vs Baltimore Ravens Match Player Stats
The los angeles rams vs baltimore ravens match player stats from October 12, 2025, tell the story of a defensive battle that turned into a decisive victory for Los Angeles. The Rams defeated the Ravens 17-3 in their Week 6 NFL matchup, using a dominant third quarter, effective quarterback play from Matthew Stafford, and relentless defensive pressure to secure the win. Baltimore produced more combined rushing and passing yards, but the team struggled to turn those gains into points. Derrick Henry ran for 122 yards, while Kyren Williams scored a rushing touchdown and contributed as a receiver. The final result showed that offensive yardage alone does not guarantee success when turnovers, pressure, and scoring opportunities determine the outcome.
The game is particularly interesting because the two teams followed very different statistical paths. Baltimore gained 179 rushing yards and 117 passing yards, compared with Los Angeles’ 74 rushing yards and 181 passing yards. Despite that advantage in combined offensive yardage, the Ravens finished with only three points. The Rams made their biggest move after halftime, scoring 14 points in the third quarter and keeping Baltimore off the scoreboard for the final three quarters.
For readers examining individual performances, quarterback efficiency, rushing production, receiving contributions, defensive statistics, and turnovers provide a clearer explanation of how the contest unfolded than the final score alone.
Los Angeles Rams vs Baltimore Ravens Match Player Stats: Game Overview
The Week 6 matchup took place on October 12, 2025, with Baltimore hosting Los Angeles. The Rams left with a 17-3 victory, improving their record to 4-2, while the Ravens fell to 1-5.
| Game detail | Result |
| Match date | October 12, 2025 |
| NFL week | Week 6 |
| Home team | Baltimore Ravens |
| Away team | Los Angeles Rams |
| Final score | Rams 17, Ravens 3 |
| Winning margin | 14 points |
| Rams record shown | 4-2 |
| Ravens record shown | 1-5 |
| Rams passing yards | 181 |
| Ravens passing yards | 117 |
| Rams rushing yards | 74 |
| Ravens rushing yards | 179 |
| Rams team sacks | 4 |
| Ravens team sacks | 2 |
The numbers highlight an important contrast. Baltimore had the stronger rushing output, but Los Angeles gained more through the air, recorded more sacks, and created a critical interception. The Rams also converted their third-quarter opportunities into two touchdowns, giving their defense a comfortable lead to protect.
The official ESPN game box score provides the statistical record for this matchup.
Quarter-by-Quarter Score Breakdown
The scoring pattern explains why the Rams won despite Baltimore’s advantage on the ground. The opening half was low-scoring, but Los Angeles took control after the break.
| Quarter | Los Angeles Rams | Baltimore Ravens |
| First quarter | 0 | 3 |
| Second quarter | 3 | 0 |
| Third quarter | 14 | 0 |
| Fourth quarter | 0 | 0 |
| Final score | 17 | 3 |
First quarter: Baltimore takes the early lead
The Ravens opened the scoring with a field goal from Tyler Loop. That gave Baltimore a 3-0 lead, but the offense could not build on the early advantage.
Los Angeles failed to score in the opening quarter. The Rams needed to improve their offensive rhythm and find a way to turn their possessions into points.
Second quarter: The Rams level the contest
Joshua Karty converted a field goal for Los Angeles, bringing the score to 3-3. Neither team managed to establish a significant scoring advantage before halftime.
For the Rams, tying the game kept the contest within reach. For Baltimore, the inability to score a touchdown meant the early field goal remained its only scoring contribution.
Third quarter: Los Angeles creates separation
The decisive period arrived after halftime. The Rams scored 14 unanswered points, moving from a tied game to a 17-3 advantage.
Kyren Williams supplied a rushing touchdown, while Tyler Higbee caught a touchdown pass from Stafford. These two scoring plays gave Los Angeles the cushion it needed.
Baltimore failed to answer during the quarter. Its rushing production remained impressive, but the offense could not turn that movement into points.
Fourth quarter: The defense protects the lead
Neither team scored in the final quarter. Los Angeles maintained its 14-point advantage, and Baltimore finished the game without a touchdown.
The fourth quarter reinforced the central lesson of the matchup: the Rams did not need to dominate every offensive category. They needed to protect the football more effectively, make their scoring opportunities count, and prevent Baltimore from completing a comeback.
Quarterback Statistics: Matthew Stafford vs Baltimore’s Passing Options
Quarterback performance was one of the most important differences in the game. Matthew Stafford delivered the more productive passing performance for Los Angeles, while Baltimore used both Cooper Rush and Tyler Huntley but struggled to create consistent offensive results.
Matthew Stafford’s passing performance
| Statistic | Matthew Stafford |
| Completions | 17 |
| Pass attempts | 26 |
| Completion percentage | 65.4% |
| Passing yards | 181 |
| Yards per attempt | 7.0 |
| Passing touchdowns | 1 |
| Interceptions | 0 |
| Sacks taken | 2 |
| Sack yardage lost | 14 |
| ESPN QBR | 60.6 |
| Passer rating | 98.4 |
Stafford completed 17 of 26 attempts, finishing with 181 passing yards and one touchdown. His completion percentage of 65.4% indicates that he connected on nearly two-thirds of his passes.
His 7.0 yards per attempt also shows that Los Angeles generated more passing yardage per throw than Baltimore’s listed team average would suggest for the individual quarterbacks. Stafford did not throw an interception, an important factor in a game where the Rams defense repeatedly stopped the Ravens from scoring.
Two sacks for 14 yards lost show that Stafford was not completely protected. However, the Rams avoided the passing mistakes that can allow an opponent to recover from a scoring deficit.
The key distinction is that Stafford’s contribution was efficient rather than exceptionally high-volume. Los Angeles did not need him to throw for 300 yards. His passing production, combined with a rushing touchdown and defensive stops, was enough to win.
Cooper Rush’s passing statistics
| Statistic | Cooper Rush |
| Completions | 11 |
| Pass attempts | 19 |
| Completion percentage | 57.9% |
| Passing yards | 72 |
| Yards per attempt | 3.8 |
| Passing touchdowns | 0 |
| Interceptions | 1 |
| Sacks taken | 0 |
| ESPN QBR | 19.4 |
| Passer rating | 44.2 |
Rush completed 11 of 19 passes for 72 yards. His 3.8 yards per attempt indicates that Baltimore struggled to produce substantial gains through his passing attempts.
He did not throw a touchdown and recorded one interception. The interception was credited to Rams defender Quentin Lake, giving Los Angeles another important defensive result.
Rush’s passer rating of 44.2 reflects a difficult statistical outing. Although completion percentage can provide a quick indication of accuracy, it does not show the full picture. Yardage per attempt, touchdowns, turnovers, and the ability to sustain drives are also important when evaluating quarterback performance.
Tyler Huntley’s passing statistics
| Statistic | Tyler Huntley |
| Completions | 10 |
| Pass attempts | 15 |
| Completion percentage | 66.7% |
| Passing yards | 68 |
| Yards per attempt | 4.5 |
| Passing touchdowns | 0 |
| Interceptions | 0 |
| Sacks taken | 4 |
| Sack yardage lost | 23 |
| ESPN QBR | 55.0 |
| Passer rating | 76.5 |
Huntley completed 10 of 15 passes, producing a completion percentage of 66.7%. However, those completions generated only 68 passing yards, with no touchdown.
The difference between completion percentage and offensive effectiveness is important here. A quarterback can complete many short passes without moving the offense far enough downfield to score.
Huntley also took four sacks for 23 yards lost. That pressure limited the value of his passing production and created problems for Baltimore’s ability to sustain drives.
His 13.0 yards per carry on three rushing attempts offered a different source of offensive movement. Still, those gains could not compensate for the lack of passing touchdowns and the overall scoring problem.
Quarterback comparison
| Metric | Matthew Stafford | Cooper Rush | Tyler Huntley |
| Passing yards | 181 | 72 | 68 |
| Completion percentage | 65.4% | 57.9% | 66.7% |
| Yards per attempt | 7.0 | 3.8 | 4.5 |
| Passing touchdowns | 1 | 0 | 0 |
| Interceptions | 0 | 1 | 0 |
| Sacks taken | 2 | 0 | 4 |
| Passer rating | 98.4 | 44.2 | 76.5 |
Stafford led the group in passing yards, yards per attempt, touchdowns, and passer rating. Huntley had the highest completion percentage, but his lower passing yardage and four sacks reduced his overall impact.
Rush recorded the lowest passer rating and the only interception among the three quarterbacks.
One statistical caution is necessary: the supplied team passing total for Baltimore is 117 yards, while the individual quarterback figures add up to 140 passing yards. Those figures do not reconcile, so they should not be combined as if they represent the same verified total. The individual figures are presented as supplied, and the discrepancy should be checked against the official box score before the statistics are republished.
Rushing Statistics: Derrick Henry Leads the Ground Game
The rushing matchup was one of the clearest examples of Baltimore producing strong individual numbers without securing a winning result. Derrick Henry ran for 122 yards, while the Ravens finished with 179 team rushing yards. Los Angeles recorded only 74 rushing yards, but Kyren Williams scored a touchdown that helped decide the game.
Derrick Henry’s dominant rushing output
| Statistic | Derrick Henry |
| Carries | 24 |
| Rushing yards | 122 |
| Yards per carry | 5.1 |
| Rushing touchdowns | 0 |
| Longest run | 12 yards |
| Receptions | 1 |
| Receiving yards | 8 |
Henry averaged 5.1 yards per carry on 24 attempts. His 122 rushing yards accounted for a large share of Baltimore’s ground production.
The volume and efficiency are both significant. Henry was not simply collecting yards through a large number of low-gain runs. He averaged more than five yards each time he carried the ball.
However, his longest run was 12 yards, and he did not score a rushing touchdown. This distinction matters because total yardage and scoring production measure different aspects of a running back’s performance.
Henry helped Baltimore move the ball, but the offense could not convert that production into a touchdown. His individual rushing success was real, yet it did not translate into the result the Ravens needed.
Kyren Williams’ scoring contribution
| Statistic | Kyren Williams |
| Carries | 13 |
| Rushing yards | 50 |
| Yards per carry | 3.8 |
| Rushing touchdowns | 1 |
| Longest run | 13 yards |
| Receptions | 2 |
| Receiving yards | 37 |
| Longest reception | 30 yards |
Williams gained 50 rushing yards on 13 carries and scored a rushing touchdown. His 3.8 yards per carry was below Henry’s average, but his scoring contribution made his performance especially valuable.
Williams also caught two passes for 37 yards. That receiving output gave him 87 combined rushing and receiving yards from scrimmage, excluding any other contributions.
His 30-yard reception was his longest catch in the supplied statistics. It demonstrates why evaluating a running back solely by rushing totals can overlook meaningful contributions to the passing game.
Williams did not need to match Henry’s total yardage to have an important effect on the result. His touchdown came during a game in which scoring opportunities were limited, making that conversion particularly valuable.
Blake Corum provides additional rushing support
Blake Corum carried the ball five times for 23 yards, averaging 4.6 yards per attempt. He did not score a rushing touchdown.
Corum’s average exceeded Williams’ 3.8 yards per carry, although his smaller workload makes a direct comparison incomplete. Williams carried the ball more often and scored, while Corum offered a secondary rushing option.
Stafford also recorded four carries for one rushing yard, and Terrance Ferguson had one carry for no gain.
Baltimore’s other rushing contributors
| Player | Carries | Rushing yards | Average |
| Derrick Henry | 24 | 122 | 5.1 |
| Tyler Huntley | 3 | 39 | 13.0 |
| Justice Hill | 6 | 16 | 2.7 |
| Mark Andrews | 3 | 2 | 0.7 |
| Cooper Rush | 1 | 0 | 0.0 |
Huntley’s 39 rushing yards on three carries added another dimension to Baltimore’s ground attack. His 13.0 yards per carry was the highest average among the listed Ravens rushers.
Justice Hill contributed 16 yards on six attempts, while Mark Andrews had two rushing yards on three carries.
The Ravens’ combined rushing total of 179 yards was substantially higher than the Rams’ 74 yards. Yet Baltimore failed to score a rushing touchdown. That contrast shows why rushing efficiency should be assessed alongside red-zone execution, turnovers, and points.
Team rushing comparison
| Team statistic | Rams | Ravens |
| Rushing attempts | 23 | 37 |
| Rushing yards | 74 | 179 |
| Yards per carry | 3.2 | 4.8 |
| Rushing touchdowns | 1 | 0 |
Baltimore gained 105 more rushing yards than Los Angeles. The Ravens also averaged 1.6 more yards per carry.
Nevertheless, the Rams’ one rushing touchdown was more important to the final score than Baltimore’s larger yardage total. This does not mean rushing yards are unimportant. Instead, it shows that moving the ball and finishing a drive are separate tasks.
Receiving Statistics: Tyler Higbee and Kyren Williams Make Key Contributions
The receiving numbers reveal another difference between the teams. Los Angeles spread its production among several players, while Baltimore’s leading receiver gained fewer yards despite recording more receptions than any Rams receiver in the supplied figures.
Rams receiving leaders
| Player | Receptions | Receiving yards | Yards per catch | Touchdowns |
| Tyler Higbee | 4 | 40 | 10.0 | 1 |
| Davante Adams | 4 | 39 | 9.8 | 0 |
| Kyren Williams | 2 | 37 | 18.5 | 0 |
| Puka Nacua | 2 | 28 | 14.0 | 0 |
| Jordan Whittington | 3 | 23 | 7.7 | 0 |
| Davis Allen | 1 | 7 | 7.0 | 0 |
| Konata Mumpfield | 1 | 7 | 7.0 | 0 |
Note: The table reproduces the supplied receiving figures. Player totals should be checked against the official box score before publication if a fully reconciled statistical record is required.
Tyler Higbee’s touchdown changes the game
Higbee caught four passes for 40 yards and one touchdown. His average of 10.0 yards per reception was solid, and the touchdown made his contribution especially important.
In a game where Los Angeles scored only 17 points, each touchdown carried considerable weight. Higbee’s scoring reception helped extend the Rams’ advantage during their decisive third quarter.
His output also shows why receptions and yardage alone cannot fully describe a receiver’s impact. A player with fewer yards can still deliver one of the most important performances of a game by converting a scoring opportunity.
Davante Adams provides a reliable target
Adams caught four passes for 39 yards on nine targets. His longest reception was 21 yards.
His reception count matched Higbee’s, but Adams received more targets. That means his catch rate was lower, at approximately 44.4%, compared with Higbee’s 100% on four targets.
Catch rate needs context, however. Targets can differ in difficulty, depth, and coverage. The supplied figures do not identify the circumstances of each missed connection, so they cannot establish that Adams performed poorly. His 39 yards still contributed to the Rams’ passing production.
Kyren Williams adds value through the air
Williams recorded two receptions for 37 yards, averaging 18.5 yards per catch. His longest reception was 30 yards.
That receiving production was nearly as large as Higbee’s 40 yards and close to Adams’ 39. It demonstrates how the Rams could use Williams beyond conventional rushing plays.
His combined contribution was particularly useful because Los Angeles’ rushing attack produced only 74 yards as a team. Receiving gains helped offset that limitation and gave the offense another way to advance the ball.
Puka Nacua contributes in limited opportunities
Nacua finished with two receptions for 28 yards, including a 23-yard catch. Although his reception total was modest, he averaged 14.0 yards per catch.
A small number of receptions does not necessarily indicate an unproductive outing. A receiver’s involvement depends on targets, coverage, route assignments, and how the offense distributes opportunities. The supplied figures establish Nacua’s production but do not explain every aspect of his role.
Ravens receiving leaders
| Player | Receptions | Receiving yards | Yards per catch |
| Zay Flowers | 6 | 46 | 7.7 |
| Justice Hill | 5 | 28 | 5.6 |
| Mark Andrews | 4 | 24 | 6.0 |
| DeAndre Hopkins | 2 | 20 | 10.0 |
| Derrick Henry | 1 | 8 | 8.0 |
| Rashod Bateman | 1 | 8 | 8.0 |
| Isaiah Likely | 2 | 6 | 3.0 |
Zay Flowers leads Baltimore in receiving yards
Flowers caught six passes for 46 yards on 10 targets. His longest reception was 18 yards, and he did not score a touchdown.
His six catches led the listed Ravens receivers in receptions and receiving yards. However, the 7.7-yard average per catch suggests that most of his production came through shorter gains rather than large downfield plays.
Flowers also had a fumble lost, according to the supplied turnover data. That is a meaningful negative contribution because a turnover can erase the value of a productive receiving performance.
Justice Hill and Mark Andrews support the passing game
Hill caught five passes for 28 yards, while Andrews recorded four catches for 24 yards. Neither player scored a receiving touchdown.
Hill’s receiving contribution added to his 16 rushing yards. Andrews also had two rushing yards, giving both players roles across multiple parts of Baltimore’s offense.
The issue for the Ravens was not a complete absence of receptions. They recorded 21 catches as a team in the supplied team statistics. The bigger challenge was turning those completions into enough yardage and scoring opportunities to threaten Los Angeles.
Team receiving comparison
| Team statistic | Rams | Ravens |
| Receptions | 17 | 21 |
| Receiving yards | 181 | 140 |
| Yards per reception | 10.6 | 6.7 |
| Receiving touchdowns | 1 | 0 |
| Targets | 26 | 32 |
The supplied team receiving figures show Los Angeles gaining 181 yards on 17 receptions, compared with Baltimore’s 140 yards on 21 receptions. The Rams averaged 10.6 yards per reception, while the Ravens averaged 6.7.
These figures suggest that Los Angeles generated more yardage from each completed pass. Baltimore recorded more catches, but those catches produced less overall yardage and no receiving touchdowns.
There is a data distinction worth preserving: the supplied Rams team receiving yardage matches Stafford’s 181 passing yards, while the supplied Ravens receiving total of 140 does not match the listed team passing total of 117. Because official passing and receiving totals normally reconcile, the Ravens figures should be verified before they are used for a formal statistical database.
Defensive Player Stats: How the Rams Controlled Baltimore
The defensive statistics offer one of the strongest explanations for the final result. Los Angeles recorded four sacks, 11 quarterback hits, seven tackles for loss, and an interception. Baltimore managed two sacks and three quarterback hits.
Those numbers suggest that the Rams created more disruption around the pocket and forced Baltimore to work under pressure. The Ravens’ offense could gain yards, particularly through Henry, but sustaining drives became much harder when passing plays failed to develop.
Byron Young leads the Rams’ pass rush
| Defensive statistic | Byron Young |
| Total tackles | 8 |
| Solo tackles | 4 |
| Sacks | 2 |
| Tackles for loss | 2 |
Young recorded eight tackles, including four solo tackles, and two sacks. His pressure on the quarterback was among the most significant defensive contributions in the game.
Sacks matter for more than the yards lost on a single play. They can create long-yardage situations, disrupt offensive timing, and make subsequent passing attempts more predictable. Young’s two sacks helped the Rams maintain pressure without needing to rely entirely on the secondary to stop Baltimore.
Jared Verse adds another defensive threat
Verse finished with six tackles, three solo tackles, one sack, and two tackles for loss.
His production complemented Young’s work. When multiple defenders can generate pressure, the offense has fewer opportunities to settle into a consistent passing rhythm.
The Rams finished with four team sacks, and Young and Verse accounted for three of them in the supplied individual statistics. That concentration of pressure highlights the importance of the defensive front in the result.
Nate Landman leads the Rams in tackles
| Rams defender | Total tackles | Solo tackles | Other contributions |
| Nate Landman | 17 | 8 | Led the team in tackles |
| Byron Young | 8 | 4 | 2 sacks, 2 tackles for loss |
| Shaun Dolac | 7 | 6 | High solo-tackle total |
| Jared Verse | 6 | 3 | 1 sack, 2 tackles for loss |
| Tyler Davis | 6 | Not specified | Defensive contribution |
| Quentin Lake | 6 | Not specified | 1 interception |
Landman’s 17 tackles were the highest individual total in the supplied Rams defensive statistics. Eight were solo tackles.
A high tackle total often reflects involvement in many defensive plays, but it does not automatically mean a player was the best defender. Tackles can occur after short gains, long gains, or successful stops. Landman’s total is best understood alongside the pass rush and turnover figures.
Quentin Lake’s interception proves important
Lake recorded an interception, giving Los Angeles a turnover that Baltimore could not match through the air. The supplied statistics list no interceptions for the Ravens.
An interception can change a game in several ways. It ends the opponent’s possession, creates a new opportunity for the offense, and may affect the opposing quarterback’s willingness to attempt more aggressive throws.
Lake’s interception was especially valuable in a game where the Ravens scored only three points. Los Angeles did not need a defensive touchdown to benefit from the play. Simply ending a Baltimore possession without allowing additional points helped preserve the lead.
Baltimore’s defensive leaders
| Ravens defender | Total tackles | Solo tackles | Sacks |
| Trenton Simpson | 9 | 4 | 0.5 |
| Teddye Buchanan | 9 | 3 | 0.5 |
| Alohi Gilman | 7 | 4 | 0 |
| Malaki Starks | 5 | 4 | 0 |
| Kyle Hamilton | 4 | 2 | 0 |
| John Jenkins | 3 | 2 | 1 |
Simpson and Buchanan tied for the highest tackle total among the listed Ravens defenders, with nine each. Both recorded half a sack.
Jenkins added one sack and one tackle for loss. Baltimore’s defense did make plays behind the line of scrimmage, but it finished with fewer sacks and quarterback hits than Los Angeles.
The Ravens’ defensive performance should not be judged solely by the 17 points allowed. They limited the Rams to 74 rushing yards and two field-goal attempts by Karty, one of which was successful. However, the Rams converted their third-quarter opportunities into touchdowns, which ultimately made the difference.
Team defensive comparison
| Statistic | Rams | Ravens |
| Total tackles | 87 | 54 |
| Solo tackles | 47 | 30 |
| Sacks | 4 | 2 |
| Tackles for loss | 7 | 4 |
| Passes defended | 4 | 2 |
| Quarterback hits | 11 | 3 |
| Interceptions | 1 | 0 |
| Defensive touchdowns | 0 | 0 |
The tackle totals should be interpreted with care because defensive snaps, play volume, and statistical recording affect those figures. Still, the difference in sacks and quarterback hits provides a clearer comparison of the pressure each defense generated.
Los Angeles recorded eight more quarterback hits and twice as many sacks as Baltimore. The Rams also secured the only interception.
These are meaningful differences because they show how a defense can influence a game even when the opponent is moving the ball on the ground.
Turnovers and Fumbles: The Hidden Cost of Mistakes
Turnovers were another important part of the statistical story. The supplied data lists two Rams fumbles, with one lost, and three Ravens fumbles, with two lost.
| Turnover statistic | Rams | Ravens |
| Team fumbles | 2 | 3 |
| Fumbles lost | 1 | 2 |
| Interceptions thrown | 0 | 1 |
| Interceptions recorded by defense | 1 | 0 |
The Rams had one fewer lost fumble than Baltimore, and they recorded the game’s only interception. This combination indicates that the Ravens gave away possession more frequently in the supplied figures.
A turnover is not simply a negative entry in a box score. It can erase a promising drive, provide the opponent with another possession, or reduce the time available for a comeback.
Matthew Stafford’s fumbles
Stafford was listed with two fumbles and one lost fumble. That is a reminder that even the winning quarterback’s performance was not completely free of mistakes.
The Rams still won because the offense produced enough points and the defense prevented Baltimore from capitalizing on its opportunities. A quarterback’s overall performance should account for both positive production and mistakes rather than focusing only on passing yards or touchdowns.
Baltimore’s lost fumbles
Cooper Rush and Zay Flowers were each listed with a lost fumble. Isaiah Likely was also listed with a fumble, although the supplied data does not mark it as lost.
The team total lists three Ravens fumbles and two lost. Because individual fumble records can include recovered or unlost fumbles, not every fumble should be counted as a turnover.
The most important point is that Baltimore’s mistakes compounded its scoring problem. When a team is struggling to reach the end zone, losing possessions makes it even harder to recover.
The individual and team fumble-recovery entries in the supplied data are not fully reconciled, so the detailed recovery assignments should be checked against the official box score before publication.
Special Teams Statistics: Kicking, Punting, and Returns
Special teams did not produce a touchdown in the supplied figures, but kicking and field position remained part of the contest.
Kicking comparison
| Statistic | Joshua Karty, Rams | Tyler Loop, Ravens |
| Field goals made | 1 | 1 |
| Field goals attempted | 2 | 1 |
| Field-goal percentage | 50.0% | 100.0% |
| Longest field goal | 36 yards | 37 yards |
| Extra points made | 2 | 0 |
| Extra points attempted | 2 | 0 |
| Total points | 5 | 3 |
Karty made one of two field-goal attempts and converted both extra points. His five points contributed to the Rams’ total of 17.
Loop made his only field-goal attempt, a 37-yard kick that gave Baltimore its three points. The Ravens did not score a touchdown, so they did not attempt an extra point.
The kicking numbers demonstrate the limits of field goals when an offense cannot reach the end zone. Baltimore converted its opportunity, but it needed additional scoring drives to challenge the Rams.
Punting statistics
| Statistic | Ethan Evans, Rams | Jordan Stout, Ravens |
| Punts | 2 | 1 |
| Total punt yards | 113 | 53 |
| Average punt distance | 56.5 yards | 53.0 yards |
| Longest punt | 58 yards | 53 yards |
| Touchbacks | 0 | 1 |
Evans averaged 56.5 yards across two punts, while Stout averaged 53.0 yards on one punt. These averages describe distance, not the complete value of each kick.
A punt’s effect also depends on where it lands, whether the receiving team returns it, and the resulting field position. Evans’ two punts and Stout’s one punt are too small a sample to establish broad conclusions about either punter’s season-long ability.
Kick and punt returns
| Return statistic | Rams | Ravens |
| Kick returns | 2 | 3 |
| Kick-return yards | 25 | 61 |
| Average kick-return yards | 12.5 | 20.3 |
| Longest kick return | 15 yards | 25 yards |
| Punt returns | 0 listed | 1 |
| Punt-return yards | 0 listed | 35 |
Xavier Smith recorded two Rams kick returns for 25 yards. Baltimore recorded three kick returns for 61 yards, with Tylan Wallace producing the longest listed return at 25 yards.
LaJohntay Wester added a 35-yard punt return for the Ravens. That return was a useful special-teams contribution, although it did not lead to a touchdown in the supplied scoring summary.
The return numbers show that Baltimore generated more yardage on special teams. However, return yardage alone cannot establish whether a team won the field-position battle. Starting field position after each return and the resulting offensive drives would be needed for a complete assessment.
Why the Rams Won Despite Baltimore’s Yardage Advantage
The most revealing aspect of the game is the contrast between total offense and scoring.
According to the supplied team totals, Los Angeles recorded 255 combined passing and rushing yards, while Baltimore recorded 296. The Ravens therefore gained 41 more yards but lost by 14 points.
That difference is not contradictory. Football games are decided by points, and yardage measures movement rather than the value of every possession.
Four factors help explain the result.
1. The Rams finished their scoring opportunities
Los Angeles scored one rushing touchdown and one receiving touchdown, then added a field goal. Baltimore scored only one field goal.
The Rams’ 14-point third quarter was the game’s decisive stretch. Both touchdowns created a lead that Baltimore could not overcome.
2. The Rams generated more defensive pressure
Los Angeles recorded four sacks and 11 quarterback hits. Baltimore managed two sacks and three quarterback hits.
The pressure disrupted the Ravens’ passing game and made it more difficult to sustain drives. Even though Henry ran effectively, a strong rushing performance could not make up for an offense that failed to score a touchdown.
3. Baltimore lost more possessions
The supplied statistics list two lost Ravens fumbles and one Rams interception. Los Angeles also recorded the only interception of the game.
Turnovers reduce the number of opportunities an offense has to score. For a team that finishes with just three points, losing possessions is especially damaging.
4. Passing efficiency favored Los Angeles
Stafford produced 181 passing yards, one touchdown, no interceptions, and a 98.4 passer rating. Rush and Huntley combined for no passing touchdowns in their individual lines, while Rush threw an interception and Huntley took four sacks.
The supplied Baltimore team passing total needs verification, as noted earlier. Even so, the individual quarterback figures show that Stafford had the most productive passing performance among the listed quarterbacks.
The Rams did not dominate every statistical category. They won by combining effective passing, timely touchdowns, and a defense that prevented Baltimore from turning its yardage into points.
What the Match Player Stats Reveal for NFL Fans
The numbers from this game are useful for more than recalling the final score. They show how to evaluate player contributions in a way that avoids common statistical mistakes.
Look beyond total yards
Henry’s 122 rushing yards were an excellent individual result, but they did not lead to a Baltimore victory. A rushing total should be read alongside touchdowns, turnovers, and the team’s final scoring output.
Compare efficiency with workload
Stafford’s 181 passing yards came on 26 attempts. Henry’s 122 rushing yards came on 24 carries. These numbers describe different kinds of work, so they should not be compared directly as though a pass attempt and a rushing attempt were identical.
Instead, use yards per attempt, yards per carry, completion percentage, and touchdowns to understand how players produced their totals.
Separate individual performance from team performance
Flowers led the listed Ravens receivers with 46 yards, and Henry led Baltimore’s rushers with 122 yards. Neither player scored a touchdown in the supplied figures.
Their individual contributions were meaningful, but football is a team sport. Offensive line performance, quarterback decisions, defensive pressure, and turnovers all affect the result.
Verify totals before drawing detailed conclusions
Box-score statistics should reconcile across passing, receiving, rushing, and team totals. When they do not, readers should avoid combining conflicting figures without checking the official record.
For this matchup, the supplied Baltimore passing and receiving figures contain discrepancies. The final score, quarter-by-quarter points, and the individual player statistics can still be discussed, but any precise team-total analysis should preserve that qualification.
This approach makes a statistical article more useful and trustworthy. It tells readers what the numbers show without pretending that inconsistent data is perfectly settled.
Frequently Asked Questions
1. What was the final score of the Los Angeles Rams vs Baltimore Ravens game on October 12, 2025?
The Los Angeles Rams defeated the Baltimore Ravens 17-3 in their Week 6 NFL matchup on October 12, 2025. Los Angeles scored 14 points in the third quarter, while Baltimore scored only a first-quarter field goal.
2. How many passing yards did Matthew Stafford record against the Ravens?
Matthew Stafford completed 17 of 26 passes for 181 yards and one touchdown. He threw no interceptions, took two sacks for 14 yards lost, and recorded a passer rating of 98.4.
3. How many rushing yards did Derrick Henry have against the Rams?
Derrick Henry recorded 122 rushing yards on 24 carries, averaging 5.1 yards per carry. He did not score a rushing touchdown, despite leading the Ravens’ ground attack.
4. Who led the Rams in receiving against Baltimore?
Tyler Higbee led the supplied Rams receiving statistics with 40 yards and one touchdown on four receptions. Davante Adams also caught four passes, finishing with 39 receiving yards.
5. Which team had more total offensive yards?
The supplied combined totals list Baltimore with 296 passing and rushing yards and Los Angeles with 255. Baltimore therefore had 41 more combined yards, but the Rams won 17-3 because they converted their scoring opportunities more effectively. The supplied Baltimore passing and receiving totals do not fully reconcile, so those combined figures should be verified before publication.
6. Which Rams defenders recorded sacks against the Ravens?
Byron Young recorded two sacks, and Jared Verse recorded one. The Rams finished with four team sacks. The remaining sack production should be checked against the official defensive box score when identifying every individual contributor.
Conclusion
The October 12, 2025, matchup between Los Angeles and Baltimore demonstrated why football statistics must be evaluated together rather than in isolation. The Rams won 17-3 after scoring 14 points in the third quarter, while their defense limited Baltimore to a single field goal.
Matthew Stafford completed 17 of 26 passes for 181 yards and one touchdown without throwing an interception. Kyren Williams contributed 50 rushing yards, a rushing touchdown, and 37 receiving yards. Tyler Higbee added four catches for 40 yards and a touchdown, while Byron Young recorded two sacks and Quentin Lake intercepted a Baltimore pass.
For the Ravens, Derrick Henry’s 122 rushing yards and Zay Flowers’ 46 receiving yards stood out individually. Baltimore also produced more combined passing and rushing yards in the supplied figures. However, the offense did not score a touchdown, and the team’s turnovers and struggles against the Rams’ pass rush made it difficult to turn those gains into points.
The central lesson from the los angeles rams vs baltimore ravens match player stats is that yardage does not always determine the winner. Scoring efficiency, ball security, quarterback performance, and defensive pressure can have a greater influence on the final result than any single statistical category. Readers should also verify the conflicting Baltimore passing and receiving totals against the official box score before using them in detailed statistical comparisons.