Toronto Raptors vs San Antonio Spurs Match Player Stats
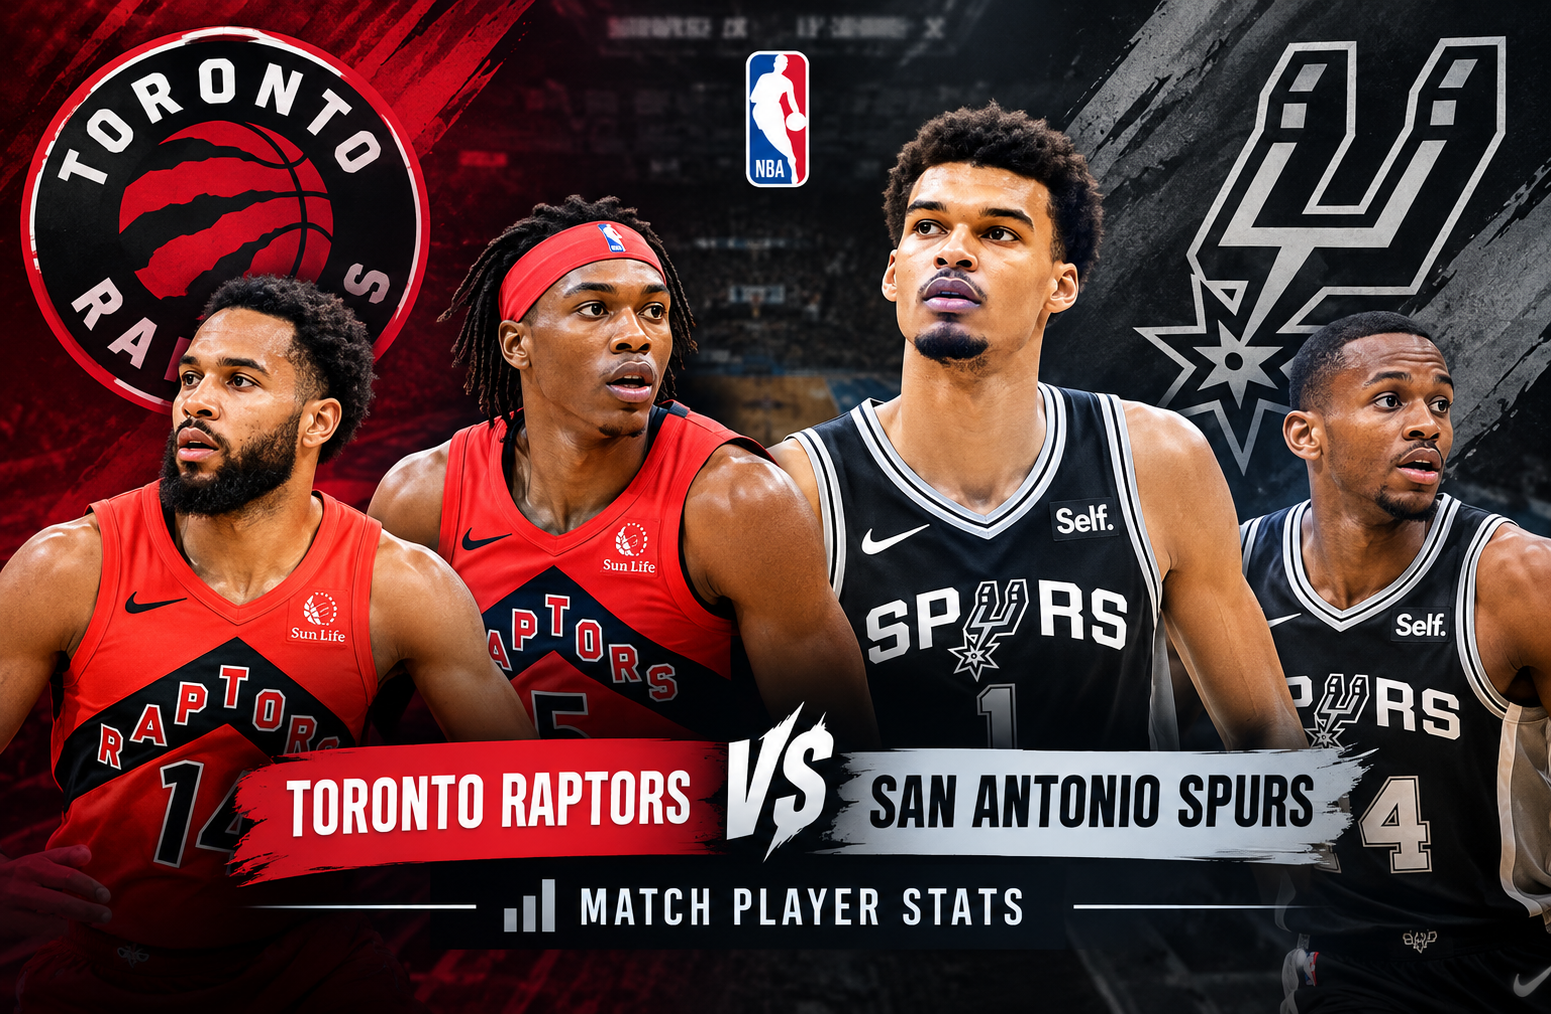
The toronto raptors vs san antonio spurs match player stats from February 25, 2026, tell a much more interesting story than the final score alone. San Antonio defeated Toronto 110-107 at Scotiabank Arena, but the Spurs did not control the game from start to finish. Toronto built a 15-point advantage late in the third quarter before San Antonio produced a decisive fourth-quarter response, winning the final period 32-17. Devin Vassell led the Spurs with 21 points, while De’Aaron Fox added 20. For Toronto, Brandon Ingram and Immanuel Quickley each scored 20 points. Victor Wembanyama had only 12 points, but his five blocks and eight rebounds became important in the closing stages. NBA official game box score
The game was played on February 25, 2026, with some listings displaying February 26 because of the late-night game timing. The official game information lists Scotiabank Arena in Toronto as the venue, with an attendance of 19,800. San Antonio entered at 42-16 and Toronto at 34-25.
Toronto Raptors vs San Antonio Spurs Match Player Stats: Game Overview
The final score was:
San Antonio Spurs 110, Toronto Raptors 107
The quarter-by-quarter scoring shows exactly how dramatically the game changed:
| Quarter | Spurs | Raptors |
| 1st | 30 | 29 |
| 2nd | 27 | 30 |
| 3rd | 21 | 31 |
| 4th | 32 | 17 |
| Final | 110 | 107 |
San Antonio led by one after the opening quarter. Toronto then took control during the second and third periods, entering the fourth quarter with a 90-78 lead.
That 12-point deficit did not survive.
The Spurs scored 32 points in the final period while limiting Toronto to only 17. The Raptors also went through an extended scoring drought to begin the fourth quarter, giving San Antonio the opening it needed to turn a potentially comfortable Toronto victory into a three-point Spurs win.
The result extended San Antonio’s winning streak to 10 games and gave the Spurs their fifth consecutive victory over Toronto.
Why These Player Stats Matter
A box score can tell you who scored the most points, but it does not automatically explain why a game was won.
This matchup is a strong example.
Wembanyama scored only 12 points on 3-of-12 shooting. On the surface, that looks like an inefficient offensive performance. However, he also collected eight rebounds, three assists, one steal and five blocks. His defensive presence affected the game even when his shot was not falling.
At the same time, Vassell converted 8 of 13 field-goal attempts and made 5 of 6 three-point attempts. Fox added 20 points on 8-of-15 shooting. Dylan Harper contributed 15 points and seven assists from the bench.
Toronto had its own impressive statistical profile. The Raptors collected 50 rebounds compared with 40 for San Antonio and grabbed 12 offensive rebounds. They also shot 23-of-27 from the free-throw line.
Yet San Antonio’s 17 made three-pointers compared with Toronto’s eight made threes created a major difference.
That is why the toronto raptors vs san antonio spurs match player stats need to be viewed collectively rather than through points alone.
San Antonio Spurs Player Stats
San Antonio received meaningful contributions from several players, with Vassell providing the most efficient scoring performance.
Devin Vassell
21 points, 8-of-13 FG, 5-of-6 3PT, 5 rebounds, 2 assists, 2 steals, +2
Vassell was the Spurs’ leading scorer and their most efficient high-volume offensive player.
His five made three-pointers were particularly important. He shot 61.5 percent from the field and 83.3 percent from three-point range.
This was not simply a high-scoring night. Vassell’s efficiency helped compensate for Wembanyama’s difficult shooting performance.
His 5-of-6 shooting from outside also explains why Toronto could not simply pack the paint against San Antonio.
De’Aaron Fox
20 points, 8-of-15 FG, 2-of-5 3PT, 2 rebounds, 1 assist, 3 turnovers, 1 steal
Fox finished with 20 points and shot 53.3 percent from the field.
His three-point shooting was not spectacular, but his ability to create points inside the arc gave San Antonio another dependable scoring option.
One unusual part of his stat line was the 2-of-8 mark from the free-throw line. Those missed opportunities prevented his scoring total from being even higher.
Fox’s +/− was -11, which is a useful reminder that plus/minus should not be treated as an individual performance grade. Basketball possessions are influenced by five-player lineups, opponent lineups and game situations.
Victor Wembanyama
12 points, 3-of-12 FG, 1-of-6 3PT, 5-of-6 FT, 8 rebounds, 3 assists, 1 steal, 5 blocks, 3 turnovers, +19
Wembanyama’s numbers are among the most revealing in the game.
His shooting was inefficient, but his overall defensive impact remained substantial.
He recorded five blocks, including a critical late-game rejection of Jakob Poeltl. He also secured the rebound after Brandon Ingram missed a potential tying three-point attempt in the closing seconds.
His +19 was the highest mark among the players listed in the game.
This is an important lesson when interpreting player statistics. A center can have a difficult shooting night while still being highly influential because of rim protection, rebounding, defensive positioning and possession-changing plays.
Dylan Harper
15 points, 7-of-11 FG, 1-of-4 3PT, 5 rebounds, 7 assists, 1 turnover, 2 steals, +1
Harper provided one of San Antonio’s most valuable all-around performances.
His seven assists were second among all players in the game, while he committed only one turnover.
The combination of 15 points, seven rebounds and two steals gave San Antonio production beyond the starting lineup.
His 7-of-11 shooting was also efficient, especially considering the pressure of a comeback situation.
Stephon Castle
13 points, 4-of-10 FG, 2-of-4 3PT, 3-of-4 FT, 3 rebounds, 5 assists, 3 turnovers, 1 steal, +11
Castle added 13 points and five assists.
His +11 reflected the impact of his minutes during a game in which San Antonio ultimately made its strongest push in the fourth quarter.
The five assists were especially useful because they complemented the scoring contributions from Vassell and Fox.
Julian Champagnie
10 points, 3-of-8 FG, 3-of-7 3PT, 6 rebounds, 5 assists, 1 steal, +14
Champagnie’s three-point shooting gave San Antonio additional spacing.
He made three triples and also contributed six rebounds and five assists.
His five assists were notable for a player who scored only 10 points. He also had a +14, showing how his overall contribution extended beyond scoring.
Champagnie also delivered the pass for Wembanyama’s third-quarter alley-oop, one of the notable moments during the Spurs’ response.
Harrison Barnes
8 points, 3-of-5 FG, 2-of-4 3PT, 3 rebounds, 2 assists, 3 steals, +1
Barnes was efficient in limited offensive usage.
He made three of five field-goal attempts and two of four three-point attempts. His three steals also provided defensive value.
Luke Kornet
6 points, 2-of-4 FG, 2-of-2 FT, 6 rebounds, 2 offensive rebounds, 4 defensive rebounds, -9
Kornet’s offensive contribution was modest, but he supplied six rebounds.
His fourth-quarter dunk was particularly important because it gave San Antonio a 93-92 lead with 7:26 remaining.
That moment represented the point at which the comeback became a genuine lead change rather than simply a late rally.
Keldon Johnson and Carter Bryant
Johnson finished with 2 points, 1 rebound and 3 assists, while Bryant recorded 3 points and 1 rebound.
Neither player produced a large scoring total, but both were part of the rotation that helped San Antonio maintain enough lineup flexibility to complete the comeback.
Toronto Raptors Player Stats
Toronto had several strong individual performances, particularly from Ingram and Quickley.
Brandon Ingram
20 points, 9-of-22 FG, 0-of-2 3PT, 2-of-2 FT, 11 rebounds, 4 assists, 4 turnovers, +1
Ingram recorded a double-double with 20 points and 11 rebounds.
His 11 rebounds were especially valuable because Toronto finished with a 50-40 overall rebounding advantage.
However, his 9-of-22 shooting meant that Toronto needed more scoring efficiency from elsewhere.
His final three-point attempt could have tied the game, but the shot missed and Wembanyama secured the rebound.
Immanuel Quickley
20 points, 6-of-12 FG, 3-of-5 3PT, 5-of-7 FT, 4 rebounds, +4
Quickley matched Ingram’s 20 points and provided some of Toronto’s best perimeter shooting.
He made three of five attempts from beyond the arc and was also 5-of-7 at the free-throw line.
His +4 was the highest plus/minus among Toronto’s primary high-scoring players.
Scottie Barnes
15 points, 7-of-13 FG, 1-of-4 3PT, 4 rebounds, 2 assists, 5 turnovers, 3 steals, 1 block, -3
Barnes had a productive scoring night, making seven of 13 field-goal attempts.
His defensive statistics were also notable. He recorded three steals and one block.
The main negative was his five turnovers, which limited some of the value created by his efficient shooting.
Jakob Poeltl
15 points, 5-of-11 FG, 5-of-5 FT, 7 rebounds, 2 assists, 1 steal, 3 blocks, +18
Poeltl was one of Toronto’s most productive players.
He made all five of his free throws and added seven rebounds and three blocks.
His +18 was the strongest plus/minus on the Raptors despite the team’s loss.
Poeltl also played an important role in the late stages, although Wembanyama blocked one of his attempts with 44 seconds remaining.
RJ Barrett
12 points, 4-of-14 FG, 1-of-6 3PT, 3-of-4 FT, 7 rebounds, 3 assists, 2 turnovers, -5
Barrett supplied 12 points and seven rebounds.
However, his shooting efficiency was lower than some of Toronto’s other contributors. He made only four of 14 field-goal attempts and one of six three-point attempts.
Jamal Shead
12 points, 3-of-7 FG, 2-of-3 3PT, 4-of-4 FT, 1 rebound, 3 assists, +6
Shead gave Toronto useful bench scoring.
His 2-of-3 shooting from three-point range and perfect 4-of-4 free-throw shooting made his 12 points efficient relative to his shot volume.
Ja’Kobe Walter
5 points, 1-of-4 FG, 3-of-3 FT, 7 rebounds, 2 assists, 1 steal, -6
Walter’s scoring was limited, but seven rebounds were valuable for a Toronto team that dominated the overall rebounding battle.
Collin Murray-Boyles
4 points, 1-of-4 FG, 1-of-1 3PT, 1-of-2 FT, 5 rebounds, 1 assist, 1 steal, -18
Murray-Boyles started against Wembanyama and collected five rebounds.
He left the game during the third quarter with a sore left thumb, according to the game report.
His +/− of -18 was the lowest among the listed Toronto players.
Sandro Mamukelashvili, Trayce Jackson-Davis and Jamison Battle
Mamukelashvili recorded 2 points and 3 rebounds.
Jackson-Davis finished with 0 points and 1 rebound.
Battle contributed 2 points and 1 turnover.
Their offensive totals were limited, but their minutes were part of Toronto’s broader rotation.
Team Statistical Comparison
The team numbers explain several of the game’s major contrasts.
| Category | Spurs | Raptors |
| Points | 110 | 107 |
| Field Goals | 40-86 | 38-90 |
| Field Goal % | 47% | 42% |
| 3PT | 17-39 | 8-23 |
| 3PT % | 44% | 35% |
| Free Throws | 13-23 | 23-27 |
| Rebounds | 40 | 50 |
| Assists | 28 | 17 |
| Turnovers | 13 | 12 |
| Steals | 11 | 6 |
| Blocks | 5 | 4 |
| Offensive Rebounds | 6 | 12 |
| Defensive Rebounds | 34 | 38 |
| Personal Fouls | 20 | 20 |
Several differences stand out immediately.
Three-Point Shooting
San Antonio made 17 three-pointers.
Toronto made eight.
That is a nine-three difference, or 27 points of additional scoring from made three-point shots.
Toronto attempted only 23 threes, compared with 39 for San Antonio.
This was one of the clearest statistical reasons the Spurs could overcome their rebounding disadvantage.
Rebounding
Toronto won the rebounding battle 50-40.
The Raptors also grabbed twice as many offensive rebounds as San Antonio, 12 to 6.
That gave Toronto additional possessions and helped explain why the team remained competitive despite its lower shooting percentages.
Free Throws
Toronto had a significant advantage at the line.
The Raptors went 23-of-27, an 85 percent rate.
San Antonio went 13-of-23, or 57 percent.
The Spurs therefore left 10 free throws unconverted, while Toronto converted at a much higher rate.
Despite this, San Antonio’s three-point advantage was large enough to offset Toronto’s free-throw edge.
Assists
San Antonio recorded 28 assists compared with Toronto’s 17.
That 11-assist difference is significant.
It suggests that the Spurs generated a greater proportion of their offense through coordinated passing and shared creation.
Harper’s seven assists, Castle’s five, Champagnie’s five and Wembanyama’s three all contributed to that total.
The Fourth Quarter Changed Everything
The most important section of the game is the fourth quarter.
Toronto entered the period with a 90-78 advantage.
The Raptors had scored 31 points in the third quarter and appeared to have control.
Instead, San Antonio scored 32 points in the final period.
Toronto scored only 17.
The turnaround began when the Spurs settled into their offensive rhythm while Toronto struggled to generate points.
San Antonio took a 93-92 lead on Kornet’s dunk with 7:26 remaining.
That lead mattered because Toronto had missed eight consecutive shots to begin the fourth quarter.
Once the Spurs moved ahead, the game became a possession-by-possession contest.
The closing sequence further demonstrated the value of defensive execution.
Wembanyama missed a late free throw, but Toronto could not convert the opportunity that followed. Ingram missed a potential tying three, and Wembanyama grabbed the rebound.
The Spurs then secured the result.
How San Antonio Won Despite Wembanyama’s Shooting
One of the most useful lessons from the toronto raptors vs san antonio spurs match player stats is that Wembanyama did not need a high-scoring night for San Antonio to win.
He shot 3-of-12 from the field.
He also made only one of six three-point attempts.
Those numbers would normally place enormous pressure on the rest of the roster.
Instead, Vassell scored 21.
Fox scored 20.
Harper scored 15.
Castle scored 13.
Champagnie scored 10.
That distribution meant Toronto could not concentrate its defensive attention on one player.
Wembanyama’s defense then provided another layer of value.
His five blocks helped protect the rim, while his eight rebounds allowed San Antonio to finish defensive possessions.
The result was a balanced team performance rather than a single-player scoring explosion.
How Toronto Built Its 12-Point Lead
Toronto’s third quarter was the strongest offensive period of the game.
The Raptors scored 31 points while San Antonio scored only 21.
The Raptors’ overall 50-40 rebounding advantage also helped them create second-chance opportunities.
Toronto’s 12 offensive rebounds were particularly important.
The combination of offensive rebounding, free-throw accuracy and interior scoring allowed the Raptors to compensate for their lower three-point volume.
The problem came when the fourth quarter began.
Toronto’s offense stopped producing at the same level.
A 12-point lead disappeared because the Raptors could not maintain the scoring pace they had established in the third.
Shooting Efficiency Versus Shot Volume
The shooting comparison deserves special attention.
San Antonio:
40-of-86 from the field
Toronto:
38-of-90 from the field
San Antonio therefore made two more field goals despite taking four fewer attempts.
That produced a meaningful field-goal percentage advantage.
The Spurs shot 47 percent overall.
The Raptors shot 42 percent.
The difference became even more pronounced from three-point range.
San Antonio shot 44 percent from deep.
Toronto shot 35 percent.
For a game decided by only three points, those differences were substantial.
Turnovers Were Not the Main Story
Both teams protected the ball reasonably well.
San Antonio committed 13 turnovers.
Toronto committed 12.
A one-turnover difference is not enough to explain the result.
This is important because turnovers can sometimes dominate a close-game analysis.
Here, the more useful areas were shooting efficiency, three-point production, assists, fourth-quarter scoring and defensive execution.
San Antonio also recorded 11 steals compared with Toronto’s six, giving the Spurs more defensive activity.
Plus/Minus Context
Plus/minus is one of the most misunderstood numbers in basketball analysis.
For this matchup, several values stand out:
Spurs
- Wembanyama: +19
- Champagnie: +14
- Castle: +11
- Fox: -11
- Kornet: -9
Raptors
- Poeltl: +18
- Ingram: +1
- Quickley: +4
- Barnes: -3
- Murray-Boyles: -18
The fact that Fox scored 20 points but finished at -11 demonstrates why plus/minus should not be interpreted in isolation.
Likewise, Poeltl’s +18 does not mean Toronto played better whenever he was on the floor in every individual possession. It simply records the team’s point differential during his minutes.
For a serious player-stat analysis, plus/minus should be considered alongside shooting, usage, rebounds, assists, turnovers and defensive events.
What the Game Reveals About Both Teams
The Spurs showed that they could win without relying on a dominant offensive performance from Wembanyama.
That is an important characteristic for a team with multiple capable scorers.
Vassell provided elite perimeter efficiency.
Fox supplied efficient scoring inside the arc.
Harper provided playmaking.
Castle added another ball-handling option.
Champagnie supplied spacing and secondary playmaking.
Toronto demonstrated that it could control the glass and generate free-throw opportunities.
The Raptors also produced strong individual performances from Ingram, Quickley, Barnes and Poeltl.
The difference was consistency.
Toronto’s best stretch came in the third quarter.
San Antonio’s best stretch came when the game was being decided.
Key Statistical Takeaways
The most important numbers from this matchup can be summarized as follows:
- San Antonio won 110-107.
- The Spurs outscored Toronto 32-17 in the fourth quarter.
- Devin Vassell led all scorers with 21 points.
- De’Aaron Fox and Brandon Ingram each scored 20 points.
- Immanuel Quickley also scored 20 for Toronto.
- Wembanyama finished with 12 points, 8 rebounds and 5 blocks.
- Dylan Harper produced 15 points and 7 assists.
- Toronto won the rebounding battle 50-40.
- San Antonio made 17 three-pointers compared with Toronto’s eight.
- Toronto shot 85 percent from the free-throw line, while San Antonio shot 57 percent.
- San Antonio recorded 28 assists compared with Toronto’s 17.
- The Spurs extended their winning streak to 10 games.
A Better Way to Read Match Player Stats
When analyzing an NBA game, it is tempting to sort players by points and stop there.
That approach misses too much.
A more complete process is:
Step 1: Start With the Final Score
The score establishes the outcome but not the reason.
Step 2: Examine Quarter Splits
Quarter-by-quarter scoring shows when momentum changed.
In this game, the fourth-quarter split was decisive.
Step 3: Compare Shooting
Field-goal percentage and three-point shooting reveal offensive efficiency.
Step 4: Check Possession-Related Statistics
Rebounds, offensive rebounds and turnovers help explain possession opportunities.
Step 5: Review Playmaking
Assists can show whether an offense depended on individual creation or ball movement.
Step 6: Examine Defensive Events
Steals and blocks provide direct evidence of defensive plays, although they do not capture every aspect of defense.
Step 7: Use Plus/Minus Carefully
Plus/minus can add context but should not replace the complete box score.
This approach gives readers a much more accurate picture than simply asking which player scored the most.
Frequently Asked Questions
Who led the Spurs in the game against the Raptors?
Devin Vassell led San Antonio with 21 points. He shot 8-of-13 from the field and 5-of-6 from three-point range.
How many points did Victor Wembanyama score?
Victor Wembanyama scored 12 points. He also had eight rebounds, three assists, one steal and five blocks.
Who led the Raptors in scoring?
Brandon Ingram and Immanuel Quickley each scored 20 points for Toronto.
What was the final score between the Spurs and Raptors?
San Antonio defeated Toronto 110-107 at Scotiabank Arena.
Which team had more rebounds?
Toronto had 50 rebounds compared with 40 for San Antonio.
How did the Spurs win after trailing in the third quarter?
San Antonio scored 32 points in the fourth quarter while holding Toronto to 17. The Spurs also made 17 three-pointers during the game compared with eight by Toronto.
Conclusion
The toronto raptors vs san antonio spurs match player stats from February 25, 2026, show how a three-point game can be decided by several different statistical factors.
Toronto controlled the boards, converted free throws at a much higher rate and built a substantial advantage during the third quarter. Brandon Ingram and Immanuel Quickley each reached 20 points, while Jakob Poeltl delivered 15 points, seven rebounds and three blocks.
San Antonio responded with superior perimeter shooting and stronger late-game execution. Devin Vassell led the scoring with 21 points, De’Aaron Fox added 20, and Dylan Harper provided 15 points with seven assists. Stephon Castle and Julian Champagnie also contributed efficiently.
Wembanyama’s performance is perhaps the clearest example of why box-score analysis should go beyond scoring. His 12 points came on difficult shooting, but his eight rebounds and five blocks had major defensive value. His late-game rebound after Ingram’s missed three helped preserve the Spurs’ three-point victory.
Ultimately, the 110-107 result was shaped by the contrast between Toronto’s rebounding and free-throw advantages and San Antonio’s three-point shooting, passing and fourth-quarter defense. The Spurs’ 32-17 final-period advantage transformed a 12-point deficit into a comeback victory and extended their winning streak to 10 games.