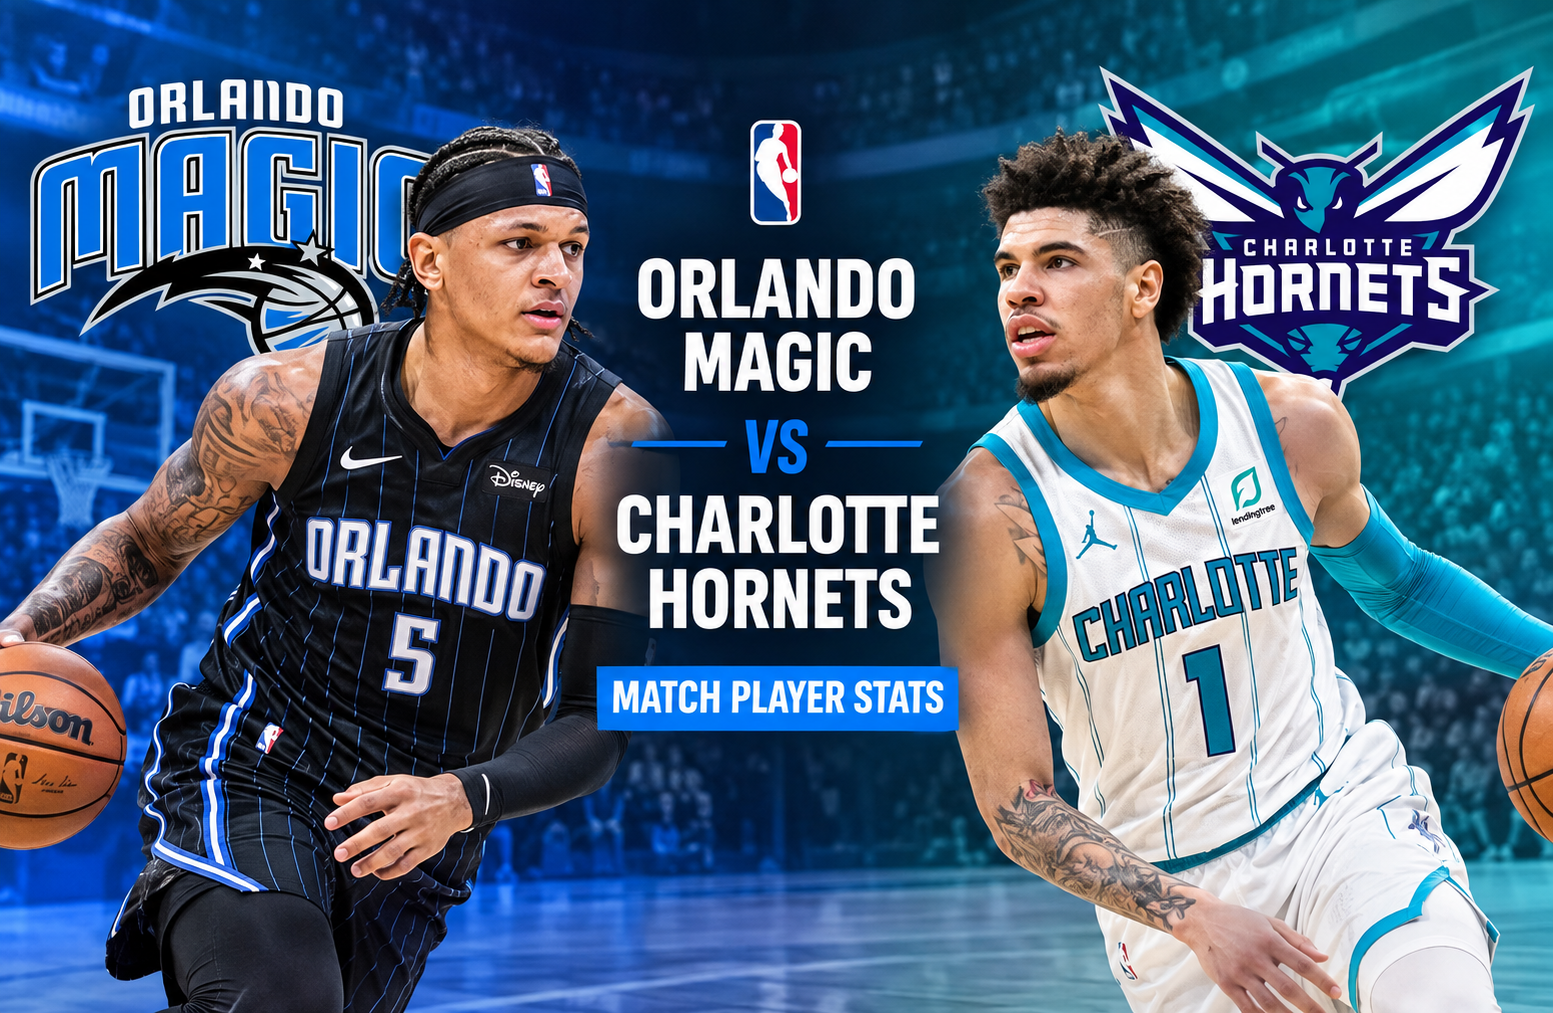
Orlando Magic vs Charlotte Hornets Match Player Stats
The orlando magic vs charlotte hornets match player stats from the 2026 NBA Play-In Tournament show a game that was decided almost immediately. Orlando defeated Charlotte 121-90 at Kia Center, building a 35-point halftime advantage and controlling the game through efficient shooting, rebounding, ball movement, and defensive pressure. Paolo Banchero led Orlando with 25 points, while LaMelo Ball paced Charlotte with 23 points.
One important date clarification is necessary. The official NBA record lists this game as Friday, April 17, 2026, not April 18. It was the Eastern Conference Play-In Tournament game for the final playoff position, and Orlando advanced as the No. 8 seed after the victory.
For anyone searching for player statistics, the headline numbers tell only part of the story. Orlando shot 50% from the field, won the rebounding battle 49-34, scored 64 points in the paint, and built a maximum lead of 35 points. Charlotte shot just 34% overall and could not recover from a disastrous opening half.
This breakdown looks beyond the final score to explain which players produced, where the game was won, how individual performances fit into the team result, and what the numbers say about both sides.
Game Overview
The matchup took place at Kia Center in Orlando, Florida, with an announced attendance of 19,005. Orlando entered the game after losing its previous Play-In matchup to Philadelphia, while Charlotte had extended its season by defeating Miami. The winner would secure the eighth and final Eastern Conference playoff position.
The stakes were straightforward. Charlotte needed a road victory to reach the playoffs, while Orlando needed to protect home court and recover from its earlier Play-In defeat.
Instead of a close elimination game, Orlando turned the contest into a one-sided performance.
Final Score
| Team | Q1 | Q2 | Q3 | Q4 | Final |
| Charlotte Hornets | 16 | 21 | 34 | 19 | 90 |
| Orlando Magic | 38 | 30 | 34 | 19 | 121 |
Orlando outscored Charlotte by 22 points in the first quarter and added another nine points to its advantage during the second. The Magic entered halftime ahead 68-37.
That 31-point halftime advantage was particularly significant. The NBA reported that it was the largest halftime lead in the history of the Play-In Tournament.
The second half therefore became more about managing the lead than competing for control of the game.
Orlando Magic vs Charlotte Hornets Match Player Stats
The orlando magic vs charlotte hornets match player stats highlight a clear contrast between the two starting groups.
Orlando had five starters in double figures:
- Paolo Banchero: 25 points
- Franz Wagner: 18 points
- Wendell Carter Jr.: 16 points
- Desmond Bane: 13 points
- Jalen Suggs: 12 points
Charlotte’s primary scoring group was led by:
- LaMelo Ball: 23 points
- Miles Bridges: 15 points
- Brandon Miller: 14 points
- Kon Knueppel: 11 points
The distribution matters. Orlando did not need one player to carry the offense. Its five starters combined for balanced scoring while also contributing rebounds, assists, steals, and defensive plays.
Charlotte, by contrast, received its biggest scoring contribution from Ball, but much of that production arrived after the game had already been effectively decided.
Paolo Banchero Leads Orlando
Paolo Banchero delivered the most important individual scoring performance of the night.
He finished with:
- 33 minutes
- 25 points
- 9-of-17 field goals
- 2-of-6 three-pointers
- 5-of-8 free throws
- 5 rebounds
- 6 assists
- 2 steals
- 1 block
- 2 turnovers
Banchero’s 25 points led all scorers. The more important part of his performance was its balance.
He did not rely entirely on three-point shooting. He made nine of his 17 field-goal attempts and also reached the free-throw line eight times.
His six assists also helped prevent Orlando’s offense from becoming one-dimensional.
The combination of scoring and playmaking was especially valuable because Charlotte had to account for Banchero as both a scorer and facilitator. When a primary forward can create shots for teammates while also attacking the basket, the defense has fewer opportunities to load up on one option.
Banchero’s two steals and one block also show that his impact extended beyond scoring.
Franz Wagner’s Efficient All-Around Game
Franz Wagner finished with 18 points, seven rebounds and six assists in only 25 minutes.
His shooting line was:
- 5-of-10 from the field
- 0-of-1 from three
- 8-of-10 from the free-throw line
The free-throw production stands out.
Wagner did not need to make several three-pointers to have an efficient scoring night. Instead, he combined interior scoring, free throws and secondary playmaking.
His six assists were tied with Banchero and Suggs for the team lead among the players listed in the supplied statistics.
Wagner also posted a remarkable +29.
Plus/minus measures the team’s point differential while a player is on the floor. It should never be treated as a complete measure of individual performance, but in a game where Orlando dominated nearly every major category, a +29 provides useful context.
Wagner was on the court for 25 minutes and Orlando outscored Charlotte by 29 during those minutes.
Wendell Carter Jr. Was Extremely Efficient
Wendell Carter Jr. produced one of the most efficient offensive performances of the game.
He scored 16 points on just seven field-goal attempts:
- 6-of-7 from the field
- 2-of-2 from three
- 2-of-4 from the free-throw line
- 6 rebounds
- 1 assist
- 1 block
His 6-of-7 shooting translates to 85.7% from the field.
Even more notable, Carter Jr. made both of his three-point attempts.
That combination forced Charlotte to respect him around the perimeter while also dealing with his interior presence.
Carter Jr. did not need a high volume of possessions to produce his 16 points. His performance is a useful example of why raw scoring totals should always be considered alongside shooting efficiency.
Desmond Bane’s Impact Went Beyond His 13 Points
Desmond Bane scored 13 points but had a less efficient shooting night than Orlando’s other primary starters.
He finished:
- 35 minutes
- 13 points
- 4-of-14 field goals
- 0-of-3 three-pointers
- 5-of-5 free throws
- 7 rebounds
- 3 steals
The 4-of-14 shooting percentage was only 28.6%, but his overall contribution was not limited to scoring.
Bane grabbed seven rebounds and recorded three steals, while his supplied plus/minus was +30, the highest among Orlando’s five starters.
That combination is important.
A player can have a below-average shooting night and still contribute positively through defense, rebounding, ball pressure, free throws and possession creation.
Bane’s three steals were especially useful in a game where Orlando generated defensive pressure and repeatedly turned stops into scoring opportunities.
Jalen Suggs Provides Two-Way Production
Jalen Suggs finished with:
- 22 minutes
- 12 points
- 5-of-8 shooting
- 2-of-5 from three
- 5 rebounds
- 6 assists
- 3 turnovers
- 1 block
Suggs shot 62.5% from the field and made two three-pointers.
His six assists were another important part of Orlando’s offensive structure.
The three turnovers are worth noting, but they did not prevent him from finishing with a +25 plus/minus according to the supplied game data.
Suggs’ performance demonstrates how Orlando’s offense could receive playmaking from several positions rather than forcing every possession through Banchero.
Orlando’s Bench Added Useful Production
The Magic did not need a huge bench scoring explosion because the starters established such a large advantage.
Still, several reserves made meaningful contributions.
Goga Bitadze
Bitadze finished with:
- 16 minutes
- 7 points
- 2-of-2 field goals
- 3-of-3 free throws
- 4 rebounds
- 2 assists
- 4 blocks
The four blocks are particularly notable.
His defensive activity gave Orlando another rim-protection option while the game was already heavily tilted toward the home team.
Jamal Cain
Cain scored nine points in 12 minutes.
He went 3-of-3 from the field and 3-of-4 at the free-throw line.
That is an excellent short-minute scoring contribution.
Tristan da Silva
Da Silva posted:
- 19 minutes
- 5 points
- 2-of-4 field goals
- 1-of-2 three-pointers
- 3 rebounds
- 1 assist
He provided additional spacing and helped Orlando maintain its rotation without relying exclusively on its starters.
Anthony Black
Black played 27 minutes and recorded:
- 7 points
- 2-of-10 shooting
- 3-of-3 free throws
- 5 rebounds
- 3 assists
His shooting efficiency was limited, but the five rebounds and three assists added value during a game where Orlando’s overall team structure was working effectively.
LaMelo Ball Leads Charlotte With 23 Points
LaMelo Ball was Charlotte’s leading scorer with 23 points.
His final line included:
- 25 minutes
- 23 points
- 7-of-17 field goals
- 3-of-8 three-pointers
- 6-of-6 free throws
- 2 rebounds
- 5 assists
- 3 turnovers
His 41.2% field-goal shooting was considerably better than Charlotte’s overall 34% mark.
Ball also made all six of his free throws.
The unusual part of his scoring distribution was when the points came.
According to the Hornets’ official postgame report, Ball scored 21 of his 23 points in the third quarter.
That explains why his final total looks competitive even though Charlotte lost by 31 points.
Ball’s third-quarter scoring helped Charlotte win that period 34-34? No. Orlando also scored 34 in the third, meaning Charlotte’s improved offensive output did not reduce the deficit.
That is an important distinction when evaluating individual scoring in a blowout.
Ball produced a strong scoring quarter, but Orlando already had such a large advantage that the production did not materially change the game’s direction.
Miles Bridges Provides 15 Points
Miles Bridges scored 15 points on 5-of-12 shooting.
His complete line included:
- 28 minutes
- 15 points
- 5-of-12 field goals
- 1-of-6 three-pointers
- 4-of-4 free throws
- 2 rebounds
- 1 assist
- 3 turnovers
Bridges’ 41.7% field-goal percentage was respectable compared with Charlotte’s overall shooting.
However, his one-for-six performance from three limited his perimeter impact.
His four free throws were perfect, showing that he was more effective when creating opportunities inside the arc or drawing contact.
Brandon Miller’s Three-Point Shooting Stands Out
Brandon Miller finished with 14 points.
His line:
- 29 minutes
- 5-of-10 field goals
- 4-of-7 three-pointers
- 3 rebounds
- 1 assist
- 5 turnovers
- 2 steals
Miller’s four made three-pointers were a major part of his scoring.
He shot 57.1% from three, significantly above Charlotte’s overall 26.7% mark.
However, the five turnovers are an important counterpoint.
This is one of the clearest examples of why player evaluation should include both positive and negative possessions.
Miller gave Charlotte valuable perimeter scoring, but his turnovers also represented lost opportunities in a game where Charlotte already struggled to generate efficient offense.
Kon Knueppel Scores 11
Kon Knueppel scored 11 points in 29 minutes.
He shot:
- 3-of-10 from the field
- 1-of-6 from three
- 4-of-5 from the free-throw line
He also recorded three rebounds and one steal.
The free-throw shooting helped his scoring total, but his 30% field-goal percentage and 16.7% three-point percentage illustrate the difficulty Charlotte had creating efficient perimeter offense.
The NBA’s official box score lists Knueppel at -26 for the game.
Charlotte’s Interior Defense Had a Difficult Night
Moussa Diabate contributed eight rebounds and three blocks, making him one of Charlotte’s more active defensive players.
His line included:
- 18 minutes
- 2 points
- 1-of-4 shooting
- 8 rebounds
- 2 assists
- 3 blocks
His defensive statistics show that Charlotte did have individual moments of rim protection.
The problem was that those moments did not translate into enough team stops.
Orlando scored 64 points in the paint compared with 28 for Charlotte. That 36-point difference was one of the clearest indicators of the game.
Team Shooting Comparison
The shooting numbers explain much of the 31-point margin.
| Category | Charlotte | Orlando |
| Field Goals | 28-83 | 42-84 |
| Field Goal % | 34% | 50% |
| 3-Pointers | 12-45 | 8-27 |
| 3PT % | 27% | 30% |
| Free Throws | 22-25 | 29-37 |
| FT % | 88% | 78% |
At first glance, Charlotte’s three-point shooting appears close to Orlando’s percentage.
But three-point shooting was not the deciding factor.
The major difference came from overall field-goal efficiency.
Orlando made 42 of 84 shots. Charlotte made only 28 of 83.
That means Orlando made 14 more field goals despite taking only one additional attempt.
This is the statistical foundation of the result.
Orlando Won the Rebounding Battle
Orlando finished with 49 rebounds compared with Charlotte’s 34.
That is a 15-rebound advantage.
Rebounding matters because it affects both ends of the floor.
Defensive rebounds end possessions. Offensive rebounds create additional opportunities.
Orlando’s size and activity around the basket helped limit Charlotte’s second chances while giving the Magic additional possessions.
Franz Wagner led Orlando with seven rebounds among the key players listed, while Bane also collected seven.
Carter Jr. added six.
For Charlotte, Diabate led the team with eight rebounds.
Ball Movement Was Another Major Difference
Orlando recorded 27 team assists.
Charlotte had 17.
The 10-assist difference reflects a major gap in offensive connectivity.
Orlando’s leading playmakers were productive:
- Banchero: 6 assists
- Wagner: 6 assists
- Suggs: 6 assists
- Bane: 3 steals and seven rebounds while contributing as a scorer
- Bitadze: 2 assists in limited minutes
The Magic therefore had multiple players capable of creating or advancing offense.
Charlotte’s Ball recorded five assists, while the team’s overall assist total remained considerably lower.
In a playoff-pressure environment, the ability to create efficient shots without relying on one primary creator can make a significant difference.
Turnovers and Possession Pressure
Charlotte committed 16 turnovers in the supplied team statistics, compared with 14 for Orlando.
The difference itself was not enormous.
The larger issue was what happened around those turnovers.
The official NBA game summary shows Orlando scoring 26 points off Charlotte turnovers, while Charlotte scored 17 points off Orlando turnovers.
That nine-point advantage from turnover-related scoring added to Orlando’s control.
It also shows why simply counting turnovers does not tell the whole story.
The timing and location of turnovers matter.
A live-ball turnover that creates a transition opportunity can be far more damaging than a dead-ball turnover that allows the defense to set up.
The First Quarter Decided the Tone
Orlando opened the game with a 38-16 first quarter.
That was not merely a good start.
It established a 22-point advantage before Charlotte had time to settle into its offensive rhythm.
Orlando’s early lead grew even further during the second quarter.
The Magic eventually led 68-33 late in the first half.
The NBA’s official game report notes that Orlando built a 35-point maximum lead.
Once the margin reached that level, Charlotte faced an extremely difficult tactical problem.
It needed to increase offensive aggression without giving Orlando additional transition opportunities.
At the same time, Orlando could play with greater freedom because it no longer needed to chase the game.
Why the Final Score Was So Large
A 31-point final margin can sometimes be explained by a single factor, but this game had several.
1. Orlando shot 50%
That is the biggest basic efficiency difference.
2. Charlotte shot 34%
Charlotte missed 55 of its 83 field-goal attempts.
3. Orlando controlled the paint
The Magic scored 64 points in the paint compared with 28 for Charlotte.
4. Orlando won the glass
The Magic finished with 49 rebounds to Charlotte’s 34.
5. Orlando shared the ball
Orlando had 27 assists compared with Charlotte’s 17.
6. Orlando dominated early
A 38-16 opening quarter put Charlotte under immediate pressure.
These factors reinforced one another.
Better shooting helped Orlando build the lead. The lead created more favorable game conditions. Charlotte then had to play from behind, while Orlando could continue attacking a defense that was already under pressure.
Plus/Minus Adds Context to the Player Stats
The supplied data includes notable plus/minus figures for Orlando’s starters:
| Orlando Player | Plus/Minus |
| Desmond Bane | +30 |
| Franz Wagner | +29 |
| Jalen Suggs | +25 |
| Paolo Banchero | +17 |
| Wendell Carter Jr. | +16 |
Bane had the best plus/minus despite shooting only 4-of-14.
That does not mean Bane had a better individual game than every Orlando teammate.
Instead, it shows that Orlando was dramatically successful as a team during his minutes.
This is an important lesson when reading orlando magic vs charlotte hornets match player stats.
Box-score statistics answer different questions.
Points tell you about scoring volume. Shooting percentages tell you about efficiency. Assists show playmaking. Rebounds show possession work. Plus/minus provides information about the team’s scoring margin during a player’s time on the court.
None should be treated as the complete story by itself.
What the Player Statistics Say About Orlando
Orlando’s performance can be summarized as a collective offensive and defensive effort.
Banchero led the scoring.
Wagner combined scoring, rebounding and playmaking.
Carter Jr. delivered exceptional shooting efficiency.
Suggs contributed efficient scoring and six assists.
Bane provided rebounding and defensive activity despite inefficient shooting.
The result was a starting lineup where every player reached double figures.
That balance made it extremely difficult for Charlotte to focus its defense on one scorer.
Orlando also received useful reserve contributions from Bitadze, Cain, da Silva and Black.
The bench did not need to dominate because the starters had already created an enormous advantage.
What the Player Statistics Say About Charlotte
Charlotte’s statistics tell a different story.
Ball was the team’s leading scorer and made seven field goals.
Bridges added 15 points.
Miller made four three-pointers.
Knueppel reached double figures.
Diabate provided eight rebounds and three blocks.
Yet Charlotte’s team shooting remained at 34%.
The biggest issue was not a total absence of individual production. It was the lack of enough efficient production across the full lineup.
Charlotte also struggled to match Orlando’s physicality and interior scoring.
The 49-34 rebounding gap and 64-28 paint scoring gap are particularly revealing.
The Most Important Individual Numbers
If you want to reduce the entire box score to a few statistics, these are among the most useful:
Paolo Banchero: 25 points, 9-of-17 shooting, 6 assists.
Franz Wagner: 18 points, 7 rebounds, 6 assists.
Wendell Carter Jr.: 16 points on 6-of-7 shooting.
Desmond Bane: 13 points, 7 rebounds, 3 steals, +30.
Jalen Suggs: 12 points, 6 assists, 5 rebounds.
LaMelo Ball: 23 points, 5 assists, 7-of-17 shooting.
Miles Bridges: 15 points on 5-of-12 shooting.
Brandon Miller: 14 points and 4-of-7 from three.
Kon Knueppel: 11 points.
These numbers provide a much clearer picture than simply looking at the final score.
Official Box Score Reference
For readers who want to verify individual minutes, shooting numbers, rebounds, assists, steals, blocks, turnovers and plus/minus figures, the official NBA box score is the most direct reference for the game.
Frequently Asked Questions
Who scored the most points in the Orlando Magic vs Charlotte Hornets game?
Paolo Banchero led all players with 25 points for Orlando. LaMelo Ball led Charlotte with 23 points.
What was the final score?
The Orlando Magic defeated the Charlotte Hornets 121-90 in the Eastern Conference Play-In Tournament.
When was the game played?
The official NBA record lists the game as April 17, 2026, at Kia Center in Orlando, Florida.
How did Orlando win by 31 points?
Orlando shot 50% from the field compared with Charlotte’s 34%, outrebounded the Hornets 49-34, recorded 27 assists to Charlotte’s 17, and scored 64 points in the paint.
How many points did LaMelo Ball score?
LaMelo Ball scored 23 points on 7-of-17 shooting, including three three-pointers, and made all six of his free throws. He also recorded five assists.
Who led Orlando in rebounds and assists?
Among the principal Orlando performers, Franz Wagner and Jalen Suggs each recorded six assists, while Wagner and Desmond Bane each had seven rebounds. Wagner finished with 18 points, seven rebounds and six assists.
Conclusion
The orlando magic vs charlotte hornets match player stats show that Orlando’s 121-90 victory was built on far more than Paolo Banchero’s 25 points.
Banchero provided the headline scoring performance, but Orlando’s advantage came from a complete team effort. Wagner added 18 points, seven rebounds and six assists. Carter Jr. scored 16 points on 6-of-7 shooting. Bane contributed 13 points, seven rebounds and three steals. Suggs added 12 points and six assists.
Charlotte had individual production from Ball, Bridges, Miller and Knueppel, but the overall efficiency gap was too large to overcome.
The most revealing numbers were Orlando’s 50% field-goal shooting, 49 rebounds, 27 assists and 64 points in the paint. Charlotte finished at 34% from the field with 34 rebounds and 17 assists.
The game was effectively shaped during the opening half. Orlando scored 38 points in the first quarter and entered halftime ahead 68-37. Charlotte improved its offensive output after halftime, but the deficit was already too large to erase.
For anyone studying the box score, the key takeaway is that individual scoring totals need context. Banchero’s 25 points were important, but the Magic’s balanced scoring, interior efficiency, rebounding, passing and defensive activity explain why the final margin reached 31 points.
The official NBA record also confirms that Orlando advanced to the playoffs as the No. 8 seed, while Charlotte’s season ended with the defeat.