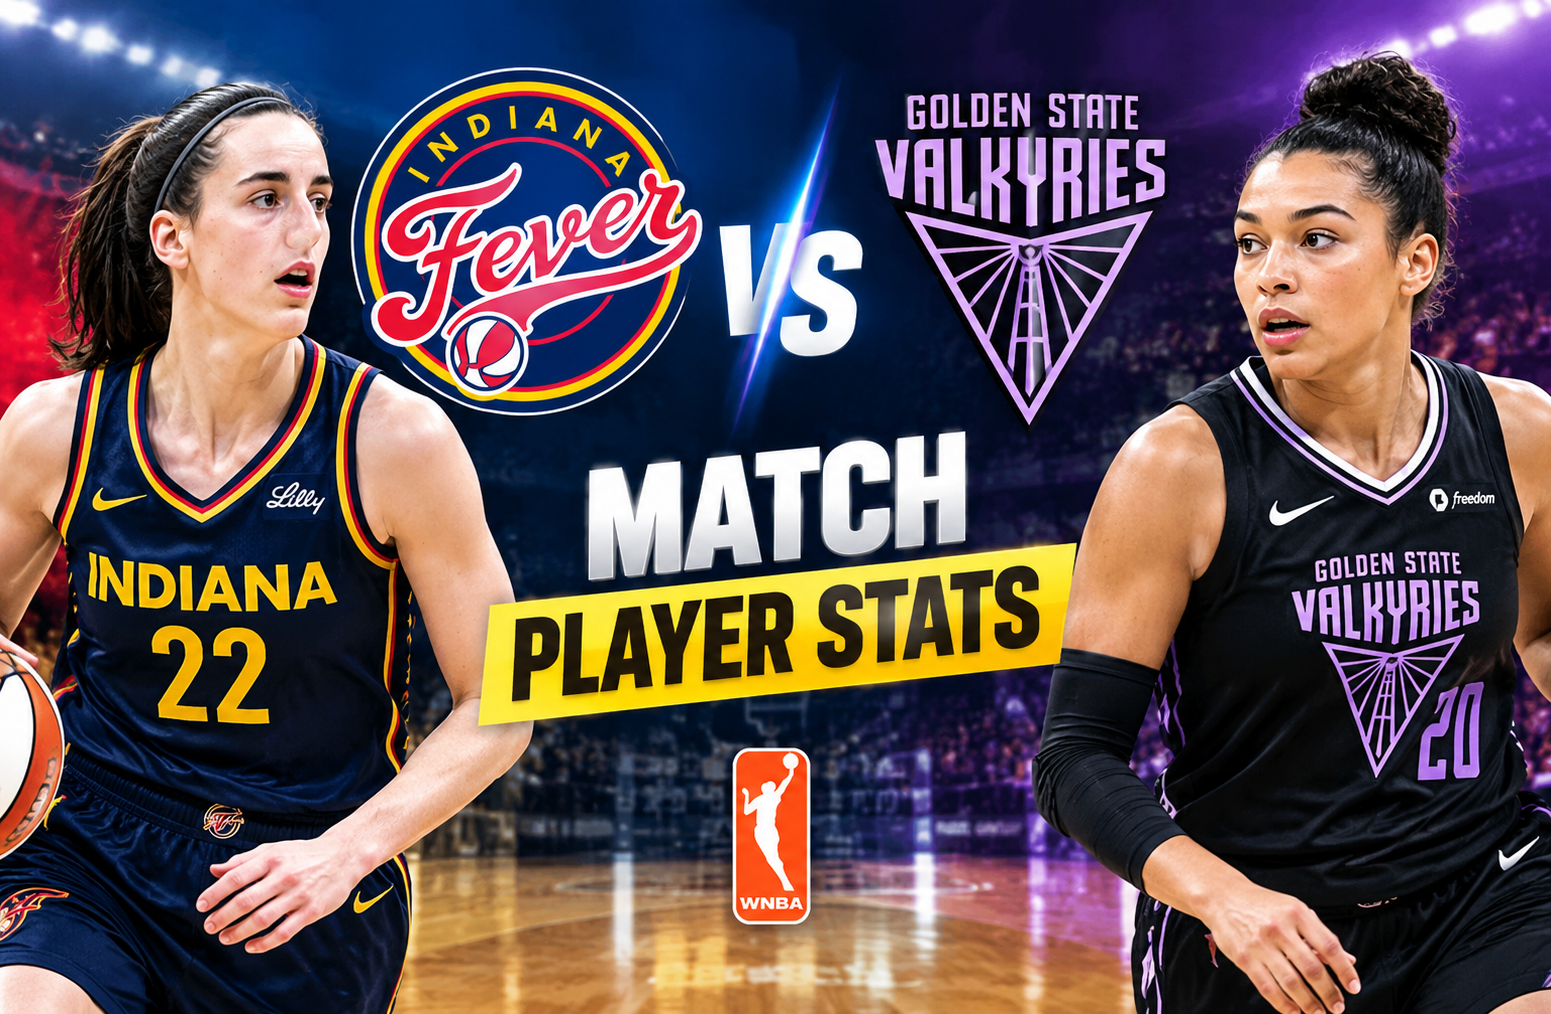
Indiana Fever vs Golden State Valkyries Match Player Stats
The indiana fever vs golden state valkyries match player stats from their 2026 meeting tell a much deeper story than the final 88-75 score. Golden State controlled the game with efficient shooting, balanced scoring, defensive activity, and a strong fourth quarter, while Indiana had productive performances from Kelsey Mitchell and Aliyah Boston but struggled to maintain offensive efficiency.
The game was played at Gainbridge Fieldhouse in Indianapolis and drew 17,014 fans. The matchup finished with Golden State improving to 18-7 and Indiana moving to 14-10.
Indiana Fever vs Golden State Valkyries Match Player Stats: Game Overview
Golden State entered the matchup in excellent form and extended its winning streak to eight games with the 88-75 victory. Indiana stayed competitive for stretches, particularly during the third quarter, but the Valkyries produced the decisive separation in the final period.
The quarter-by-quarter scoring explains why the result became a double-digit victory:
| Quarter | Golden State | Indiana |
| 1st | 20 | 18 |
| 2nd | 20 | 12 |
| 3rd | 18 | 21 |
| 4th | 30 | 24 |
| Final | 88 | 75 |
The most important swing came in the second quarter. Golden State added 20 points while holding Indiana to only 12, creating a 10-point halftime advantage.
Indiana responded in the third quarter, outscoring Golden State 21-18. That reduced some of the deficit, but the Fever could not carry that momentum into the fourth.
Golden State then scored 30 points in the final period.
That fourth-quarter production was particularly important because Indiana had several opportunities to make the game uncomfortable. Instead, Golden State repeatedly answered Indiana’s scoring bursts.
Team Statistics That Decided the Game
Looking at the basic box score provides several immediate explanations for the result.
Field Goal Efficiency
Golden State shot:
- 30-for-58 from the field
- 51.7% overall
- 8-for-24 from three
- 33.3% from three
- 20-for-23 from the free-throw line
- 87.0% from the free-throw line
Indiana shot:
- 27-for-67 from the field
- 40.3% overall
- 9-for-25 from three
- 36.0% from three
- 12-for-16 from the free-throw line
- 75.0% from the free-throw line
Indiana actually had a slightly higher three-point percentage, but that advantage did not compensate for the large difference in overall field-goal efficiency.
The most revealing number is the shot volume. Indiana attempted nine more field goals than Golden State but made three fewer.
That means Golden State got significantly more production from each successful possession involving a field-goal attempt.
Rebounding
Golden State finished with 30 rebounds compared with Indiana’s 26.
The difference was not enormous, but it still favored the Valkyries.
Kayla Thornton led Golden State’s starting group with eight rebounds, while Kiah Stokes added seven. Indiana received seven rebounds from Aliyah Boston and five from both Monique Billings and Makayla Timpson.
The rebounding numbers also show that this was not simply a case of one team dominating the glass.
Instead, Golden State combined a modest rebounding advantage with better shooting efficiency and more disruptive defense.
Assists and Ball Movement
Golden State recorded 16 assists.
Indiana recorded 14.
The two-assist difference looks small, but it fits the larger picture.
Golden State had several players capable of creating useful offensive possessions. Veronica Burton produced four assists, while Kaitlyn Chen and Gabby Williams each had three.
Indiana’s Caitlin Clark led the Fever with six assists.
Clark therefore had a significant role as a playmaker even though her shooting numbers were below her normal offensive standards in this particular game.
Turnovers
Golden State committed 14 turnovers.
Indiana committed 15.
This was not a huge statistical gap, but Golden State also recorded nine steals compared with Indiana’s eight.
The Valkyries therefore created slightly more defensive disruption while giving the ball away slightly less often.
Golden State Valkyries Player Stats
Golden State did not depend on one enormous scoring performance.
Instead, the Valkyries received meaningful contributions from several players.
Gabby Williams
Gabby Williams finished with:
- 16 points
- 6-for-12 shooting
- 2-for-5 from three
- 3 rebounds
- 1 assist
- 3 steals
- 1 block
- 5 turnovers
- +9 plus/minus
Williams was the Valkyries’ leading scorer among the starters.
Her 50% shooting was particularly useful because she provided scoring without requiring an unusually high number of attempts.
The three steals also highlight her defensive impact.
Her five turnovers were a negative, but the overall line still shows how many different ways she affected the game.
Kaitlyn Chen
Kaitlyn Chen produced one of the most efficient offensive performances of the night.
She recorded:
- 14 points
- 5-for-5 from the field
- 4-for-5 from the free-throw line
- 3 assists
- 1 steal
- 1 turnover
- +1 plus/minus
Most importantly, all 14 of her points came in the second half.
Going 5-for-5 from the field is difficult enough in any WNBA game. Doing it while contributing 14 points in limited minutes makes the performance especially notable.
Chen’s contribution also demonstrates why a box score should not be evaluated solely through minutes or starting status.
She played fewer than 10 minutes according to the official box score, yet produced 14 points.
Tiffany Hayes
Tiffany Hayes scored 13 points in 22 minutes.
Her shooting line was:
- 3-for-4 from the field
- 7-for-7 from the free-throw line
- 2 rebounds
- 2 assists
- 3 turnovers
- +11
The perfect free-throw shooting was particularly important.
Hayes also delivered a critical three-point play late in the fourth quarter that helped Golden State maintain control.
Janelle Salaun
Salaun supplied 12 points on 4-for-7 shooting.
She also made two of her four three-point attempts and both of her free throws.
Her final line included two rebounds, two assists, one steal, no turnovers, and a +4 plus/minus.
That is a strong example of efficient secondary scoring.
She did not need a large offensive role to make a meaningful contribution.
Kayla Thornton
Thornton finished with:
- 11 points
- 3-for-8 shooting
- 2-for-5 from three
- 3-for-3 from the free-throw line
- 8 rebounds
- 1 assist
- +21 plus/minus
The +21 was the strongest plus/minus figure among Golden State’s starters.
Her eight rebounds were also important.
Most importantly, Thornton hit a three-pointer during the fourth-quarter run that moved the Valkyries to a 69-56 advantage.
Veronica Burton
Burton scored only four points, but her overall contribution was more substantial than the scoring total suggests.
She recorded:
- 5 rebounds
- 4 assists
- 3 steals
- 3 turnovers
- +12
This is one of the clearest examples of why Indiana Fever vs Golden State Valkyries match player stats should not be reduced to points alone.
Burton’s value came largely through playmaking, rebounding, and defensive activity.
Kiah Stokes
Stokes scored four points and shot 2-for-7.
Her offensive numbers were modest, but she contributed seven rebounds and two blocks.
Two blocks from a center can alter shot selection even when they do not directly translate into points.
Her defensive presence complemented Golden State’s perimeter pressure.
Cecilia Zandalasini
Zandalasini scored 10 points on 4-for-8 shooting.
She made two of her five three-point attempts and also recorded two rebounds and one block.
Her +2 plus/minus was modest, but her 50% shooting gave Golden State another efficient scoring option.
Golden State’s Bench Production
The Valkyries’ bench was a major part of the result.
Their reserve contributors included:
| Player | MIN | PTS | FG | REB | AST | STL | +/− |
| Kaitlyn Chen | 10 | 14 | 5-5 | 0 | 3 | 1 | +1 |
| Tiffany Hayes | 22 | 13 | 3-4 | 2 | 2 | 0 | +11 |
| Janelle Salaun | 22 | 12 | 4-7 | 2 | 2 | 1 | +4 |
| Kaila Charles | 13 | 2 | 1-2 | 1 | 1 | 1 | +4 |
| Laeticia Amihere | 4 | 2 | 1-1 | 0 | 1 | 0 | -3 |
Chen, Hayes, and Salaun combined for 39 points.
That secondary scoring was one of the clearest differences between the teams.
Indiana Fever Player Stats
Indiana had several strong individual performances despite losing the game.
Kelsey Mitchell
Kelsey Mitchell led Indiana with 20 points.
Her complete line included:
- 35 minutes
- 7-for-16 shooting
- 3-for-5 from three
- 3-for-3 from the free-throw line
- 1 rebound
- 4 assists
- 2 turnovers
- 1 steal
- -5 plus/minus
Mitchell was Indiana’s most productive scorer and one of the team’s most reliable perimeter threats.
She shot 43.8% overall and 60% from three.
Her five three-point attempts were also efficient.
She also hit a late three-pointer that reduced Golden State’s advantage to 80-73.
However, Indiana turned the ball over on its next possession, and Golden State responded with two free throws.
That sequence illustrates how individual scoring can be outweighed by possession management during a close stretch.
Aliyah Boston
Boston recorded:
- 15 points
- 6-for-11 shooting
- 2-for-3 from three
- 7 rebounds
- 1 assist
- 2 steals
- 3 turnovers
- +1 plus/minus
Her 54.5% field-goal shooting was one of Indiana’s better offensive performances.
Boston was also effective from long range, making two of three three-point attempts.
Her seven rebounds gave Indiana another reliable interior contribution.
Unlike several Fever players, Boston finished with a positive plus/minus.
Caitlin Clark
Caitlin Clark finished with:
- 13 points
- 4-for-14 shooting
- 1-for-8 from three
- 4-for-5 from the free-throw line
- 3 rebounds
- 6 assists
- 4 turnovers
- 1 steal
- 1 block
- -8 plus/minus
Clark’s six assists were the most among Indiana players.
Her scoring efficiency, however, was limited.
She shot 28.6% from the field and 12.5% from three.
The important analytical point is that Clark’s offensive contribution was not completely absent.
Her six assists demonstrate that she still created opportunities for teammates.
The challenge was that her own shot-making did not provide the scoring efficiency Indiana needed against Golden State’s defense.
Sophie Cunningham
Cunningham played 27 minutes and scored 10 points.
She shot 3-for-7 overall and 2-for-4 from three.
Her defensive activity stood out even more than her scoring.
She recorded four steals, the highest total on the Indiana roster.
That defensive production helped Indiana create extra opportunities, although the Fever could not convert enough of those opportunities into a comeback.
Makayla Timpson
Timpson provided six points on 3-for-4 shooting.
She also collected five rebounds.
Her field-goal efficiency was excellent, although she did not have a large offensive role.
Her -14 plus/minus was the lowest among Indiana players with meaningful minutes.
Tyasha Harris
Harris finished with:
- 5 points
- 2-for-5 shooting
- 1-for-4 from three
- 2 rebounds
- 1 assist
- 2 turnovers
- -11 plus/minus
She provided some secondary ball-handling and perimeter scoring but could not match the efficiency Golden State received from its bench.
Monique Billings
Billings contributed four points and five rebounds.
She also added two assists.
Her 1-for-5 shooting limited her scoring impact, but her rebounding helped Indiana compete physically.
Lexie Hull
Hull finished with only two points on 1-for-4 shooting.
She also recorded one rebound and one block.
Her -9 plus/minus reflected Indiana’s difficulty winning the minutes she played.
Comparing the Main Player Performances
The most useful way to interpret indiana fever vs golden state valkyries match player stats is to compare production across several categories rather than simply looking at the leading scorers.
| Category | Golden State | Indiana |
| Leading scorer | Gabby Williams, 16 | Kelsey Mitchell, 20 |
| Second scorer | Kaitlyn Chen, 14 | Aliyah Boston, 15 |
| Third scorer | Tiffany Hayes, 13 | Caitlin Clark, 13 |
| Team FG% | 51.7% | 40.3% |
| 3PT% | 33.3% | 36.0% |
| FT% | 87.0% | 75.0% |
| Rebounds | 30 | 26 |
| Assists | 16 | 14 |
| Steals | 9 | 8 |
| Blocks | 4 | 2 |
| Turnovers | 14 | 15 |
Indiana had the higher three-point percentage.
That statistic alone might suggest the Fever had an outside shooting advantage.
But Golden State’s overall shooting was much more efficient.
This is why a single shooting percentage can sometimes be misleading when evaluating a game.
The Importance of Shot Selection
Golden State made 30 of 58 field-goal attempts.
Indiana made 27 of 67.
That difference means Indiana attempted considerably more shots but converted at a much lower rate.
One useful derived measure is effective field-goal percentage, which accounts for the extra value of three-point baskets.
The game data lists Golden State at 58.6% effective field-goal percentage and Indiana at 47.0%.
That 11.6 percentage-point gap is significant.
It helps explain how Golden State could win comfortably despite Indiana making one more three-pointer.
Golden State did not simply shoot more efficiently from outside.
It also converted a much larger percentage of its total field-goal opportunities.
Free Throws Added Another Advantage
The free-throw difference was also meaningful.
Golden State made 20 free throws.
Indiana made 12.
That is an eight-point difference at the foul line.
Golden State also converted 87% of its free throws.
Indiana converted 75%.
The difference was not just the number of attempts.
It was also execution.
Hayes went 7-for-7.
Thornton went 3-for-3.
Burton went 2-for-2.
Chen went 4-for-5.
Those contributions helped Golden State turn trips to the line into reliable points.
Fourth Quarter Analysis
The fourth quarter deserves special attention because it transformed a competitive game into an 88-75 victory.
Golden State scored 30 points in the final period.
Indiana scored 24.
The Valkyries entered the quarter with a seven-point advantage after leading 58-51 through three quarters.
They then produced the stronger offensive stretch.
Thornton’s three-pointer helped establish a 69-56 lead after the 11-5 opening run.
Indiana did respond.
Mitchell’s three-pointer brought the Fever within 80-73.
But Indiana could not sustain the comeback.
The next possession ended in a turnover, followed by Golden State free throws.
That sequence effectively removed much of the pressure from the Valkyries.
What the Plus/Minus Numbers Reveal
Plus/minus is useful when treated carefully.
Golden State’s notable numbers included:
- Kayla Thornton: +21
- Veronica Burton: +12
- Tiffany Hayes: +11
- Gabby Williams: +9
- Kiah Stokes: +4
- Janelle Salaun: +4
Indiana’s notable numbers included:
- Aliyah Boston: +1
- Kelsey Mitchell: -5
- Caitlin Clark: -8
- Lexie Hull: -9
- Tyasha Harris: -11
- Monique Billings: -11
- Makayla Timpson: -14
Thornton’s +21 stands out because she combined the team’s highest plus/minus with eight rebounds and 11 points.
However, plus/minus should not be used alone to determine who played well.
Lineups, opponent combinations, timing, and team shooting all influence the statistic.
Defensive Impact
Golden State recorded nine steals and four blocks.
Indiana recorded eight steals and two blocks.
The difference in steals was small, but the blocks were more clearly in Golden State’s favor.
Stokes had two blocks.
Williams added one.
Zandalasini added another.
Indiana received one block each from Clark and Hull.
The Valkyries also produced 15 points off their biggest lead, while Indiana’s biggest lead was only one point according to the game summary.
That is another useful indicator of game control.
Why Caitlin Clark’s Six Assists Matter
It would be easy to look at Clark’s 13 points and focus entirely on her 4-for-14 shooting.
A better analysis includes her six assists.
Clark’s role was not limited to scoring.
She remained Indiana’s primary creator and generated opportunities for teammates.
However, four turnovers also mattered.
Against a defense that produced nine steals, additional possessions were valuable.
So Clark’s statistical profile was mixed:
- Strong playmaking
- Limited shooting efficiency
- Six assists
- Four turnovers
- One steal
- One block
That combination explains why her overall impact cannot be summarized simply by her point total.
Why Kelsey Mitchell Was Indiana’s Leading Scorer
Mitchell’s 20 points came on 7-for-16 shooting.
Her three-point shooting was particularly efficient at 3-for-5.
She also made all three free throws she attempted.
Her offensive efficiency gave Indiana an important scoring source.
But Golden State was able to generate more scoring across the roster.
That is the central contrast.
Indiana had a 20-point scorer.
Golden State had five players reach double figures.
That balance made it more difficult for Indiana to contain the Valkyries over 40 minutes.
Golden State’s Balanced Scoring Model
Golden State’s double-digit scorers were:
- Gabby Williams: 16
- Kaitlyn Chen: 14
- Tiffany Hayes: 13
- Janelle Salaun: 12
- Kayla Thornton: 11
- Cecilia Zandalasini: 10
That is six players in double figures.
Indiana had:
- Kelsey Mitchell: 20
- Aliyah Boston: 15
- Caitlin Clark: 13
- Sophie Cunningham: 10
That is four players in double figures.
This difference is important when studying the complete indiana fever vs golden state valkyries match player stats.
Golden State’s scoring was distributed across more players.
Indiana relied more heavily on its leading offensive options.
A Closer Look at the Team Four Factors
Four-factor statistics provide another way to understand the matchup.
The game data lists:
- Golden State eFG%: 58.6%
- Indiana eFG%: 47.0%
- Golden State turnover rate: 17.0%
- Indiana turnover rate: 16.8%
- Golden State offensive rebound rate: 27.3%
- Indiana offensive rebound rate: 29.4%
- Golden State free-throw rate: .345
- Indiana free-throw rate: .179
These numbers reveal something important.
Indiana actually had the better offensive rebounding rate and a slightly lower turnover rate.
Yet Golden State still won comfortably.
The major difference was shooting efficiency and free-throw generation.
That is a strong example of why basketball analysis should consider multiple statistical dimensions instead of relying on one category.
Season Series Context
The July meeting was part of a three-game 2026 season series.
The three games were:
- May 22, 2026: Indiana 90, Golden State 82
- May 28, 2026: Golden State 90, Indiana 88
- July 15, 2026: Golden State 88, Indiana 75
That means Golden State won the season series 2-1.
The three games also demonstrate that these teams had already produced different types of matchups during the season.
The first meeting was an Indiana victory.
The second was a narrow Golden State victory.
The third became a more decisive Golden State win.
Attendance and Game Environment
The game attracted 17,014 fans at Gainbridge Fieldhouse.
That large crowd provided the setting for an important regular-season matchup involving two teams that had already established a competitive season series.
For readers researching player statistics, attendance may seem unrelated to the box score.
It is not directly predictive of individual performance, but it provides useful context about the environment in which the game took place.
What the Box Score Does Not Tell You
A traditional box score has limits.
For example, it tells us that Clark had six assists.
It does not fully explain the quality of every pass or the defensive pressure she faced before creating those opportunities.
Similarly, a player can record zero blocks while still altering shots through positioning.
That is why advanced analysis should use the box score as a foundation rather than the entire story.
For this game, the strongest statistical themes are clear:
- Golden State shot much better overall.
- Indiana attempted more field goals.
- Golden State made eight more free throws.
- Golden State had six players score at least 10 points.
- Indiana had four players reach double figures.
- Golden State produced more steals and blocks.
- Indiana briefly recovered during the third quarter.
- Golden State controlled the fourth quarter.
How to Read These Match Player Stats Correctly
If you are researching this game for fantasy analysis, historical research, betting research, or team performance analysis, it helps to separate individual production into categories.
Scoring
Start with points, field-goal attempts, three-point attempts, and free throws.
This shows who carried the scoring load and how efficiently they did it.
Playmaking
Look at assists alongside turnovers.
Clark’s six assists are more meaningful when considered together with her four turnovers.
Burton’s four assists and three steals show a different form of contribution.
Defense
Steals and blocks provide measurable defensive events.
They should be combined with minutes and team context when interpreting defensive performance.
Efficiency
Field-goal percentage and effective field-goal percentage provide a clearer view of shooting performance than points alone.
Overall Team Impact
Plus/minus can provide additional context, but it should never replace the rest of the box score.
Frequently Asked Questions
Who won the Indiana Fever vs Golden State Valkyries game?
The Golden State Valkyries defeated the Indiana Fever 88-75 in the 2026 matchup at Gainbridge Fieldhouse.
Who led the Indiana Fever in scoring?
Kelsey Mitchell led Indiana with 20 points on 7-for-16 shooting. She also made three of five three-point attempts.
Who led the Golden State Valkyries in scoring?
Gabby Williams led Golden State with 16 points. She shot 6-for-12 from the field and made two three-pointers.
How did Caitlin Clark perform against the Valkyries?
Clark scored 13 points, recorded six assists, three rebounds, one steal, and one block. She shot 4-for-14 from the field and 1-for-8 from three-point range.
Which team shot better?
Golden State shot 51.7% from the field compared with Indiana’s 40.3%. Indiana had the slightly better three-point percentage at 36.0%, compared with 33.3% for Golden State.
How many players scored in double figures?
Golden State had six players score at least 10 points. Indiana had four players reach double figures.
Conclusion
The indiana fever vs golden state valkyries match player stats show that Golden State’s 88-75 victory was built on balanced scoring, efficient shooting, defensive activity, and strong fourth-quarter execution.
Gabby Williams led the Valkyries with 16 points, while Kaitlyn Chen delivered 14 points on a perfect 5-for-5 from the field. Tiffany Hayes and Janelle Salaun added 13 and 12 points respectively, while Kayla Thornton contributed 11 points and eight rebounds.
Indiana’s best scoring performance came from Kelsey Mitchell, who produced 20 points. Aliyah Boston added 15 points and seven rebounds, while Caitlin Clark contributed 13 points and six assists.
The biggest statistical difference was overall shooting efficiency. Golden State converted 51.7% of its field-goal attempts, compared with 40.3% for Indiana. The Valkyries also made 20 free throws compared with 12 for the Fever.
Indiana did several things well, including three-point shooting and offensive rebounding, but Golden State’s ability to generate efficient scoring from multiple players proved decisive.
The fourth quarter ultimately defined the contest. After Indiana reduced the deficit during the third quarter, Golden State responded with 30 fourth-quarter points and closed the game with a 13-point victory.
For anyone studying the indiana fever vs golden state valkyries match player stats, the main lesson is that the final score becomes much easier to understand when individual numbers are connected to team efficiency, possession quality, free-throw production, and fourth-quarter execution.