Timberwolves vs Cleveland Cavaliers Match Player Stats
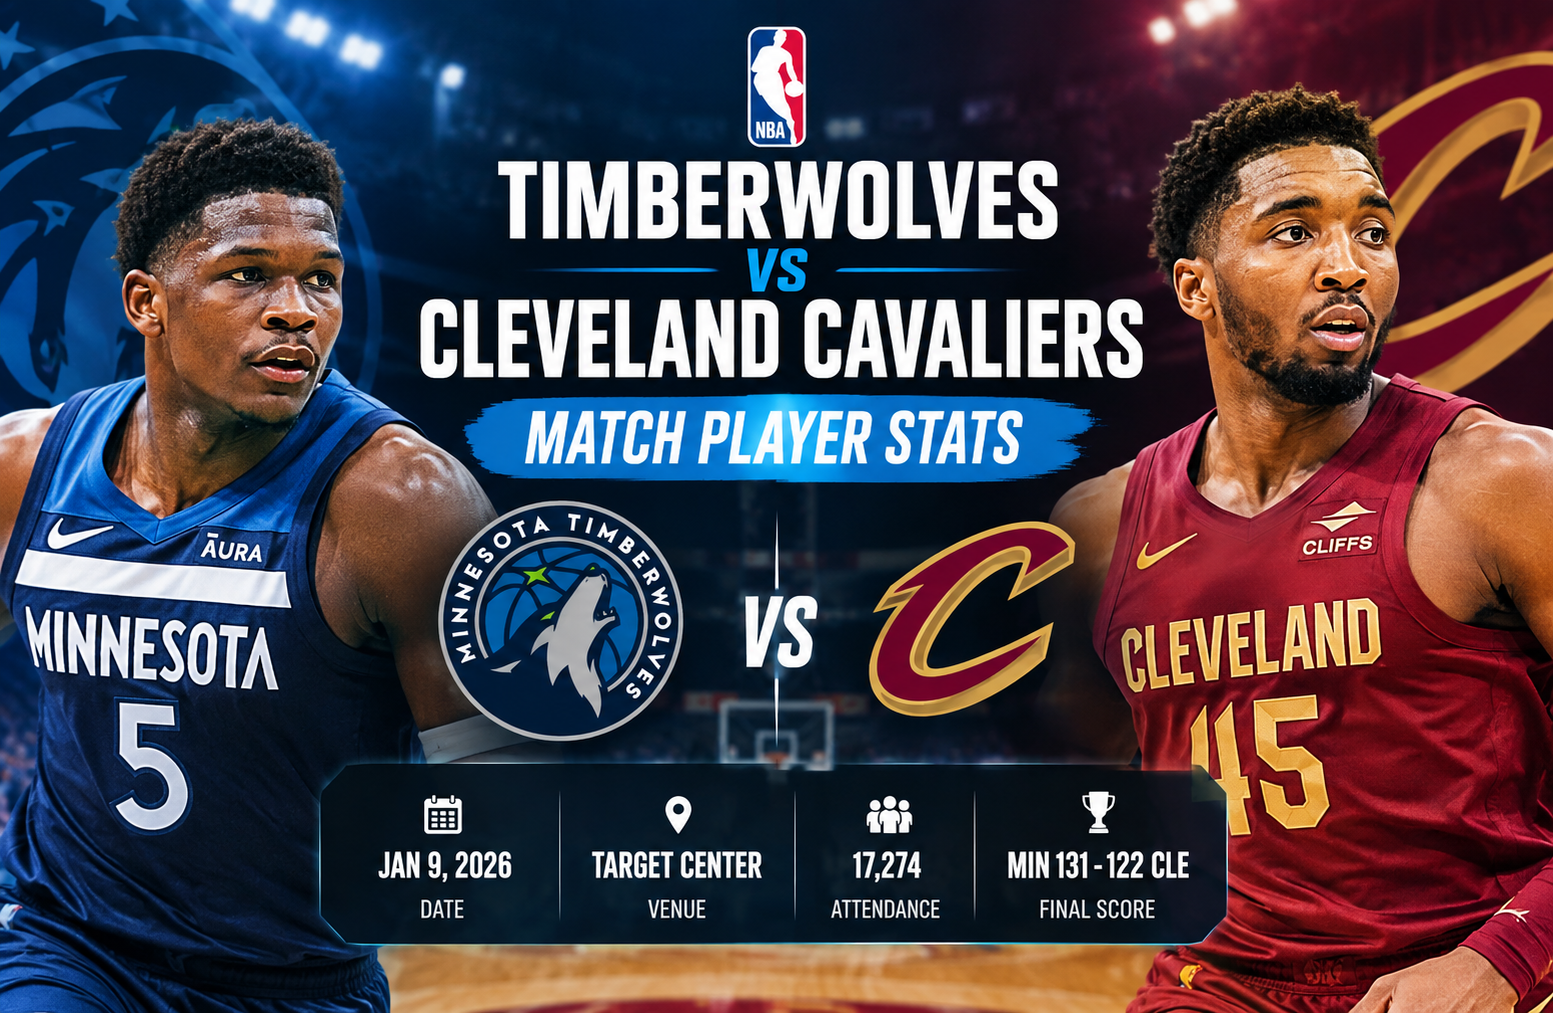
The timberwolves vs cleveland cavaliers match player stats from this matchup tell a much deeper story than the final score alone. Minnesota defeated Cleveland 131-122 at Target Center, with Julius Randle leading the Timberwolves with 28 points, Jaden McDaniels adding 26, Anthony Edwards producing 25 points and 9 assists, and Donte DiVincenzo knocking down six three-pointers. Cleveland received 30 points, 7 rebounds, and 8 assists from Donovan Mitchell, but Minnesota’s combination of shooting efficiency, rebounding, and balanced scoring proved decisive.
The game was played at Target Center in Minneapolis and featured two teams with very different statistical strengths. Cleveland finished with 48 made field goals on 91 attempts, while Minnesota converted 51 of 89. The biggest separation came from beyond the arc. Minnesota made 20 of 38 three-point attempts, compared with Cleveland’s 11 of 33.
There is also an important date detail worth clarifying. The supplied data identifies the matchup as January 9, 2026, while the official NBA game listing records it as January 8, 2026 in Minneapolis. That difference comes from date and timezone presentation, with the game taking place on the evening of January 8 in the United States and appearing as January 9 in some international time zones.
Timberwolves vs Cleveland Cavaliers Match Player Stats at a Glance
Minnesota entered the contest with a 25-13 record and a 14-6 home mark. Cleveland came in at 21-18 overall and 8-9 on the road.
The final score was:
Minnesota Timberwolves 131, Cleveland Cavaliers 122
The official NBA record confirms Minnesota’s nine-point victory and the team’s 25-13 record following the game.
Game Information
| Category | Cleveland Cavaliers | Minnesota Timberwolves |
| Final Score | 122 | 131 |
| Record after game | 21-18 | 25-13 |
| Home/Away Record | 8-9 Away | 14-6 Home |
| Field Goals | 48-91 | 51-89 |
| Field Goal % | 53% | 57% |
| Three-Pointers | 11-33 | 20-38 |
| Three-Point % | 33% | 53% |
| Free Throws | 15-21 | 9-17 |
| Free Throw % | 71% | 53% |
| Rebounds | 38 | 45 |
| Assists | 31 | 33 |
| Turnovers | 12 | 17 |
| Steals | 9 | 8 |
| Blocks | 2 | 2 |
The official NBA box score supports the major team-level shooting figures, including Minnesota’s 51-for-89 shooting and 20-for-38 performance from three-point range, as well as Cleveland’s 48-for-91 shooting and 11-for-33 three-point mark.
For readers who want to verify the complete box score, player minutes, shooting splits, and game details, the official NBA box score provides the primary game record.
How Minnesota Won the Game
A nine-point final margin can make a game appear relatively straightforward, but this contest was more competitive than the final score suggests.
Cleveland actually scored 31 points in the opening quarter and 36 in the second. Minnesota led 32-31 after one period but trailed 67-63 at halftime.
The decisive stretch came in the third quarter.
Minnesota exploded for 43 points in the third period while Cleveland managed 22. That 21-point swing completely changed the game. The Timberwolves entered the fourth quarter with a 106-89 advantage and then absorbed a Cleveland scoring push without surrendering the lead.
That third-quarter performance is one of the most important details when examining the timberwolves vs cleveland cavaliers match player stats.
Minnesota did not simply win because one player had a huge scoring night. The team created separation through several complementary performances.
Julius Randle provided the highest scoring total for Minnesota with 28 points.
Jaden McDaniels followed with 26 points while shooting 11-for-14 from the field.
Anthony Edwards scored 25 points and added 9 assists.
Donte DiVincenzo scored 22 points and made 6 of 10 three-point attempts.
Rudy Gobert added 11 points and 13 rebounds while making all five of his field-goal attempts.
That balance made it difficult for Cleveland to focus its defensive attention on a single Minnesota scorer.
Julius Randle Leads Minnesota With 28 Points
Julius Randle delivered one of the most complete offensive games for Minnesota.
His final line was:
28 points, 11 rebounds, 8 assists, 10-for-21 FG, 3-for-7 3PT, 5-for-6 FT
The obvious headline is the 28-point total, but his passing and rebounding were just as important.
Randle finished only two assists short of a triple-double. His 11 rebounds also gave Minnesota another strong presence on the glass, especially when combined with Rudy Gobert’s 13 rebounds.
His three-point shooting also mattered. Randle made 3 of 7 attempts from deep, forcing Cleveland to account for him outside the paint rather than treating him strictly as an interior scorer.
The 10-for-21 shooting line translates to roughly 47.6 percent from the field. It was not simply a volume scoring performance. Randle contributed in multiple areas and helped connect Minnesota’s half-court offense.
That versatility is especially useful when playing against a Cleveland lineup built around talented interior defenders and strong offensive creators.
Jaden McDaniels Was Extremely Efficient
Jaden McDaniels produced one of the most efficient scoring performances of the night.
His line:
26 points, 5 rebounds, 1 assist, 11-for-14 FG, 3-for-4 3PT, 1-for-4 FT
McDaniels attempted only 14 field goals but made 11.
That means he converted approximately 78.6 percent of his field-goal attempts.
His three-point shooting was also excellent. He made 3 of 4 from outside, giving him another way to punish defensive rotations.
McDaniels’ performance illustrates why raw points alone do not tell the whole story.
A 26-point performance on 14 field-goal attempts represents much different offensive efficiency than a 26-point game requiring 25 or 26 attempts.
His ability to score efficiently without dominating possessions allowed Minnesota’s other creators to remain involved.
Anthony Edwards Controlled the Offensive Flow
Anthony Edwards finished with:
25 points, 7 rebounds, 9 assists, 10-for-20 FG, 4-for-7 3PT, 1 block
The 9 assists stand out.
Edwards was not simply Minnesota’s perimeter scorer. He was also the team’s primary creator in important stretches.
His 4-for-7 performance from three-point range helped Minnesota maintain spacing, while his 10-for-20 shooting showed that he was efficient across the field.
The nine assists also fit the broader pattern of Minnesota’s balanced offense. Instead of forcing every possession into an individual scoring opportunity, Edwards consistently created opportunities for teammates.
There was an additional milestone attached to his performance. Edwards reached 10,000 career points during the game, becoming the third-youngest player in NBA history to reach that mark according to NBA reporting.
That milestone arrived during the fourth quarter, but the larger basketball story was his overall contribution to the win.
Donte DiVincenzo Provided the Three-Point Spark
Donte DiVincenzo scored 22 points and was one of Minnesota’s most dangerous perimeter shooters.
His line:
22 points, 1 rebound, 4 assists, 8-for-13 FG, 6-for-10 3PT, 1 steal
Six made three-pointers are a major factor in a game where Minnesota made 20 threes overall.
DiVincenzo alone accounted for 30 percent of Minnesota’s made three-pointers.
His 6-for-10 shooting from deep also meant Cleveland could not afford to leave him open when helping against Minnesota’s primary creators.
This is an important tactical element in understanding the matchup.
When Edwards, Randle, and other players attract defensive attention, a shooter like DiVincenzo can turn a small defensive mistake into three points.
Rudy Gobert Dominated the Glass
Rudy Gobert finished with:
11 points, 13 rebounds, 3 assists, 5-for-5 FG, 1-for-3 FT
His 13 rebounds led Minnesota.
More importantly, his presence contributed to Minnesota’s 45-38 advantage on the glass.
The seven-rebound difference is not overwhelming by itself, but it helped Minnesota generate additional possessions and limit Cleveland’s opportunities to extend possessions through offensive rebounds.
Gobert was also perfect from the field, making all five of his attempts.
His scoring total was modest compared with Randle, McDaniels, or Edwards, but his efficiency and rebounding provided a different type of value.
Naz Reid Added Spacing and Frontcourt Depth
Naz Reid recorded:
9 points, 6 rebounds, 3 assists, 3-for-6 FG, 2-for-4 3PT, 1 block
His scoring contribution was smaller, but his perimeter shooting mattered.
Reid’s ability to make two three-pointers gave Minnesota another frontcourt player capable of stretching the defense.
That matters because Minnesota’s lineup could combine interior size with perimeter shooting instead of having every big player operate close to the basket.
Donovan Mitchell Led Cleveland’s Scoring
Donovan Mitchell was Cleveland’s leading scorer with:
30 points, 7 rebounds, 8 assists, 10-for-20 FG, 2-for-8 3PT, 8-for-9 FT
He was also Cleveland’s primary offensive engine.
Mitchell scored 30 points while shooting exactly 50 percent from the field.
His 8 assists show that he was also creating opportunities for teammates.
The free-throw line was another important part of his performance. Mitchell made 8 of 9 free throws, giving Cleveland efficient scoring opportunities even though his three-point shooting was only 2-for-8.
The official NBA game record lists Mitchell as Cleveland’s scoring and assist leader, with 30 points and 8 assists, while Jarrett Allen led the team with 10 rebounds.
The challenge for Cleveland was that Mitchell’s production was not enough to offset Minnesota’s broader scoring distribution.
Evan Mobley Delivered Efficient Interior Scoring
Evan Mobley finished with:
19 points, 4 rebounds, 3 assists, 8-for-11 FG, 3-for-5 3PT
His 8-for-11 shooting was one of Cleveland’s most efficient individual performances.
Mobley also made 3 of 5 three-point attempts, which is particularly valuable for a player who can contribute around the basket.
His performance gave Cleveland an efficient second scoring option alongside Mitchell.
The problem was not necessarily a lack of efficiency from Mobley. Rather, Minnesota generated more total offensive production from multiple players at the same time.
Darius Garland Created Opportunities
Darius Garland posted:
16 points, 1 rebound, 8 assists, 7-for-16 FG, 1-for-4 3PT
His eight assists matched Mitchell’s eight assists.
That gave Cleveland two primary creators capable of producing shots for teammates.
However, Cleveland’s offensive structure still had difficulty keeping pace with Minnesota during the third quarter.
Garland’s passing was important, but Minnesota’s defensive and offensive execution after halftime created too large a gap to erase comfortably.
Jaylon Tyson Added 22 Points
Jaylon Tyson scored:
22 points, 2 rebounds, 3 assists, 7-for-13 FG, 5-for-11 3PT
His five made three-pointers were a significant part of Cleveland’s perimeter production.
Tyson’s 22 points also helped Cleveland maintain offensive pressure throughout the game.
His shooting becomes even more notable when viewed alongside Mitchell’s 30 and Mobley’s 19. Cleveland had multiple players scoring efficiently enough to stay competitive.
The larger issue was Minnesota’s superior three-point output and third-quarter explosion.
De’Andre Hunter’s Balanced Contribution
De’Andre Hunter finished with:
14 points, 7 rebounds, 4 assists, 6-for-11 FG
Hunter did not lead Cleveland in scoring, but his 7 rebounds and 4 assists gave him a well-rounded statistical profile.
His 6-for-11 shooting also provided efficient offense.
This is another example of why the full box score is more useful than focusing only on the top scorer.
Team Shooting Explains Much of the Result
The clearest statistical difference between the teams was three-point shooting.
Cleveland:
11-for-33 from three, 33.3 percent
Minnesota:
20-for-38 from three, 52.6 percent
Minnesota therefore made nine more three-pointers.
At three points per make, those additional nine makes represent 27 points of extra scoring from long range before considering all other differences.
Cleveland actually had the advantage at the free-throw line.
The Cavaliers made 15 of 21 free throws.
Minnesota made only 9 of 17.
That gave Cleveland six more made free throws.
However, the difference in three-point production was much larger.
Minnesota also shot better overall from the field:
57.3 percent compared with Cleveland’s 52.7 percent.
The combination of better overall shooting and dramatically better three-point shooting created the statistical foundation for the win.
The Third Quarter Was the Turning Point
The quarter-by-quarter scoring deserves special attention.
| Quarter | Cleveland | Minnesota |
| First | 31 | 32 |
| Second | 36 | 31 |
| Third | 22 | 43 |
| Fourth | 33 | 25 |
| Total | 122 | 131 |
At halftime, Cleveland led 67-63.
Minnesota then outscored Cleveland 43-22 in the third.
That transformed a four-point halftime deficit into a 17-point lead entering the fourth quarter.
Cleveland responded with 33 points in the final period, while Minnesota scored 25.
That comeback attempt mattered, but the third-quarter deficit had already created too much separation.
This is perhaps the most important lesson from the box score: the game was not decided by Minnesota being slightly better in every quarter. It was decided by a dramatic third-quarter advantage.
Rebounding Gave Minnesota Extra Possession Value
Minnesota finished with 45 rebounds compared with Cleveland’s 38.
That seven-rebound advantage supported the Timberwolves’ offensive efficiency.
Rudy Gobert led Minnesota with 13 rebounds, while Julius Randle contributed 11.
For Cleveland, Jarrett Allen led the team with 10 rebounds.
Rebounding is especially important in a matchup featuring several high-level scorers.
A missed shot becomes a potential second possession if the offensive team retrieves it. Conversely, a strong defensive rebound ends the possession and allows the defense to transition into offense.
Minnesota’s overall rebounding advantage therefore complemented its superior shooting.
Assists Showed Balanced Creation
Cleveland recorded 31 assists.
Minnesota recorded 33.
The difference was not huge, but the individual distribution is revealing.
Minnesota received 9 assists from Anthony Edwards, 8 from Julius Randle, 4 from Donte DiVincenzo, and 3 each from Rudy Gobert and Naz Reid.
Cleveland received 8 assists each from Donovan Mitchell and Darius Garland, followed by 4 from De’Andre Hunter and 3 from Evan Mobley and Jaylon Tyson.
Both teams had strong playmaking contributions.
The difference was that Minnesota paired its ball movement with more effective shooting.
Turnovers Were a Relative Weakness for Minnesota
One unusual feature of the game was that Minnesota committed more turnovers.
Cleveland had 12 turnovers.
Minnesota had 17.
Cleveland also recorded one more steal, with 9 compared with Minnesota’s 8.
That means Minnesota did not win the turnover battle.
Instead, the Timberwolves compensated with better shooting, more rebounds, and significantly greater three-point production.
This is useful when analyzing the game because it prevents an overly simple explanation.
Minnesota did not win because everything went perfectly.
The team gave Cleveland extra opportunities through turnovers but still built enough offensive separation to control the result.
A Closer Look at Scoring Efficiency
One useful way to read the timberwolves vs cleveland cavaliers match player stats is to compare production with shot volume.
Jaden McDaniels scored 26 points on 14 field-goal attempts.
Anthony Edwards scored 25 on 20 attempts.
Julius Randle scored 28 on 21 attempts.
Donte DiVincenzo scored 22 on 13 attempts.
For Cleveland:
Donovan Mitchell scored 30 on 20 attempts.
Evan Mobley scored 19 on 11 attempts.
Darius Garland scored 16 on 16 attempts.
Jaylon Tyson scored 22 on 13 attempts.
The important observation is that both teams had players producing efficiently.
The difference was how many efficient contributors each team had simultaneously.
Minnesota had four players at 22 or more points.
Cleveland had three players at 19 or more, plus Tyson’s 22.
That distribution helped Minnesota maintain offensive pressure even when one player was not the primary scorer.
What the Shooting Numbers Say About Each Team
The team shooting profile can be broken into three layers.
Overall field-goal shooting
Minnesota made 51 of 89 attempts.
Cleveland made 48 of 91.
The difference was only three made field goals.
Three-point shooting
Minnesota made 20 of 38.
Cleveland made 11 of 33.
This was the largest shooting gap.
Free throws
Cleveland made 15 of 21.
Minnesota made 9 of 17.
Cleveland therefore had an advantage at the line.
Taken together, the statistics show that Minnesota’s victory was primarily driven by field-goal efficiency and three-point volume rather than free-throw production.
Why Donte DiVincenzo’s Six Threes Matter
It is easy to look at Edwards’ 25 points or Randle’s 28 and conclude that the stars carried the Timberwolves.
That would miss an important part of the game.
DiVincenzo’s 6-for-10 performance from three was one of the key spacing performances.
Every made three changes how a defense can position itself.
When a shooter is hitting at that rate, defenders must close out aggressively. That can create driving lanes, passing windows, and opportunities for offensive rebounds.
DiVincenzo’s shooting therefore had value beyond his 22 points.
Why Cleveland’s 122 Points Were Not Enough
Scoring 122 points is normally enough to produce a highly competitive NBA game.
Cleveland’s offense was not poor in this matchup.
The Cavaliers shot 52.7 percent from the field, made 11 threes, scored 15 free throws, and received 30 points from Mitchell.
Yet Minnesota scored 131.
The nine-point difference was created by efficiency and volume in several areas.
Minnesota made:
- 3 more field goals
- 9 more three-pointers
- 7 more total rebounds
- 2 more assists
Cleveland made:
- 6 more free throws
- 5 fewer turnovers
The statistical profile therefore shows a tradeoff. Cleveland protected the ball better and earned more free throws, while Minnesota produced more efficient perimeter offense and controlled the glass.
Player Stats Table: Minnesota Timberwolves
| Player | PTS | REB | AST | FG | 3PT | FT |
| Julius Randle | 28 | 11 | 8 | 10-21 | 3-7 | 5-6 |
| Jaden McDaniels | 26 | 5 | 1 | 11-14 | 3-4 | 1-4 |
| Anthony Edwards | 25 | 7 | 9 | 10-20 | 4-7 | 1-2 |
| Donte DiVincenzo | 22 | 1 | 4 | 8-13 | 6-10 | 0-0 |
| Rudy Gobert | 11 | 13 | 3 | 5-5 | 0-0 | 1-3 |
| Naz Reid | 9 | 6 | 3 | 3-6 | 2-4 | 1-2 |
The biggest scoring contributions came from Randle, McDaniels, Edwards, and DiVincenzo.
Gobert provided the rebounding foundation, while Edwards and Randle handled much of the creation.
Player Stats Table: Cleveland Cavaliers
| Player | PTS | REB | AST | FG | 3PT | FT |
| Donovan Mitchell | 30 | 7 | 8 | 10-20 | 2-8 | 8-9 |
| Evan Mobley | 19 | 4 | 3 | 8-11 | 3-5 | Not listed |
| Darius Garland | 16 | 1 | 8 | 7-16 | 1-4 | Not listed |
| De’Andre Hunter | 14 | 7 | 4 | 6-11 | Not listed | Not listed |
| Jaylon Tyson | 22 | 2 | 3 | 7-13 | 5-11 | Not listed |
| Jarrett Allen | Not provided | 10 | Not provided | Not provided | Not provided | Not provided |
The supplied player data does not include complete shooting splits for every Cavaliers player listed above, so those missing figures are intentionally not filled in.
That distinction is important when publishing statistical content. A clean article should separate verified figures from unavailable information rather than estimating missing numbers.
Key Statistical Takeaways
Several numbers define the matchup.
1. Minnesota made 20 three-pointers
This was the largest offensive difference.
2. Minnesota shot 57.3 percent
The Timberwolves converted 51 of 89 attempts.
3. Cleveland had 30 points from Mitchell
Mitchell was the game’s highest individual scorer.
4. Randle nearly recorded a triple-double
He finished with 28 points, 11 rebounds, and 8 assists.
5. Edwards recorded 9 assists
His passing was almost as significant as his scoring.
6. Gobert grabbed 13 rebounds
He led Minnesota on the glass.
7. McDaniels shot 11-for-14
His efficiency was one of Minnesota’s standout individual numbers.
8. DiVincenzo made 6 threes
His perimeter shooting helped stretch Cleveland’s defense.
What This Matchup Reveals About Shot Quality
Box scores cannot show every detail of shot quality, but they can reveal the broad offensive profile.
Minnesota took 89 field-goal attempts and converted 51.
Cleveland took 91 and made 48.
The Cavaliers actually attempted two more shots, yet Minnesota scored more because its attempts produced more value.
The clearest example is the three-point line.
A team making 20 threes has a significant scoring advantage over a team making 11, particularly when both teams are also shooting above 50 percent overall.
This is why a nine-point final margin can coexist with a much larger underlying shooting difference.
The Importance of Minnesota’s Home Performance
Minnesota entered the game 14-6 at home.
That home record provided context for the matchup.
Target Center also hosted an attendance of 17,274 for the game.
The Timberwolves were able to use their home environment while playing an opponent that entered with an 8-9 road record.
The home setting does not by itself explain the result, but it provides useful context when examining the game.
Season Series and the Next Meeting
The January matchup was the first meeting of the season series according to the supplied data, giving Minnesota a 1-0 advantage after this game.
The teams then met again on January 10, 2026 in Cleveland.
That second game produced a very different result.
Cleveland defeated Minnesota 146-134, according to the official NBA game record.
That result is useful context because it shows that the first game should not be treated as a complete representation of the two teams across the season.
The two contests produced different outcomes only two days apart, highlighting how much game-specific shooting and execution can influence an NBA matchup.
How to Read NBA Player Stats Correctly
For readers researching player statistics, there is a common mistake worth avoiding.
Points are the easiest number to understand, but they should not be viewed in isolation.
A better process is:
- Start with points to identify scoring production.
- Check field-goal attempts to understand volume.
- Check three-point attempts and makes.
- Review rebounds for possession control.
- Review assists for playmaking.
- Check turnovers before judging offensive efficiency.
- Compare team shooting percentages.
- Look at quarter-by-quarter scoring to identify when the game changed.
- Compare the individual statistics with the final team result.
This approach produces a much clearer picture.
For example, Mitchell’s 30 points were excellent individual production, but Minnesota had four players who scored at least 22.
Likewise, Randle’s 28 points were important, but his 11 rebounds and 8 assists show why his contribution was broader than scoring.
Why the Full Box Score Is Better Than a Scoring Leader List
A simple search result might tell a reader that Donovan Mitchell scored 30 and Julius Randle scored 28.
That is useful, but incomplete.
The complete game story requires additional numbers.
Minnesota’s 20 three-pointers explain the scoring advantage.
The 45 rebounds explain the possession advantage.
The 17 turnovers show one area where Minnesota struggled.
The 43-point third quarter explains when the game changed.
The 33 assists show that both teams generated substantial passing production.
This is why detailed player statistics are most useful when connected to team-level context.
FAQ
Who scored the most points in the Timberwolves vs Cavaliers game?
Donovan Mitchell was Cleveland’s leading scorer with 30 points. Julius Randle led Minnesota with 28 points.
What was the final score between Minnesota and Cleveland?
The Minnesota Timberwolves defeated the Cleveland Cavaliers 131-122.
Who led the Timberwolves in rebounds?
Rudy Gobert led Minnesota with 13 rebounds. Julius Randle followed with 11.
How many assists did Anthony Edwards have?
Anthony Edwards recorded 9 assists along with 25 points and 7 rebounds.
Who made the most three-pointers for Minnesota?
Donte DiVincenzo made 6 of 10 three-point attempts.
What was the biggest difference between the teams?
Three-point shooting was the clearest statistical difference. Minnesota made 20 of 38 three-point attempts, while Cleveland made 11 of 33.
Conclusion
The timberwolves vs cleveland cavaliers match player stats show why the 131-122 result was about much more than one individual scorer.
Donovan Mitchell produced the game’s highest scoring total with 30 points and added 7 rebounds and 8 assists. Cleveland also received efficient scoring from Evan Mobley and a 22-point contribution from Jaylon Tyson.
Minnesota, however, produced a broader offensive attack.
Julius Randle finished with 28 points, 11 rebounds, and 8 assists. Jaden McDaniels scored 26 points on 11-for-14 shooting. Anthony Edwards added 25 points and 9 assists, while Donte DiVincenzo contributed 22 points and six made three-pointers. Rudy Gobert controlled the glass with 13 rebounds.
The team statistics explain the final result even more clearly.
Minnesota shot 57.3 percent from the field, made 20 three-pointers, collected 45 rebounds, and recorded 33 assists. Cleveland shot 52.7 percent, made 11 threes, collected 38 rebounds, and recorded 31 assists.
The third quarter ultimately became the defining period. Minnesota scored 43 points while Cleveland managed 22, turning a four-point halftime deficit into a 17-point lead entering the final quarter.
Cleveland fought back with 33 points in the fourth, but Minnesota had created enough separation to secure the win.
For anyone analyzing this matchup, the most useful lesson is to read the entire statistical profile rather than focusing on the leading scorer. The combination of shooting efficiency, three-point production, rebounding, assists, turnovers, and quarter-by-quarter scoring provides a much more accurate explanation of how the game unfolded.