New York Liberty vs Phoenix Mercury Match Player Stats
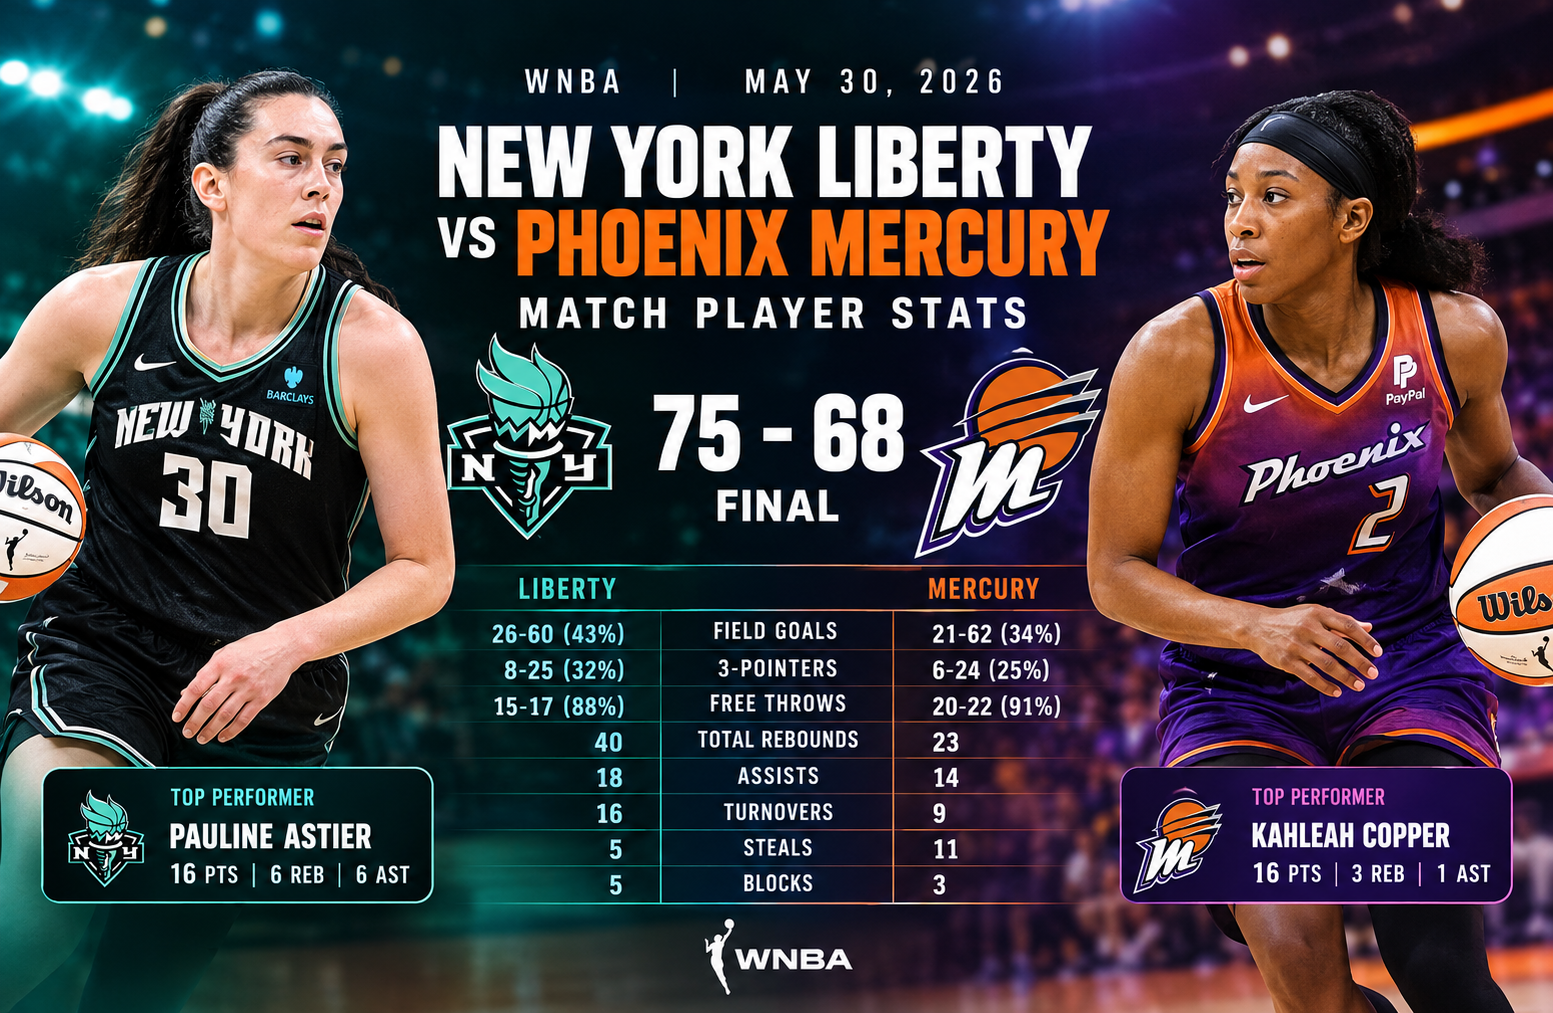
The New York Liberty vs Phoenix Mercury match player stats from May 30, 2026, tell the story of a defensive battle in which New York defeated Phoenix 75-68 at Barclays Center in Brooklyn. The Liberty controlled the opening quarter, survived a strong third-quarter response from the Mercury, and finished the game with a seven-point victory. Pauline Astier led New York with 16 points and six assists, while Kahleah Copper scored 16 points for Phoenix. The most important difference was New York’s ability to convert more field goals and control the rebounding battle, despite committing more turnovers.
The final score reflected a game in which neither team consistently found its offensive rhythm. Phoenix struggled to make shots from the field, while New York created enough scoring opportunities through its shooting efficiency, rebounding, and contributions from multiple players. Natasha Mack provided an important defensive presence for the Mercury, recording nine rebounds and five steals, while Alyssa Thomas contributed 15 points and eight assists.
For basketball fans, the individual numbers reveal more than the final result. They explain how New York built its early advantage, why Phoenix remained competitive, and which performances influenced the outcome. This complete statistical breakdown examines the box score, individual player contributions, team efficiency, quarter-by-quarter scoring, and the tactical factors behind the Liberty’s victory.
New York Liberty vs Phoenix Mercury Match Player Stats: Game Overview
The New York Liberty entered the matchup looking to establish control at home, while the Phoenix Mercury needed a strong performance to overcome their difficult start to the season.
New York finished with a 75-68 victory, improving its overall record to 5-4. Phoenix fell to 2-7 after another challenging offensive performance.
The Liberty’s advantage came primarily from their ability to make more shots and dominate the glass. Phoenix generated opportunities through steals and free throws, but its shooting percentage limited the team’s ability to turn those opportunities into consistent scoring.
Match Information
| Match Detail | Information |
| Competition | Women’s National Basketball Association |
| Game Date | May 30, 2026 |
| Venue | Barclays Center |
| Location | Brooklyn, New York |
| Attendance | 17,579 |
| Final Score | New York Liberty 75, Phoenix Mercury 68 |
| Winning Team | New York Liberty |
| Losing Team | Phoenix Mercury |
| Game Status | Final |
| Liberty Record | 5-4 overall, 3-3 home |
| Mercury Record | 2-7 overall, 1-4 away |
| Liberty Leading Scorer | Pauline Astier, 16 points |
| Mercury Leading Scorer | Kahleah Copper, 16 points |
| Liberty Leading Rebounder | Jonquel Jones, 9 rebounds |
| Mercury Leading Rebounder | Natasha Mack, 9 rebounds |
| Liberty Leading Playmaker | Pauline Astier, 6 assists |
| Mercury Leading Playmaker | Alyssa Thomas, 8 assists |
The matchup featured contrasting statistical strengths.
New York made 26 of its 60 field-goal attempts, producing a 43% shooting percentage. Phoenix converted 21 of 62 attempts, finishing at 34%.
That nine-percentage-point difference was a major factor in the final result.
The Liberty also recorded 40 total rebounds compared with Phoenix’s 23. This gave New York additional opportunities to control possession and limited Phoenix’s ability to recover from missed shots.
However, Phoenix was not completely outplayed in every category. The Mercury recorded 11 steals, compared with five for New York, and committed only nine turnovers.
The Liberty finished with 16 turnovers, creating an important contrast between their offensive production and their possession management.
Final Box Score: New York Liberty vs Phoenix Mercury
The following table summarizes the complete team totals supplied for the matchup.
| Team Statistics | Phoenix Mercury | New York Liberty |
| Points | 68 | 75 |
| Field Goals | 21-62 | 26-60 |
| Field Goal Percentage | 34% | 43% |
| Three-Pointers | 6-24 | 8-25 |
| Three-Point Percentage | 25% | 32% |
| Free Throws | 20-22 | 15-17 |
| Free Throw Percentage | 91% | 88% |
| Total Rebounds | 23 | 40 |
| Offensive Rebounds | 3 | 7 |
| Defensive Rebounds | 20 | 33 |
| Assists | 14 | 18 |
| Turnovers | 9 | 16 |
| Steals | 11 | 5 |
| Blocks | 3 | 5 |
| Personal Fouls | 20 | 21 |
These numbers provide a clear explanation of the result.
New York made five more field goals than Phoenix and collected 17 additional rebounds. Those advantages helped the Liberty compensate for their higher turnover total.
Phoenix’s strongest statistical area was defensive disruption. The Mercury recorded 11 steals, demonstrating their ability to pressure New York’s ball handlers and create possession-changing defensive plays.
The Liberty, meanwhile, depended on efficient shooting and stronger interior control.
The game was not decided by one category alone. It was the combination of shooting, rebounding, and scoring contributions from different players that allowed New York to maintain its advantage.
Quarter-by-Quarter Score Breakdown
The scoring progression shows how New York established its lead and responded when Phoenix threatened to close the gap.
| Quarter | Phoenix Mercury | New York Liberty |
| First Quarter | 11 | 17 |
| Second Quarter | 20 | 17 |
| Third Quarter | 23 | 25 |
| Fourth Quarter | 14 | 16 |
| Final Score | 68 | 75 |
First Quarter: New York Establishes Control
The Liberty opened the game with a 17-11 advantage.
This six-point opening margin provided New York with an early cushion and forced Phoenix to spend the remaining quarters attempting to recover.
The Mercury scored only 11 points during the opening period, suggesting that their offense struggled to establish a consistent rhythm.
New York’s ability to score 17 points without needing a high-scoring quarter was important. The Liberty did not create an overwhelming advantage, but they established enough separation to influence the rest of the game.
The opening quarter also demonstrated the value of defensive discipline.
When a team begins a game with limited scoring, it becomes increasingly important to prevent the opponent from building momentum through easy baskets, transition opportunities, or repeated offensive rebounds.
New York’s early lead gave the team room to absorb Phoenix’s subsequent scoring improvement.
Second Quarter: Phoenix Responds
Phoenix won the second quarter 20-17.
The Mercury improved their offensive production by nine points compared with the opening period.
That improvement allowed Phoenix to reduce the Liberty’s advantage from six points to three points by halftime.
The second quarter was important because it demonstrated that Phoenix could remain competitive despite its initial shooting struggles.
A team that scores only 11 points in the first quarter can easily lose control of a game. Phoenix instead increased its scoring and created a more balanced contest.
However, New York continued to score enough to preserve its lead.
The Liberty’s three-point halftime advantage was not decisive, but it provided a foundation for the second half.
Third Quarter: Both Teams Increase Their Scoring
The third quarter produced the highest combined scoring of the game.
Phoenix scored 23 points, while New York recorded 25.
The Liberty won the period by two points and increased their halftime advantage from three points to five points.
Phoenix’s 23-point quarter was its strongest offensive performance of the matchup.
This improvement was particularly important because the Mercury had struggled to convert field-goal attempts during the first half.
However, New York matched Phoenix’s increased production.
The Liberty’s ability to score 25 points during the same period prevented the Mercury from taking control.
The third quarter ultimately became a test of offensive consistency rather than a complete momentum reversal.
Fourth Quarter: Liberty Protect the Lead
New York won the final quarter 16-14.
The Liberty entered the period with a five-point advantage and finished with a seven-point victory.
Phoenix needed a strong closing performance to overturn the deficit.
Instead, New York continued to score slightly more points and maintained its control.
The Liberty’s 16-point fourth quarter was not an explosive offensive performance, but it was sufficient to protect the lead.
Phoenix scored 14 points, leaving the team unable to close the remaining gap.
The final quarter demonstrated the importance of maintaining offensive efficiency when protecting a lead.
New York did not need to dominate the period. It needed to avoid allowing Phoenix to produce a decisive scoring run.
The Liberty accomplished that objective.
New York Liberty Player Stats and Individual Performances
New York’s victory featured contributions from several players rather than depending entirely on one scorer.
Pauline Astier led the team with 16 points, while Betnijah Laney-Hamilton added 13.
Jonquel Jones and Breanna Stewart contributed important work on the glass, and the Liberty received additional scoring from Han Xu, Rebekah Gardner, Marine Johannes, and Satou Sabally.
This distribution of production helped New York remain competitive when individual players experienced shooting difficulties.
Pauline Astier: Liberty’s Leading Scorer
Pauline Astier delivered the most productive scoring performance for New York.
| Statistic | Pauline Astier |
| Points | 16 |
| Rebounds | 6 |
| Assists | 6 |
| Field Goals | 6-8 |
| Field Goal Percentage | 75% |
| Three-Pointers | 1-1 |
| Three-Point Percentage | 100% |
| Free Throws | 3-4 |
| Turnovers | 2 |
| Steals | 0 |
| Blocks | 1 |
| Plus/Minus | +10 |
Astier’s 16 points were particularly valuable because she converted six of her eight field-goal attempts.
Her 75% field-goal percentage was the strongest listed shooting performance among the Liberty’s leading contributors.
She also recorded six assists, giving her an important role in New York’s offensive organization.
The combination of scoring and playmaking made Astier more than a traditional scoring option.
She could finish possessions herself or create opportunities for teammates.
Her six rebounds also added value beyond her offensive production.
The most revealing number may be her plus/minus of +10.
Plus/minus measures the difference between a team’s scoring and its opponent’s scoring while a player is on the court.
Astier’s positive figure indicates that New York outscored Phoenix by 10 points during her playing time.
It does not mean she personally scored 10 additional points or that her individual performance alone caused the victory.
Instead, it provides useful context for her overall contribution.
Her efficient shooting, passing, and rebounding combined to make her one of the Liberty’s most influential players.
Betnijah Laney-Hamilton: Efficient Secondary Scoring
Betnijah Laney-Hamilton finished with 13 points.
| Statistic | Betnijah Laney-Hamilton |
| Points | 13 |
| Rebounds | 3 |
| Assists | 2 |
| Field Goals | 3-6 |
| Three-Pointers | 2-5 |
| Free Throws | 5-6 |
| Steals | 2 |
| Plus/Minus | +2 |
Laney-Hamilton’s performance was valuable because she provided efficient scoring without needing a large number of field-goal attempts.
She converted three of six field goals and made two of five three-point attempts.
Her five made free throws also helped her reach 13 points.
This distinction matters when analyzing a relatively low-scoring game.
In a matchup where both teams struggle to establish offensive consistency, a player who converts a limited number of opportunities can become especially important.
Laney-Hamilton also recorded two steals.
That defensive contribution complemented her scoring and helped New York maintain pressure on Phoenix.
Her plus/minus of +2 indicates that the Liberty outscored the Mercury by two points during her time on the court.
Jonquel Jones: Rebounding and Interior Defense
Jonquel Jones recorded nine points and nine rebounds.
| Statistic | Jonquel Jones |
| Points | 9 |
| Rebounds | 9 |
| Assists | 2 |
| Field Goals | 2-9 |
| Three-Pointers | 1-4 |
| Free Throws | 4-4 |
| Steals | 1 |
| Blocks | 2 |
| Plus/Minus | +8 |
Jones was New York’s leading rebounder.
Her nine rebounds matched Natasha Mack’s total for Phoenix, but the Liberty’s overall rebounding advantage was much larger.
Jones also recorded two blocks, contributing to New York’s five total blocks.
Those defensive plays were important because Phoenix needed to convert its offensive possessions into points to overcome New York’s shooting advantage.
Jones’ shooting performance was less efficient than Astier’s.
She made only two of nine field-goal attempts.
However, her four successful free throws helped her finish with nine points.
The most important contribution was her presence around the basket.
Jones’ combination of rebounding and shot blocking gave New York a defensive foundation that remained valuable even when her own field-goal attempts did not fall.
Her +8 plus/minus also shows that the Liberty performed well during her minutes.
Breanna Stewart: Balanced Contribution
Breanna Stewart finished with nine points and eight rebounds.
| Statistic | Breanna Stewart |
| Points | 9 |
| Rebounds | 8 |
| Assists | 4 |
| Field Goals | 4-11 |
| Three-Pointers | 1-4 |
| Turnovers | 2 |
| Plus/Minus | +4 |
Stewart’s performance was not the team’s highest-scoring contribution, but she remained involved in multiple areas.
Her eight rebounds helped New York maintain control of the glass.
She also recorded four assists, providing another passing option alongside Astier.
The Liberty benefited from this balance because Phoenix’s defensive pressure could otherwise force the offense into difficult individual possessions.
Stewart’s four assists gave New York additional ways to create scoring opportunities.
Her +4 plus/minus was another positive indicator of the team’s performance during her minutes.
Han Xu: Productive Bench Scoring
Han Xu recorded nine points and six rebounds.
| Statistic | Han Xu |
| Points | 9 |
| Rebounds | 6 |
| Assists | 1 |
| Field Goals | 4-7 |
| Plus/Minus | +5 |
Han Xu provided efficient scoring from the bench.
She made four of seven field-goal attempts, producing a strong shooting performance.
Her six rebounds also helped New York maintain its advantage in the interior.
The Liberty needed contributions from players outside their primary starters because Phoenix generated 11 steals and created pressure on the offense.
Han’s scoring helped New York avoid relying exclusively on Astier, Laney-Hamilton, or Stewart.
Her +5 plus/minus suggests that the Liberty maintained a positive scoring margin during her time on the court.
Marine Johannes: Three-Point Contributions
Marine Johannes finished with six points.
| Statistic | Marine Johannes |
| Points | 6 |
| Rebounds | 2 |
| Assists | 1 |
| Field Goals | 2-5 |
| Three-Pointers | 2-5 |
| Plus/Minus | -6 |
Johannes made both of her field goals from beyond the arc.
Her three-point shooting provided New York with a different scoring option.
However, her plus/minus was -6.
That figure means the Liberty were outscored by six points while she was on the court.
It does not necessarily indicate poor individual play.
Plus/minus is influenced by the entire lineup, the opponent’s scoring, and the situations in which a player enters or leaves the game.
Johannes’ two successful three-pointers remained a useful offensive contribution.
Leonie Fiebich: Defensive and Supporting Role
Leonie Fiebich finished with three points.
| Statistic | Leonie Fiebich |
| Points | 3 |
| Rebounds | 2 |
| Assists | 1 |
| Field Goals | 1-6 |
| Plus/Minus | +2 |
Fiebich’s scoring was limited, but her contribution should not be evaluated through points alone.
New York received production from several players, allowing the team to maintain offensive balance.
Her +2 plus/minus indicates that the Liberty outscored Phoenix during her playing time.
The available statistics do not provide enough detail to quantify her defensive assignments or individual matchup impact.
A reliable analysis should avoid assigning specific defensive achievements that are not documented in the supplied box-score information.
Satou Sabally: Supporting Bench Production
Satou Sabally recorded four points, three rebounds, and one assist.
| Statistic | Satou Sabally |
| Points | 4 |
| Rebounds | 3 |
| Assists | 1 |
| Plus/Minus | +5 |
Sabally’s scoring total was modest, but her rebounds and assist helped New York maintain a broader offensive contribution.
Her +5 plus/minus was positive.
That figure suggests the Liberty performed better than Phoenix during her minutes.
It does not establish that she was individually responsible for the entire scoring difference.
Rebekah Gardner: Additional Scoring Support
Rebekah Gardner contributed six points and one rebound.
| Statistic | Rebekah Gardner |
| Points | 6 |
| Rebounds | 1 |
| Assists | 0 |
| Plus/Minus | +3 |
Gardner’s six points provided another source of offense.
Her +3 plus/minus indicates that New York outscored Phoenix while she was on the floor.
The importance of this contribution becomes clearer when considering the Liberty’s overall shooting performance.
New York made 26 field goals, but those baskets were distributed among several players.
That distribution reduced the team’s dependence on a single offensive option.
New York Liberty Player Summary
| Player | Points | Rebounds | Assists | Plus/Minus |
| Pauline Astier | 16 | 6 | 6 | +10 |
| Betnijah Laney-Hamilton | 13 | 3 | 2 | +2 |
| Jonquel Jones | 9 | 9 | 2 | +8 |
| Breanna Stewart | 9 | 8 | 4 | +4 |
| Han Xu | 9 | 6 | 1 | +5 |
| Marine Johannes | 6 | 2 | 1 | -6 |
| Rebekah Gardner | 6 | 1 | 0 | +3 |
| Satou Sabally | 4 | 3 | 1 | +5 |
| Leonie Fiebich | 3 | 2 | 1 | +2 |
Pauline Astier led New York in scoring and assists.
Jonquel Jones led the team in rebounds.
The Liberty’s strongest feature was the distribution of contributions across the roster.
Astier created efficient offense, Laney-Hamilton provided secondary scoring, Jones controlled the glass, and several bench players added important points.
That combination helped New York win despite committing 16 turnovers.
Phoenix Mercury Player Stats and Individual Performances
Phoenix’s individual performances were led by Kahleah Copper, Alyssa Thomas, and Natasha Mack.
Copper scored 16 points, Thomas recorded 15 points and eight assists, and Mack collected nine rebounds and five steals.
These three players supplied the Mercury’s most important statistical contributions.
However, Phoenix’s overall field-goal percentage limited the effectiveness of its offensive production.
The team made only 21 of 62 field-goal attempts.
That shooting difficulty meant the Mercury needed to rely more heavily on defensive pressure, free throws, and playmaking.
Kahleah Copper: Phoenix’s Leading Scorer
Kahleah Copper finished with 16 points.
| Statistic | Kahleah Copper |
| Points | 16 |
| Rebounds | 3 |
| Assists | 1 |
| Field Goals | 4-16 |
| Field Goal Percentage | 25% |
| Three-Pointers | 1-8 |
| Three-Point Percentage | 12.5% |
| Free Throws | 7-8 |
| Free Throw Percentage | 87.5% |
| Steals | 0 |
| Blocks | 1 |
| Plus/Minus | -4 |
Copper was Phoenix’s leading scorer.
Her 16 points matched Astier’s total for New York.
However, the shooting numbers reveal an important difference.
Copper made four of 16 field-goal attempts.
That 25% field-goal percentage was significantly below New York’s overall 43% shooting rate.
Copper’s three-point shooting was particularly challenging.
She made one of eight attempts from beyond the arc.
Her free-throw performance was much stronger.
Copper converted seven of eight free throws, allowing her to reach 16 points despite limited field-goal efficiency.
This is a useful example of why points alone do not fully describe a player’s offensive performance.
A player can lead a team in scoring while still experiencing difficulties converting field-goal attempts.
Copper’s role remained important because Phoenix needed scoring from its primary offensive options.
Her 16 points kept the Mercury competitive, but the team’s overall shooting percentage prevented those contributions from producing a winning result.
Alyssa Thomas: Playmaking and Offensive Organization
Alyssa Thomas recorded 15 points and eight assists.
| Statistic | Alyssa Thomas |
| Points | 15 |
| Rebounds | 3 |
| Assists | 8 |
| Turnovers | 3 |
| Steals | 3 |
| Blocks | 1 |
| Plus/Minus | -8 |
Thomas was Phoenix’s leading playmaker.
Her eight assists represented more than half of the Mercury’s 14 total assists.
That contribution highlights her importance in organizing the offense.
Thomas also scored 15 points, giving Phoenix a second major scoring option alongside Copper.
Her three steals provided additional defensive value.
However, she recorded three turnovers.
Those turnovers were not enough to explain Phoenix’s overall offensive struggles by themselves, but they contributed to the difficulty of maintaining possession.
Thomas’ -8 plus/minus indicates that Phoenix was outscored by eight points during her minutes.
This number should be interpreted alongside her scoring and playmaking.
The Mercury depended heavily on her ability to create opportunities.
Her eight assists demonstrate that she successfully generated scoring chances, even though the team’s overall shooting efficiency remained low.
Natasha Mack: Rebounding and Defensive Pressure
Natasha Mack recorded six points and nine rebounds.
| Statistic | Natasha Mack |
| Points | 6 |
| Rebounds | 9 |
| Assists | 0 |
| Steals | 5 |
| Blocks | 1 |
| Plus/Minus | -11 |
Mack was Phoenix’s leading rebounder.
Her nine rebounds matched Jonquel Jones’ total for New York.
However, her defensive impact extended beyond rebounding.
Mack recorded five steals.
That was the highest individual steal total listed for either team.
Her five steals accounted for a substantial portion of Phoenix’s 11 team steals.
This performance demonstrates how a player can contribute defensively even when the team’s overall result is unfavorable.
Mack also recorded one block.
Her defensive activity helped Phoenix create additional opportunities.
However, her -11 plus/minus indicates that New York outscored Phoenix during her minutes.
This does not erase the value of her five steals.
Instead, it shows that individual defensive contributions and overall team results can differ.
Phoenix Mercury Player Summary
| Player | Points | Rebounds | Assists | Plus/Minus |
| Kahleah Copper | 16 | 3 | 1 | -4 |
| Alyssa Thomas | 15 | 3 | 8 | -8 |
| Natasha Mack | 6 | 9 | 0 | -11 |
The available data identifies Copper as Phoenix’s leading scorer, Thomas as its leading playmaker, and Mack as its leading rebounder.
These three players represented the most important individual statistical contributions supplied for the Mercury.
The data does not provide complete individual box-score rows for every Phoenix player.
Therefore, a responsible analysis should not invent points, rebounds, assists, shooting percentages, or minutes for the remaining roster.
The available team totals remain sufficient to evaluate Phoenix’s overall shooting, rebounding, and possession performance.
Shooting Efficiency: Why New York Won
The most important statistical difference was shooting efficiency.
New York made 26 of 60 field-goal attempts.
Phoenix made 21 of 62.
The Liberty converted approximately 43% of their attempts, while the Mercury converted approximately 34%.
That difference meant New York made five additional field goals despite taking two fewer attempts.
Field-Goal Comparison
| Shooting Category | Phoenix Mercury | New York Liberty |
| Attempts | 62 | 60 |
| Made Shots | 21 | 26 |
| Shooting Percentage | 34% | 43% |
New York’s shooting advantage was especially valuable in a game that finished with a combined 143 points.
Neither team produced an exceptionally high-scoring offensive performance.
In a relatively low-scoring matchup, every successful field goal can have a meaningful effect on the final margin.
The Liberty’s five additional made field goals helped create their seven-point victory.
Three-Point Shooting
Phoenix made six of 24 three-point attempts.
New York made eight of 25.
| Three-Point Category | Phoenix Mercury | New York Liberty |
| Attempts | 24 | 25 |
| Made | 6 | 8 |
| Percentage | 25% | 32% |
New York’s three-point advantage was modest but important.
The Liberty made two additional three-pointers.
That difference provided six additional points from beyond the arc.
Phoenix’s 25% three-point shooting limited its ability to close the gap.
The Mercury attempted nearly as many three-pointers as New York, but converted a smaller percentage.
This is particularly relevant because three-point attempts can create significant scoring opportunities when they are made consistently.
However, a high number of attempts does not guarantee an effective offense.
The quality of the shots and the conversion rate matter.
Free-Throw Shooting
Phoenix was more effective at the free-throw line.
The Mercury made 20 of 22 attempts.
New York made 15 of 17.
| Free-Throw Category | Phoenix Mercury | New York Liberty |
| Attempts | 22 | 17 |
| Made | 20 | 15 |
| Percentage | 91% | 88% |
Phoenix converted five more free throws than New York.
The Mercury’s 91% free-throw percentage was an important positive.
It prevented the team’s scoring total from falling even further.
However, the advantage was not sufficient to overcome New York’s superior field-goal production.
The Liberty made five additional field goals and two additional three-pointers.
Phoenix’s stronger free-throw performance helped keep the game competitive, but New York generated more successful field-goal attempts.
Rebounding Battle: Liberty Control the Glass
New York recorded 40 rebounds.
Phoenix recorded 23.
The 17-rebound difference was one of the most significant statistical advantages in the game.
| Rebounding Category | Phoenix Mercury | New York Liberty |
| Total Rebounds | 23 | 40 |
| Offensive Rebounds | 3 | 7 |
| Defensive Rebounds | 20 | 33 |
The Liberty collected four more offensive rebounds and 13 more defensive rebounds.
That distinction matters because offensive and defensive rebounds serve different purposes.
Offensive rebounds give a team another opportunity to score after a missed shot.
Defensive rebounds allow a team to end the opponent’s possession and begin its own offensive sequence.
New York’s advantage in defensive rebounds was especially important.
The Liberty collected 33 defensive rebounds compared with Phoenix’s 20.
That figure indicates that New York secured a larger share of the defensive rebounding opportunities represented in the team totals.
Phoenix’s three offensive rebounds were also a limiting factor.
The Mercury collected only three offensive rebounds throughout the game.
That restricted the team’s ability to recover missed shots and create additional scoring opportunities.
New York’s seven offensive rebounds provided more second-chance opportunities.
The rebounding advantage did not automatically guarantee a victory.
However, it gave the Liberty a stronger foundation for controlling possession.
Jonquel Jones and Natasha Mack
Both teams had a player who recorded nine rebounds.
Jonquel Jones collected nine for New York.
Natasha Mack collected nine for Phoenix.
Their individual totals were equal, but their teams finished with very different rebounding numbers.
This demonstrates why individual rebounding leaders should be evaluated alongside team performance.
A player can lead a team in rebounds without the team winning the overall rebounding battle.
Jones also recorded two blocks.
Mack recorded five steals.
Their defensive contributions came through different statistical categories.
Jones provided more documented rim protection, while Mack created defensive disruption through steals.
The matchup therefore featured contrasting defensive contributions even though the final result favored New York.
Assists and Ball Movement
New York recorded 18 assists.
Phoenix recorded 14.
The Liberty’s four-assist advantage reflected their stronger overall passing production.
However, Phoenix’s leading playmaker recorded the highest individual assist total.
Alyssa Thomas finished with eight assists.
Pauline Astier led New York with six.
| Playmaking Category | Phoenix Mercury | New York Liberty |
| Team Assists | 14 | 18 |
| Leading Assists | Alyssa Thomas, 8 | Pauline Astier, 6 |
Thomas accounted for more than half of Phoenix’s team assists.
That concentration suggests the Mercury depended heavily on her playmaking.
Astier’s six assists represented one-third of New York’s team total.
The Liberty received additional passing contributions from Stewart, Jones, Laney-Hamilton, and other players.
This distribution gave New York multiple playmaking options.
It also reduced the need for Astier to create every scoring opportunity herself.
The difference between individual and team assists is important.
A leading playmaker can have an outstanding assist total without the team necessarily recording more assists overall.
That is exactly what happened in this matchup.
Thomas finished with eight assists, but New York recorded 18 team assists compared with Phoenix’s 14.
Turnovers and Possession Management
Phoenix committed nine turnovers.
New York committed 16.
The Mercury therefore finished with seven fewer turnovers.
| Possession Category | Phoenix Mercury | New York Liberty |
| Turnovers | 9 | 16 |
| Steals | 11 | 5 |
Phoenix’s lower turnover total was an important advantage.
The Mercury protected the ball more effectively in terms of recorded turnovers.
New York, meanwhile, experienced more possession losses.
The Liberty’s 16 turnovers represented a clear area for improvement.
However, the team still won because its shooting and rebounding advantages were substantial.
This is an important lesson for interpreting basketball statistics.
A team can commit more turnovers and still win when it converts its other opportunities more effectively.
New York’s 43% field-goal percentage and 40 rebounds helped offset its turnover disadvantage.
Phoenix’s 11 steals also demonstrate that the Mercury were active defensively.
The team generated defensive pressure but did not translate that advantage into a victory.
Turnovers Versus Steals
A steal is a defensive statistic credited when a player takes possession from an opponent through a qualifying defensive action.
A turnover is an offensive possession loss.
The two categories are related, but they are not identical.
Phoenix recorded 11 steals and nine turnovers.
Those totals do not mean the Mercury had only two net possession advantages.
Basketball possession changes involve additional factors, including rebounds, made baskets, missed shots, and other turnover types.
The available team statistics should therefore be interpreted individually rather than combined into an invented possession formula.
The clearest conclusion is that Phoenix created more steals, while New York committed more turnovers.
Defensive Performance: Blocks, Steals, and Fouls
Both teams contributed defensively, but their strengths differed.
Phoenix recorded 11 steals.
New York recorded five.
The Liberty recorded five blocks.
Phoenix recorded three.
| Defensive Category | Phoenix Mercury | New York Liberty |
| Steals | 11 | 5 |
| Blocks | 3 | 5 |
| Personal Fouls | 20 | 21 |
Phoenix’s steals were one of its strongest statistical categories.
The Mercury’s 11 steals exceeded New York’s total by six.
That defensive pressure helped create opportunities for Phoenix to remain competitive.
New York’s advantage came from shot blocking.
The Liberty recorded five blocks compared with Phoenix’s three.
Jones contributed two blocks, while Stewart, Astier, and other players provided additional defensive production within the supplied team totals.
The Liberty also committed one additional personal foul.
Phoenix recorded 20 fouls, while New York recorded 21.
The difference was relatively small.
Neither team’s foul total alone explains the final result.
The more important contrast was the relationship between defensive activity and offensive efficiency.
Phoenix generated steals but struggled to make field goals.
New York recorded more blocks and rebounds while converting a higher percentage of its attempts.
Plus/Minus Analysis: Which Players Had the Strongest On-Court Results?
Plus/minus measures the scoring difference between the player’s team and its opponent while that player is on the court.
It provides context about the team’s performance during a player’s minutes.
It does not measure individual scoring efficiency.
It also does not prove that a player caused the team’s scoring margin.
Liberty Plus/Minus Leaders
| Player | Plus/Minus |
| Pauline Astier | +10 |
| Jonquel Jones | +8 |
| Han Xu | +5 |
| Satou Sabally | +5 |
| Breanna Stewart | +4 |
| Rebekah Gardner | +3 |
| Betnijah Laney-Hamilton | +2 |
| Leonie Fiebich | +2 |
| Marine Johannes | -6 |
Pauline Astier recorded the highest listed plus/minus for New York.
Her +10 was consistent with her strong scoring and playmaking performance.
Jones recorded +8.
Her rebounding and shot-blocking contributions helped New York maintain a positive scoring margin during her minutes.
Han Xu and Satou Sabally both recorded +5.
Stewart finished at +4.
These numbers suggest that the Liberty’s positive result was distributed across multiple players.
Marine Johannes recorded -6.
That figure means New York was outscored during her minutes.
However, her two successful three-pointers remained part of the team’s offensive production.
Mercury Plus/Minus Leaders
| Player | Plus/Minus |
| Kahleah Copper | -4 |
| Alyssa Thomas | -8 |
| Natasha Mack | -11 |
All three listed Phoenix players recorded negative plus/minus figures.
Copper finished at -4.
Thomas finished at -8.
Mack finished at -11.
The numbers indicate that New York outscored Phoenix during each player’s minutes.
They do not mean that those players individually lost the game.
Each player’s plus/minus is influenced by the full lineup and the opposing players on the court.
For example, Mack recorded five steals and nine rebounds despite finishing with -11.
Her individual defensive contributions were valuable, but the overall team scoring margin during her minutes favored New York.
This is why plus/minus should be used alongside points, rebounds, assists, and shooting statistics rather than as a standalone ranking.
Starting Lineups and Bench Contributions
The supplied matchup data identifies the starting lineups for both teams.
Phoenix Mercury Starting Lineup
| Player | Jersey Number |
| Alyssa Thomas | 25 |
| Natasha Mack | 4 |
| Noemie Brochant | 1 |
| Kahleah Copper | 2 |
| Monique Akoa Makani | 8 |
Phoenix used a starting group featuring Thomas, Mack, Copper, and two additional listed players.
Thomas provided playmaking.
Copper provided scoring.
Mack contributed rebounding and defensive pressure.
The available data does not include complete individual statistical rows for every starter.
Therefore, the analysis focuses on the documented contributions rather than assigning unverified numbers to the other players.
Phoenix Mercury Bench
| Player | Jersey Number |
| DeWanna Bonner | 24 |
| Valeriane Ayayi | 11 |
| Kyara Linskens | 31 |
| Jovana Nogic | 29 |
| Sami Whitcomb | 33 |
| Kiana Williams | 23 |
| Quionche Carter | 20 |
The Mercury’s bench included several listed players.
However, individual playing time and complete statistical totals are not provided for all of them.
The absence of a documented individual box-score row should not be interpreted as evidence that a player had no impact.
It simply means that the available information does not support a detailed individual assessment.
New York Liberty Starting Lineup
| Player | Jersey Number |
| Breanna Stewart | 30 |
| Leonie Fiebich | 13 |
| Jonquel Jones | 35 |
| Marine Johannes | 23 |
| Pauline Astier | 18 |
The Liberty’s starting group included Stewart, Jones, Astier, Johannes, and Fiebich.
The documented statistics show that Astier led the team in scoring and assists.
Jones led the team in rebounds.
Stewart recorded eight rebounds and four assists.
Johannes contributed two three-pointers.
Fiebich recorded three points.
These contributions demonstrate how New York received production from several positions.
New York Liberty Bench
| Player | Jersey Number |
| Satou Sabally | 0 |
| Han Xu | 21 |
| Rebekah Gardner | 7 |
| Betnijah Laney-Hamilton | 44 |
| Rebecca Allen | 9 |
| Raquel Carrera | 14 |
The Liberty’s bench played an important role in the team’s scoring distribution.
Han Xu recorded nine points.
Gardner added six.
Sabally recorded four.
Laney-Hamilton contributed 13 points.
These documented performances helped New York maintain offensive balance.
The available data does not provide complete individual statistics for Rebecca Allen or Raquel Carrera.
Raquel Carrera was listed as a coach’s decision DNP.
Injury Report and Inactive Players
The supplied injury report identifies several players who did not participate.
Phoenix Mercury
Sami Whitcomb was listed as:
DNP: Left knee injury
Kiana Williams and Quionche Carter were listed as:
DNP: Coach’s decision
These absences are relevant when reviewing the available roster.
However, the supplied information does not establish how much each absence affected Phoenix’s performance.
It would be inaccurate to claim that the Mercury would have won if any of these players had participated.
The box score provides the recorded result, not a reliable estimate of an alternative outcome.
New York Liberty
Raquel Carrera was listed as:
DNP: Coach’s decision
The supplied data does not identify another Liberty injury-related absence.
The absence of a player from the rotation can influence available lineup options, but its specific effect depends on playing time, role, matchup, and team strategy.
Without those details, the responsible approach is to report the inactive status without assigning an unsupported impact.
Tactical Analysis: How the Liberty Created Their Advantage
The statistical breakdown suggests several important tactical themes.
1. New York Converted More Field-Goal Attempts
The Liberty made 26 field goals.
Phoenix made 21.
New York’s higher shooting percentage allowed it to score more effectively despite taking fewer attempts.
The difference was particularly important because the game did not feature a large scoring total.
In a 75-68 contest, five additional made field goals can create a substantial advantage.
2. The Liberty Controlled Defensive Rebounding
New York collected 33 defensive rebounds.
Phoenix collected 20.
That difference limited Phoenix’s ability to recover missed shots and create second-chance opportunities.
The Mercury recorded only three offensive rebounds.
This was one of the clearest statistical limitations in their performance.
3. Phoenix Created Defensive Pressure
Phoenix recorded 11 steals.
That was six more than New York.
The Mercury’s defensive pressure helped create possession changes and prevented the Liberty from maintaining perfect ball security.
However, Phoenix’s defensive activity did not translate into a higher overall shooting percentage.
The team still finished with 34% field-goal shooting.
4. New York Received More Balanced Scoring
Astier led the Liberty with 16 points.
Laney-Hamilton added 13.
Jones, Stewart, and Han Xu each recorded nine.
Gardner and Johannes contributed six apiece.
This distribution gave New York multiple scoring options.
Phoenix’s leading scorers were Copper and Thomas.
They combined for 31 points.
Their production was important, but the team still needed additional efficient scoring to overcome New York’s shooting and rebounding advantages.
5. Phoenix’s Free-Throw Shooting Kept the Game Competitive
The Mercury made 20 of 22 free throws.
New York made 15 of 17.
Phoenix’s advantage at the line was substantial.
However, the Mercury did not convert enough field-goal attempts to overcome the Liberty’s overall shooting advantage.
The free-throw numbers explain why Phoenix remained competitive despite its 34% field-goal percentage.
What the Statistics Reveal About the Game
The most useful insight from this matchup is that the final score does not reflect every part of the performance.
New York won because it combined efficient shooting with strong rebounding.
Phoenix remained competitive because it generated steals, converted free throws, and received scoring from its leading players.
The Liberty’s 16 turnovers were a weakness.
The Mercury’s 34% field-goal percentage was another.
The difference was that New York’s strengths outweighed its weaknesses more effectively.
The Liberty’s Most Important Statistical Advantages
New York finished with:
- Five more made field goals.
- Two more made three-pointers.
- Seventeen more total rebounds.
- Four more assists.
- Two more blocks.
Phoenix finished with:
- Seven fewer turnovers.
- Six more steals.
- Five more made free throws.
The final score was therefore the result of competing statistical advantages.
New York won the categories that most directly supported its overall scoring production.
Phoenix performed better in ball security, steals, and free-throw conversion.
The Liberty’s advantage in field-goal efficiency and rebounding proved more influential.
Historical Context: The 2026 Season Series
The supplied season-series information lists three meetings between the teams.
| Game | Date | Result |
| Game 1 | May 28, 2026 | New York Liberty 84-74 Phoenix Mercury |
| Game 2 | May 30, 2026 | New York Liberty 75-68 Phoenix Mercury |
| Game 3 | August 2, 2026 | New York Liberty 94-92 Phoenix Mercury |
According to the supplied data, New York won all three meetings.
The Liberty finished the listed season series with a 3-0 record against Phoenix.
The Mercury finished 0-3.
These results provide useful context for the May 30 matchup.
The first meeting featured a 10-point Liberty victory.
The second meeting was decided by seven points.
The third was a two-point game.
The listed results suggest that the teams remained competitive, even though New York won each matchup.
The August meeting was particularly close.
However, the available data does not provide a complete player-by-player statistical breakdown for that game.
The season-series table should therefore be used to summarize results rather than make unsupported comparisons between individual performances across all three meetings.
What Fans Should Look for in a Box Score
A basketball box score is most useful when its statistics are interpreted together.
The following categories provide a practical framework for evaluating a matchup.
Points
Points show how much scoring a player contributed.
However, points should be evaluated alongside shooting attempts.
Copper scored 16 points, but made only four of 16 field-goal attempts.
Astier also scored 16 points, while making six of eight field-goal attempts.
The equal scoring totals therefore came from different shooting performances.
Rebounds
Rebounds measure possession recovery after missed shots.
Jones and Mack both recorded nine rebounds.
However, New York collected 40 team rebounds compared with Phoenix’s 23.
Team rebounding provides context that individual totals cannot fully capture.
Assists
Assists indicate passing contributions that directly lead to made baskets.
Thomas recorded eight assists.
Astier recorded six.
These numbers show the importance of both players in their teams’ offensive organization.
Steals
Steals indicate defensive plays that take possession from the opponent.
Mack recorded five.
Thomas recorded three.
Phoenix finished with 11 team steals.
This category highlights the Mercury’s defensive activity.
Blocks
Blocks record defensive actions that stop or alter shot attempts.
Jones recorded two blocks.
New York finished with five team blocks.
Phoenix recorded three.
This category provides additional context for the Liberty’s interior defense.
Turnovers
Turnovers represent lost offensive possessions.
Phoenix committed nine.
New York committed 16.
The Liberty’s higher turnover total was a clear weakness.
Plus/Minus
Plus/minus shows the team’s scoring margin while a player is on the court.
Astier finished at +10.
Mack finished at -11.
These figures provide lineup context but should not be interpreted as direct measurements of individual quality.
Data Accuracy and Box-Score Limitations
The statistics in this article are based on the supplied ESPN matchup data.
The provided information includes complete team totals and selected individual player statistics.
However, it does not explicitly identify every player’s complete individual statistical row.
The supplied data states that individual statistics were matched to the listed roster order.
Because the original extracted box-score text does not independently label every player row, the article does not invent missing statistics.
This distinction is important for readers who want accurate basketball analysis.
A complete player box score normally includes individual statistics such as:
- Minutes played.
- Field goals made and attempted.
- Three-pointers made and attempted.
- Free throws made and attempted.
- Offensive and defensive rebounds.
- Assists.
- Steals.
- Blocks.
- Turnovers.
- Personal fouls.
- Points.
- Plus/minus.
The available information supports detailed analysis of the players whose statistics were explicitly supplied.
It does not support a complete individual statistical table for every player listed on either roster.
Readers should consult the original ESPN box score for the complete official player rows and any additional details.
View the official ESPN box score
Frequently Asked Questions
Who won the New York Liberty vs Phoenix Mercury game on May 30, 2026?
The New York Liberty defeated the Phoenix Mercury 75-68 at Barclays Center in Brooklyn, New York.
Who was the leading scorer for the New York Liberty?
Pauline Astier led New York with 16 points. She also recorded six rebounds and six assists.
Who was the leading scorer for the Phoenix Mercury?
Kahleah Copper led Phoenix with 16 points. She made four field goals and seven free throws.
Who had the most rebounds in the Liberty vs Mercury matchup?
Jonquel Jones led New York with nine rebounds, while Natasha Mack led Phoenix with nine rebounds.
How many assists did Alyssa Thomas record?
Alyssa Thomas recorded eight assists, making her Phoenix’s leading playmaker in the matchup.
What was the biggest statistical difference between the teams?
New York recorded 40 rebounds compared with Phoenix’s 23 and made 26 field goals compared with Phoenix’s 21. The Liberty also shot 43% from the field, while the Mercury shot 34%.
Conclusion
The New York Liberty vs Phoenix Mercury match player stats show how New York secured a 75-68 victory through efficient shooting, strong rebounding, and contributions from multiple players.
Pauline Astier led the Liberty with 16 points and six assists, while Jonquel Jones recorded nine rebounds and two blocks. Betnijah Laney-Hamilton added 13 points, and several additional Liberty players contributed important scoring.
Phoenix received 16 points from Kahleah Copper, 15 points and eight assists from Alyssa Thomas, and nine rebounds with five steals from Natasha Mack.
The Mercury’s strongest statistical advantages came from free-throw shooting, steals, and turnover management. However, New York’s 43% field-goal percentage and 40 rebounds compared with Phoenix’s 34% shooting and 23 rebounds proved more influential.
The result demonstrates why a complete basketball analysis requires more than the final score or leading scorer.
Shooting efficiency, rebounding, passing, defensive pressure, and possession management all contributed to the outcome.
For readers reviewing the box score, the most important takeaway is that New York won through a combination of team efficiency and balanced production, while Phoenix’s defensive activity and free-throw accuracy kept the matchup competitive.