Minnesota Vikings vs Dallas Cowboys Match Player Stats
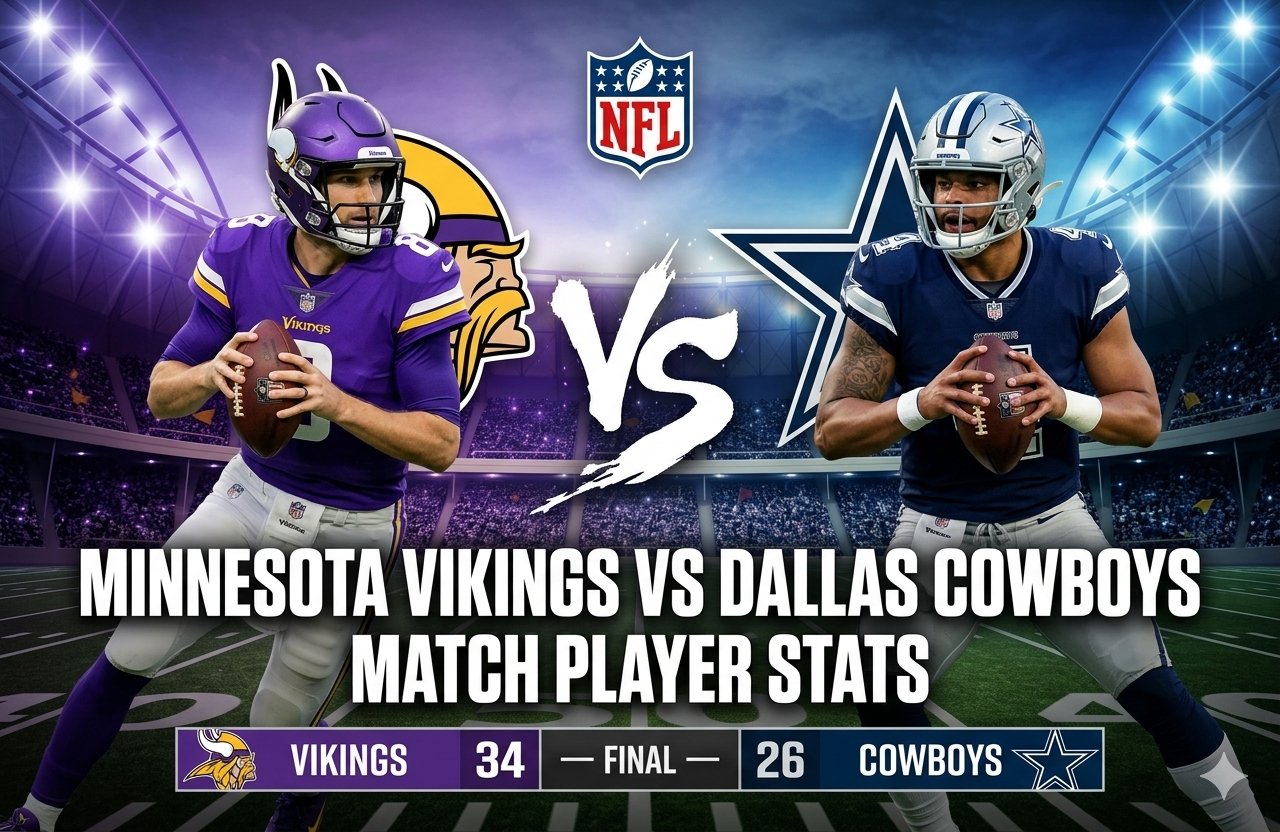
The Minnesota Vikings vs Dallas Cowboys Match Player Stats from the December 2025 meeting tell a much more interesting story than the 34-26 final score alone. Minnesota defeated Dallas on the road, but the Cowboys actually produced more total yards, more first downs, more rushing yards, and more time of possession. The difference came from efficiency, red-zone execution, explosive passing, defensive disruption, and Minnesota’s ability to turn key moments into touchdowns. According to ESPN’s official box score, Minnesota won 34-26, with J.J. McCarthy completing 15 of 24 passes for 250 yards, two touchdowns and one interception, while Dak Prescott completed 23 of 38 passes for 294 yards without a touchdown or interception. (ESPN)
Minnesota Vikings vs Dallas Cowboys Match Player Stats at a Glance
The game was played at AT&T Stadium with Dallas entering as the home team. ESPN records the matchup as December 14, 2025, while its game recap was updated shortly after midnight on December 15. This distinction matters when documenting the game because different databases may display the date according to publication time or local scheduling conventions. (ESPN)
| Category | Minnesota Vikings | Dallas Cowboys |
| Final Score | 34 | 26 |
| First Quarter | 7 | 7 |
| Second Quarter | 10 | 10 |
| Third Quarter | 7 | 6 |
| Fourth Quarter | 10 | 3 |
| Passing | 250 yards | 285 team passing yards |
| Passing Attempts | 24 | 38 |
| Rushing | 77 yards | 138 yards |
| Rushing Attempts | 28 | 29 |
| Total Yards | 327 | 423 |
| First Downs | 21 | 25 |
| Third Down | 2/9 | 2/12 |
| Fourth Down | 3/3 | 3/4 |
| Red Zone | 3/4 | 2/5 |
| Turnovers | 1 | 0 |
| Sacks | 0 | 2 |
| Time of Possession | 27:24 | 32:36 |
One important statistical detail is worth explaining. Dak Prescott’s individual passing line was 23 completions for 294 yards, but ESPN’s team statistics list Dallas with 285 passing yards because the team figure accounts for the nine yards lost on two sacks. That is why the two numbers can appear different while both are correct within their respective statistical categories. (ESPN)
Minnesota Vikings vs Dallas Cowboys Match Player Stats: Quarterback Performance
Quarterback play was one of the clearest differences between the teams.
J.J. McCarthy
J.J. McCarthy delivered one of his more efficient performances of the season.
His final passing line was:
- 15 completions
- 24 attempts
- 250 passing yards
- 2 passing touchdowns
- 1 interception
- 10.4 yards per attempt
- 108.0 passer rating
- 4 rushing attempts
- 15 rushing yards
- 1 rushing touchdown
McCarthy completed 62.5% of his passes and averaged 10.4 yards per attempt. That combination is especially important because Minnesota did not need a high-volume passing attack to move the ball.
His first pass of the game was intercepted after a tipped ball eventually landed with Quinnen Williams. Instead of allowing that mistake to control the game, McCarthy responded by producing three touchdowns through the air and on the ground combined.
His rushing touchdown came on a fourth-and-goal bootleg in the second quarter. The play gave Minnesota a 14-14 tie and showed the value of using quarterback mobility near the goal line.
McCarthy also connected with Jalen Nailor twice for touchdowns. The second scoring pass, a four-yard completion early in the fourth quarter, gave Minnesota a 31-23 advantage.
ESPN’s recap noted that McCarthy had become increasingly comfortable as a starter, and his performance against Dallas reflected that development. (ESPN)
Dak Prescott
Dak Prescott produced considerably more passing volume.
His individual line:
- 23 completions
- 38 attempts
- 294 passing yards
- 0 touchdowns
- 0 interceptions
- 7.7 yards per attempt
- 84.8 passer rating
Prescott completed 60.5% of his passes and generated 294 passing yards. On paper, those numbers look productive, but the lack of touchdown passes was critical.
Dallas repeatedly moved the ball but struggled to turn those possessions into touchdowns. The Cowboys finished 2-for-5 in the red zone, while Minnesota went 3-for-4. (ESPN)
That difference helps explain why Dallas could gain 423 total yards and still lose by eight points.
The game also represented a rare situation for Prescott during the season because he finished without a touchdown pass. ESPN’s recap reported that this was only the third game of the season in which he had failed to throw a touchdown. (ESPN)
Passing Comparison and Efficiency
The raw passing totals favor Dallas, but efficiency favors Minnesota.
Minnesota attempted only 24 passes and produced 250 passing yards. Dallas attempted 38 passes and generated 285 team passing yards after sack yardage.
That means Minnesota produced more yards per passing attempt while using significantly fewer attempts.
The contrast is important:
Minnesota
- 24 attempts
- 250 passing yards
- 10.4 yards per attempt
- 2 passing touchdowns
- 1 interception
Dallas
- 38 attempts
- 285 net team passing yards
- 7.1 net yards per attempt
- 0 passing touchdowns
- 0 interceptions
The Vikings were more explosive when they passed the ball. Dallas was more dependent on sustained drives.
This is one of the strongest examples of why total yardage should not be treated as the only measure of offensive performance.
Minnesota Vikings Rushing Performance
Minnesota’s running game was not statistically dominant.
The Vikings carried the ball 28 times for only 77 yards, an average of 2.8 yards per attempt. Yet the rushing attack still contributed two touchdowns.
Aaron Jones Sr.
Aaron Jones Sr. led Minnesota in rushing attempts.
He recorded:
- 12 carries
- 34 yards
- 2.8 yards per carry
- 16-yard long
Jones did not have a big rushing day, but his importance extended beyond his average.
Late in the game, he converted a fourth-and-one situation with a four-yard run. He also had a significant 16-yard run that became part of a crucial late Minnesota possession.
That drive eventually ended with Will Reichard’s 53-yard field goal.
Jordan Mason
Jordan Mason added:
- 10 carries
- 29 yards
- 2.9 yards per carry
- 9-yard long
Mason and Jones combined for 63 rushing yards, but Minnesota found other ways to create scoring opportunities.
J.J. McCarthy
McCarthy’s four rushing attempts produced 15 yards and one touchdown.
His rushing touchdown was especially valuable because it came on fourth down near the goal line.
C.J. Ham
C.J. Ham had just one rushing attempt.
It was enough to matter.
Ham carried the ball one yard for a touchdown in the third quarter, giving Minnesota a 24-23 lead.
That play became one of the game’s turning points.
Dallas Cowboys Rushing Performance
Dallas had a much stronger rushing statistical profile.
The Cowboys recorded:
- 29 carries
- 138 yards
- 4.8 yards per carry
- 2 rushing touchdowns
Javonte Williams
Javonte Williams was Dallas’ leading rusher.
He recorded:
- 15 carries
- 91 yards
- 6.1 yards per carry
- 21-yard long
- 1 touchdown
Williams averaged more than twice as many rushing yards per carry as Minnesota’s leading runner, Aaron Jones.
His 91 rushing yards were a major reason Dallas finished with 138 rushing yards.
However, Dallas could not consistently translate that ground production into touchdowns.
Malik Davis
Malik Davis finished with:
- 8 carries
- 21 yards
- 2.6 yards per carry
- 1 touchdown
His one-yard touchdown run gave Dallas a 14-7 advantage early in the second quarter.
Overall Rushing Difference
Dallas outgained Minnesota on the ground by 61 yards.
That is a substantial advantage.
Yet Minnesota controlled the scoreboard because the Vikings were more effective in other phases.
This is an important lesson when studying Minnesota Vikings vs Dallas Cowboys Match Player Stats: the team with the better individual or team rushing numbers does not automatically have the better overall offensive performance.
Minnesota Receiving Leaders
Minnesota’s receiving production was concentrated but highly efficient.
Jordan Addison
Jordan Addison recorded:
- 2 receptions
- 66 yards
- 33.0 yards per reception
- 58-yard long
His 58-yard reception was one of Minnesota’s most explosive offensive plays.
With only two catches, Addison still tied for the team’s receiving-yard lead.
That illustrates how a small number of explosive plays can dramatically influence an NFL game.
T.J. Hockenson
T.J. Hockenson had:
- 4 receptions
- 66 yards
- 16.5 yards per reception
- 29-yard long
Hockenson was one of McCarthy’s most productive targets and helped provide consistent intermediate-yardage production.
Jalen Nailor
Jalen Nailor was arguably Minnesota’s most important receiver in terms of scoring impact.
He finished with:
- 3 receptions
- 47 yards
- 15.7 yards per reception
- 2 touchdowns
- 23-yard long
Both of his touchdowns came from McCarthy.
His first touchdown was a 20-yard reception in the first quarter.
His second was a four-yard touchdown reception early in the fourth quarter.
Those two plays accounted for 12 of Minnesota’s 34 points when extra points are included.
Dallas Cowboys Receiving Leaders
CeeDee Lamb
CeeDee Lamb was the standout receiver for Dallas.
His final numbers:
- 6 receptions
- 111 yards
- 18.5 yards per reception
- 30-yard long
- 10 targets
Lamb produced more than 100 receiving yards and was clearly Prescott’s most productive target.
However, his strong yardage total did not result in a receiving touchdown.
That was a recurring theme for Dallas throughout the game. The Cowboys moved the ball between the 20-yard lines but struggled to finish drives.
Other Dallas Receivers
Ryan Flournoy recorded four receptions for 40 yards.
George Pickens added three receptions for 33 yards.
Luke Schoonmaker had one catch for 29 yards.
Jonathan Mingo recorded one reception for 25 yards.
Malik Davis caught two passes for 16 yards.
Jake Ferguson caught two passes for 16 yards.
KaVontae Turpin added two receptions for 10 yards.
The Cowboys finished with 23 receptions for 294 combined receiving yards according to the receiving table, while their team passing statistic was 285 net yards after sacks. (ESPN)
Defensive Player Stats and Game-Changing Plays
The defensive numbers tell an interesting story because Dallas finished with more total offensive production but Minnesota created several critical defensive moments.
Minnesota recorded:
- 78 total tackles
- 36 solo tackles
- 2 sacks
- 11 pass deflections
Dallas recorded:
- 58 total tackles
- 31 solo tackles
- 0 sacks
- 3 pass deflections
- 1 interception
The Vikings were particularly effective at disrupting passing lanes.
Eleven pass deflections is a significant number and helps explain why Dallas could not consistently convert its offensive opportunities into touchdowns.
Quinnen Williams’ Interception
Quinnen Williams produced Dallas’ only interception.
The play came on McCarthy’s first pass of the game after the ball was tipped and ended up in Williams’ hands.
That turnover gave Dallas an early opportunity to seize control.
However, Minnesota’s offense recovered from the mistake.
That response is one of the most important parts of evaluating McCarthy’s performance. The quarterback did not allow the early interception to lead to a collapse.
Third Down and Fourth Down Efficiency
The third-down numbers were surprisingly poor for both teams.
Minnesota converted only 2 of 9 third downs.
Dallas converted only 2 of 12.
Neither offense consistently dominated traditional money downs.
The difference came on fourth down.
Minnesota converted 3 of 3 fourth-down opportunities.
Dallas converted 3 of 4.
That gave Minnesota a perfect fourth-down record and helped extend important drives.
The Vikings also converted in the red zone more effectively.
Minnesota went 3-for-4 in the red zone.
Dallas went 2-for-5.
That five-attempt red-zone sample is especially revealing because Dallas reached scoring territory often enough to produce more touchdowns than it did.
Red-Zone Execution Decided the Game
The final score becomes easier to understand when red-zone performance is placed at the center of the analysis.
Dallas scored touchdowns on two rushing plays.
Minnesota scored:
- Two passing touchdowns to Jalen Nailor
- One rushing touchdown by J.J. McCarthy
- One rushing touchdown by C.J. Ham
Minnesota therefore generated four touchdowns compared with Dallas’ two.
Dallas compensated with four Brandon Aubrey field goals.
This produced a critical difference in scoring efficiency.
Field goals kept Dallas competitive, but Minnesota’s touchdowns created separation.
The Vikings’ fourth-quarter touchdown from Nailor increased the margin to eight points, and Reichard’s 53-yard field goal later pushed the lead to 11.
Special Teams Player Stats
Special teams played a meaningful supporting role.
Will Reichard
Minnesota kicker Will Reichard finished:
- 2-for-2 on field goals
- Long field goal: 53 yards
- 4-for-4 on extra points
- 10 total points
His 53-yard field goal with 1:08 remaining was particularly important.
It gave Minnesota a 34-23 lead and effectively forced Dallas to need multiple scoring events to catch up.
Brandon Aubrey
Dallas kicker Brandon Aubrey finished:
- 4-for-6 on field goals
- Long: 41 yards
- 2-for-2 extra points
- 14 total points
Aubrey’s four made field goals accounted for a significant portion of Dallas’ scoring.
However, he missed attempts from 51 and 59 yards.
ESPN’s recap noted that it was the first time in Aubrey’s three seasons that he had missed multiple field goals at home. (ESPN)
Kick Returns
Myles Price handled six Minnesota kick returns for 143 yards, averaging 23.8 yards per return with a 32-yard long.
KaVontae Turpin returned four kicks for Dallas for 124 yards, averaging 31.0 yards per return with a 40-yard long.
Turpin’s return average was particularly strong, but Minnesota still managed to control the final result.
Time of Possession and Total Yardage
Dallas had the statistical advantage in several traditional categories.
The Cowboys produced:
- 423 total yards
- 25 first downs
- 32:36 possession
Minnesota produced:
- 327 total yards
- 21 first downs
- 27:24 possession
At first glance, those numbers suggest Dallas should have won.
But football is ultimately about scoring efficiently rather than accumulating yardage alone.
Minnesota scored 34 points with 327 yards.
Dallas scored 26 points with 423 yards.
That means Minnesota extracted considerably more scoring value from each offensive opportunity.
The Vikings also committed one turnover compared with none for Dallas, which makes their victory even more notable.
Why Minnesota Won Despite Being Outgained
There are four major reasons.
1. Minnesota scored more touchdowns
The Vikings scored four touchdowns.
Dallas scored two.
That was the largest difference in scoring efficiency.
2. Minnesota was better in the red zone
Minnesota converted 3 of 4 red-zone trips.
Dallas converted only 2 of 5.
Three extra red-zone possessions without touchdowns can make a major difference in a close NFL game.
3. Minnesota generated explosive passing plays
McCarthy averaged 10.4 yards per attempt.
Addison’s 58-yard reception and Nailor’s touchdown catches helped Minnesota create large chunks of yardage without needing long drives on every possession.
4. Minnesota made the key fourth-quarter plays
The Vikings entered the fourth quarter ahead 24-23.
Nailor’s touchdown increased the lead to 31-23.
Reichard then hit a 53-yard field goal.
Dallas never produced the late touchdown it needed.
Fourth-Quarter Breakdown
The fourth quarter is where the game tilted decisively toward Minnesota.
At the beginning of the quarter, Minnesota led 24-23.
Then McCarthy connected with Nailor for a four-yard touchdown.
The extra point made it 31-23.
Dallas needed a response.
Instead, Minnesota eventually produced another scoring drive that ended with Reichard’s 53-yard field goal.
Dallas did add a late field goal to make it 34-26 with 19 seconds remaining.
The Cowboys recovered neither the momentum nor the possession needed to complete the comeback.
Josh Oliver recovered Dallas’ onside kick attempt, ending the final realistic opportunity.
ESPN’s play-by-play confirms the late sequence and the final scoring margin. (ESPN)
What the Player Stats Reveal About J.J. McCarthy
McCarthy’s 250 passing yards are useful, but his efficiency is more revealing.
He averaged 10.4 yards per attempt and finished with three total touchdowns.
The interception is the obvious negative.
However, his ability to recover after that early mistake was arguably more important than the mistake itself.
He also avoided being sacked.
That matters because Dallas finished with no sacks against Minnesota’s quarterback.
McCarthy was able to operate without constant negative plays and made enough explosive throws to punish Dallas.
His performance was not perfect, but it was productive, efficient and decisive when scoring opportunities appeared.
What the Player Stats Reveal About Dak Prescott
Prescott’s 294 passing yards show that Dallas’ passing game was capable of producing.
The issue was not a complete inability to move the ball.
The issue was finishing drives.
Prescott completed 23 passes and surpassed 290 individual passing yards, but he did not throw a touchdown.
Dallas also lost nine passing yards through two sacks, which lowered its official team passing total to 285.
The Cowboys had 12 passing first downs and 25 total first downs, demonstrating that Prescott and the offense moved the chains.
The biggest problem was converting that production into seven-point possessions.
Minnesota Vikings vs Dallas Cowboys Match Player Stats: The Most Important Numbers
Several statistics deserve more attention than the headline passing totals.
34-26
The final score shows Minnesota’s eight-point victory.
4-2
Minnesota’s four touchdowns compared with Dallas’ two touchdowns.
3-for-4
Minnesota’s red-zone efficiency.
2-for-5
Dallas’ red-zone efficiency.
11
Minnesota’s total pass deflections.
2
Minnesota sacks.
0
Dallas sacks.
10.4
McCarthy’s yards per pass attempt.
18.5
CeeDee Lamb’s yards per reception.
53
Reichard’s game-clinching field-goal distance.
423-327
Dallas’ advantage in total yardage.
This final comparison is particularly important because it demonstrates why a box score should be interpreted rather than simply repeated.
Key Matchup: Jalen Nailor vs the Dallas Secondary
Jalen Nailor finished with only three receptions.
Yet two of those catches were touchdowns.
That is the definition of high-impact production.
- His first touchdown came on a 20-yard pass.
- His second came on a four-yard pass.
- His overall 47 receiving yards were modest compared with CeeDee Lamb’s 111, but Nailor had the more direct influence on the scoreboard.
This is a useful reminder that receiving yards and fantasy-style totals do not always identify the player who influenced the outcome most.
Key Matchup: CeeDee Lamb vs Minnesota’s Coverage
Lamb was Dallas’ most productive receiver by a wide margin.
He caught six passes for 111 yards on 10 targets.
His 18.5 yards per reception showed that Dallas was able to create explosive receiving plays.
But Minnesota’s defense repeatedly forced Dallas into difficult scoring situations.
The Vikings finished with 11 pass deflections and held Prescott without a touchdown pass.
So while Lamb won the individual yardage battle, Minnesota won the broader passing-game battle.
Injuries That Affected the Game
The game also included several injury developments.
For Minnesota, defensive lineman Javon Hargrave exited with a groin injury and was ruled out. Offensive tackle Brian O’Neill also suffered an ankle injury.
For Dallas, Javonte Williams was ruled out in the second half with a concussion. Backup left tackle Nate Thomas suffered a shoulder injury, while fullback Hunter Luepke was ruled out with a concussion after a kickoff coverage play. (ESPN)
These details matter when interpreting individual performances because injuries can change personnel packages, blocking combinations and play-calling during a game.
The Biggest Statistical Lessons From the Game
The matchup provides several useful lessons for anyone analyzing NFL player statistics.
Yardage does not equal scoring efficiency
Dallas gained 96 more total yards than Minnesota.
Dallas still lost by eight points.
Touchdowns matter more than field-goal volume
Dallas made four field goals.
Minnesota scored four touchdowns.
The Vikings’ touchdown efficiency created the winning margin.
Explosive plays can overcome limited volume
Minnesota threw only 24 passes.
Yet the team produced 250 passing yards.
Addison’s 58-yard catch was a major contributor.
Red-zone efficiency can outweigh possession
Dallas held the ball for more than 32 minutes.
Minnesota held it for less than 28.
The Vikings still won because they converted more of their scoring opportunities.
Quarterback evaluation requires context
McCarthy had an interception.
Prescott did not.
Yet McCarthy produced three total touchdowns while Prescott produced none.
A single turnover statistic cannot tell the complete story.
How to Read These Player Stats Correctly
If you are using this box score for fantasy football analysis, historical research, team evaluation or an NFL statistics article, avoid looking at only one category.
A better process is:
- Check passing efficiency.
- Check rushing efficiency.
- Check receiving volume and explosiveness.
- Compare red-zone production.
- Review turnovers.
- Examine third- and fourth-down performance.
- Look at defensive disruption.
- Review special teams.
- Consider injuries.
- Compare production with the final score.
This method produces a much more accurate picture of what actually happened.
Frequently Asked Questions
Who won the Minnesota Vikings vs Dallas Cowboys game?
The Minnesota Vikings defeated the Dallas Cowboys 34-26 at Dallas. ESPN’s official game record confirms the final score. (ESPN)
How many passing yards did J.J. McCarthy have?
J.J. McCarthy completed 15 of 24 passes for 250 yards, two touchdowns and one interception.
How many passing yards did Dak Prescott have?
Dak Prescott completed 23 of 38 passes for 294 individual passing yards, with no touchdowns and no interceptions. Dallas recorded 285 net team passing yards after sack yardage.
Who was Minnesota’s leading receiver?
Jordan Addison and T.J. Hockenson each recorded 66 receiving yards. Addison did it on two receptions, including a 58-yard catch.
Who led the Cowboys in receiving?
CeeDee Lamb led Dallas with six receptions for 111 yards on 10 targets.
Why did Minnesota win despite Dallas having more total yards?
Minnesota was more efficient in scoring situations. The Vikings scored four touchdowns and converted 3 of 4 red-zone opportunities, while Dallas scored two touchdowns and went 2-for-5 in the red zone. (ESPN)
Conclusion
The Minnesota Vikings vs Dallas Cowboys Match Player Stats show why the final score cannot be understood through total yardage alone.
Dallas dominated several statistical categories, including total yards, rushing yards, first downs and time of possession. CeeDee Lamb produced 111 receiving yards, Javonte Williams rushed for 91 yards, and Dak Prescott passed for 294 individual yards.
Minnesota, however, was more effective when opportunities mattered most.
J.J. McCarthy produced 250 passing yards, two passing touchdowns and a rushing touchdown. Jalen Nailor scored twice through the air. Jordan Addison created a 58-yard explosive play. The Vikings converted all three of their fourth-down attempts and scored touchdowns on three of four red-zone trips.
Defensively, Minnesota recorded two sacks and 11 pass deflections while holding Dallas without a passing touchdown.
The result was an eight-point road victory despite a 96-yard disadvantage in total offense.
For anyone studying Minnesota Vikings vs Dallas Cowboys Match Player Stats, the central takeaway is simple: Dallas produced more volume, but Minnesota produced more scoring efficiency. That difference decided the game.