LA Clippers vs San Antonio Spurs Match Player Stats
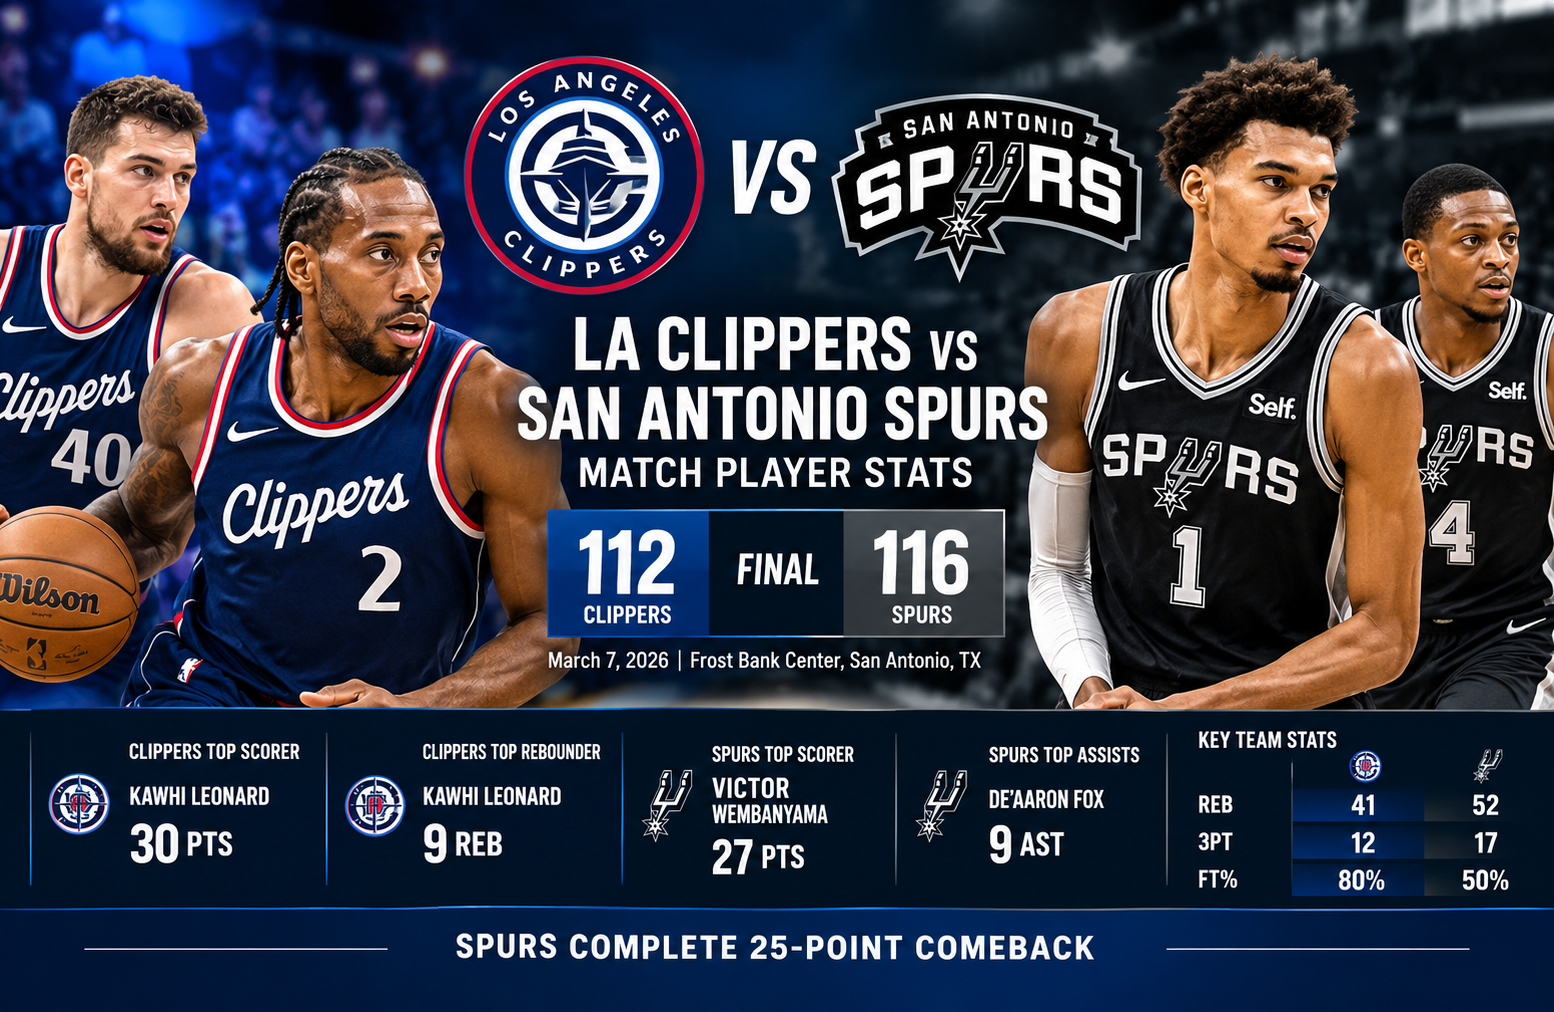
The la clippers vs san antonio spurs match player stats from this matchup tell the story of one of the most dramatic comebacks of the 2025-26 NBA season. San Antonio defeated Los Angeles 116-112 at Frost Bank Center after falling behind by as many as 25 points. The Clippers controlled the game for long stretches, but the Spurs completely changed the momentum after halftime and closed the contest with a dominant fourth-quarter response.
Kawhi Leonard led Los Angeles with 30 points and 9 rebounds, while Brook Lopez added 26 points. For San Antonio, Victor Wembanyama produced 27 points, 10 rebounds, and 4 blocks, while De’Aaron Fox finished with 19 points and 9 assists. Julian Champagnie also made an important contribution with 20 points and 9 rebounds.
The final score was close, but the game itself was anything but ordinary. Los Angeles led 66-46 at halftime and reached a 25-point advantage in the third quarter. San Antonio then turned the game around with defensive pressure, improved three-point shooting, second-chance opportunities, and late-game execution.
For anyone studying the la clippers vs san antonio spurs match player stats, the most important lesson is that the box score cannot be understood properly by looking only at the final score. The Clippers were more efficient from the free-throw line and committed fewer turnovers, yet San Antonio won because its size, rebounding, three-point production, and fourth-quarter execution eventually overwhelmed Los Angeles.
Game Overview
The matchup took place at Frost Bank Center in San Antonio. Official NBA records list the game as a March 6, 2026 contest in San Antonio, while some date displays can show March 7 because of the time conversion. The attendance was 18,711.
San Antonio entered the game with a 46-17 record and a remarkable 23-6 home record. Los Angeles came in at 30-32 overall and 14-19 on the road.
The Spurs ultimately won 116-112.
Final Score
| Team | Q1 | Q2 | Q3 | Q4 | Final |
| LA Clippers | 32 | 34 | 26 | 20 | 112 |
| San Antonio Spurs | 25 | 21 | 35 | 35 | 116 |
The quarter-by-quarter numbers explain the entire contest.
Los Angeles outscored San Antonio 66-46 during the opening half. The Clippers then scored 26 points in the third quarter while San Antonio answered with 35. In the fourth quarter, the Spurs completed the turnaround by winning the period 35-20.
That means San Antonio erased a 20-point halftime deficit and finished the game with a four-point victory.
LA Clippers vs San Antonio Spurs Match Player Stats
The individual numbers show how different the two teams approached the game.
Kawhi Leonard was the Clippers’ leading scorer with 30 points. He shot 10-for-20 from the field and 9-for-10 from the free-throw line. He also collected 9 rebounds and 3 steals.
Brook Lopez was the other major offensive force for Los Angeles. He scored 26 points on 11-for-19 shooting, including 4-for-8 from three-point range.
For San Antonio, Wembanyama delivered an all-around performance that went well beyond scoring. He finished with 27 points, 10 rebounds, 4 blocks, and 1 steal while shooting 11-for-21 from the field.
De’Aaron Fox contributed 19 points and 9 assists. Julian Champagnie added 20 points and 9 rebounds while shooting 5-for-8 from three-point range.
Leading Clippers Players
| Player | PTS | REB | AST | STL | BLK | FG |
| Kawhi Leonard | 30 | 9 | 3 | 3 | 0 | 10-20 |
| Brook Lopez | 26 | 6 | 2 | 4 | 0 | 11-19 |
| Derrick Jones Jr. | 12 | 3 | 2 | 0 | 2 | 4-12 |
| Jordan Miller | 11 | 2 | 6 | 1 | 0 | 4-6 |
| Kobe Sanders | 10 | 4 | 1 | 2 | 0 | 4-7 |
| Bennedict Mathurin | 8 | 3 | 1 | 0 | 1 | 3-12 |
Leonard’s 30-point performance was especially important because he carried much of the Clippers’ half-court scoring responsibility.
Lopez’s 26 points were equally significant. His shooting provided Los Angeles with a second reliable scoring option, particularly from inside the arc and from three-point range.
Jordan Miller’s 6 assists also deserve attention. His passing helped Los Angeles move the ball effectively during its strongest stretches.
Leading Spurs Players
| Player | PTS | REB | AST | STL | BLK | FG |
| Victor Wembanyama | 27 | 10 | 1 | 1 | 4 | 11-21 |
| Julian Champagnie | 20 | 9 | 1 | 0 | 0 | 6-10 |
| De’Aaron Fox | 19 | 2 | 9 | 1 | 0 | 9-18 |
| Devin Vassell | 11 | 4 | 3 | 1 | 0 | 4-13 |
| Keldon Johnson | 10 | 6 | 0 | 0 | 0 | 4-9 |
| Carter Bryant | 10 | 7 | 2 | 0 | 1 | 5-9 |
Wembanyama was the central figure in the comeback. His scoring gave San Antonio a reliable offensive outlet, while his four blocks affected the Clippers’ decisions around the basket.
Fox’s 9 assists were also critical. His ability to create shots for teammates helped San Antonio generate better offensive possessions as the game progressed.
Kawhi Leonard’s 30-Point Performance
Kawhi Leonard was the Clippers’ most productive player from start to finish.
He finished with:
- 30 points
- 9 rebounds
- 3 assists
- 3 steals
- 10-for-20 shooting
- 1-for-6 from three-point range
- 9-for-10 free throws
The most notable part of his performance was his efficiency inside the arc and at the free-throw line. Leonard converted 50 percent of his field-goal attempts and 90 percent of his free throws.
His three-point shooting, however, was less effective. He made only 1 of 6 attempts from deep.
That distinction matters because San Antonio eventually made the Clippers work harder for clean perimeter opportunities. Leonard was still able to score efficiently overall, but the Spurs reduced the impact of his outside shooting.
Leonard also contributed 9 rebounds, giving the Clippers a strong presence on both ends of the floor.
His 3 steals were another sign of his defensive activity.
Brook Lopez Gives the Clippers a Major Scoring Boost
Brook Lopez was one of the biggest offensive positives for Los Angeles.
He scored 26 points while shooting 11-for-19 from the field. He also made 4 of his 8 three-point attempts.
That combination made Lopez difficult to defend. A center who can score efficiently around the basket while also stretching the floor creates significant problems for a defense built around interior size.
Lopez scored 9 points in the opening quarter, helping Los Angeles establish early control.
His performance also shows why the Clippers were able to build such a large lead. They did not depend entirely on Leonard. Lopez provided a second high-volume scoring source who could punish San Antonio both inside and outside.
However, San Antonio eventually found ways to generate more possessions and control the glass, reducing the value of Los Angeles’ shooting efficiency.
Victor Wembanyama Controls the Second Half
Wembanyama’s final numbers were impressive, but the context makes his performance even more significant.
He finished with 27 points, 10 rebounds, 4 blocks, and 1 steal.
His 11-for-21 shooting produced a 52.4 percent field-goal rate. He also made 4 of 9 three-point attempts, giving San Antonio valuable spacing from its biggest offensive player.
The 4 blocks were particularly important.
Los Angeles had several players capable of attacking the paint, but Wembanyama’s length gave San Antonio a defensive safety net. His presence changed the geometry of the floor because Clippers players had to account for him before committing fully to drives.
His defensive influence was not limited to official blocks. A player with his reach can alter shots simply by being near the play.
The fourth quarter provided the clearest example of his impact. Late in the game, Wembanyama defended a missed Leonard three-pointer, then found an opening in transition and scored the basket that gave San Antonio a 113-112 lead with 16 seconds remaining.
That possession effectively became the defining moment of the game.
De’Aaron Fox’s Playmaking Was Crucial
De’Aaron Fox finished with 19 points and 9 assists.
His scoring was useful, but his playmaking may have been even more important.
San Antonio needed to create offense after trailing by a large margin. Fox helped the Spurs move the ball and generate opportunities for Wembanyama, Champagnie, Vassell, and other shooters.
His 9 assists were the highest total on either team.
Fox also shot 9-for-18 from the field, giving San Antonio another efficient scoring option next to Wembanyama.
This combination of scoring and playmaking made it harder for Los Angeles to focus its defensive attention on Wembanyama.
Julian Champagnie Provides a Major Shooting Threat
Julian Champagnie quietly delivered one of San Antonio’s most important performances.
He scored 20 points and grabbed 9 rebounds.
More importantly, he shot 5-for-8 from three-point range.
That is a 62.5 percent three-point rate for the game.
Champagnie’s shooting forced the Clippers to respect the perimeter. When San Antonio’s outside shots started falling, the Spurs could create more space for drives and interior opportunities.
His 9 rebounds also added value beyond scoring.
A 20-point, 9-rebound performance from a player who made five threes is exactly the type of complementary production a team needs during a comeback.
Team Shooting Comparison
The team shooting numbers provide an interesting contrast.
| Category | Clippers | Spurs |
| Field Goals | 42-86 | 46-95 |
| FG Percentage | 49% | 48% |
| Three-Pointers | 12-33 | 17-41 |
| 3PT Percentage | 36% | 41% |
| Free Throws | 16-20 | 7-14 |
| FT Percentage | 80% | 50% |
At first glance, the Clippers appear to have been the more efficient team.
Los Angeles shot 49 percent from the field compared with San Antonio’s 48 percent. The Clippers also shot 80 percent from the free-throw line compared with 50 percent for the Spurs.
Yet San Antonio made five more three-pointers.
That is a major difference.
The Spurs attempted eight more threes and made five more. Those additional three-point makes produced a 15-point advantage from beyond the arc.
This was one of the biggest statistical reasons San Antonio was able to overcome its poor free-throw shooting.
The Rebounding Battle Changed the Game
One of the clearest differences in the box score was rebounding.
San Antonio grabbed 52 rebounds.
Los Angeles collected 41.
That gave the Spurs an 11-rebound advantage.
The difference becomes even more important when offensive rebounds are considered.
San Antonio recorded 15 offensive rebounds compared with 7 for Los Angeles.
That means the Spurs generated eight more offensive-rebound opportunities.
Second-chance possessions are especially valuable in comeback situations. A team that misses a shot but recovers the ball can extend the possession, force the defense to scramble again, and create another scoring opportunity.
San Antonio repeatedly benefited from this type of possession.
The Clippers shot the ball well, but shooting efficiency alone could not compensate for the Spurs’ control of the glass.
The Fourth Quarter Decided Everything
The fourth quarter was the most important statistical segment of the game.
San Antonio outscored Los Angeles 35-20.
That 15-point difference turned a game the Clippers appeared to control into a Spurs victory.
The comeback did not happen through one factor alone.
Instead, several things changed simultaneously:
- San Antonio increased its defensive pressure.
- The Spurs generated more second-chance opportunities.
- Their three-point shooting remained dangerous.
- Wembanyama became increasingly influential around the rim.
- Fox continued creating opportunities for teammates.
- Los Angeles struggled to maintain its earlier offensive rhythm.
This is why quarter-by-quarter analysis is essential when studying the la clippers vs san antonio spurs match player stats.
A final box score can make a four-point game look competitive throughout. It was not.
Los Angeles had a 20-point halftime advantage and eventually reached a 25-point lead. San Antonio had to produce a sustained comeback rather than simply win a close fourth quarter.
How the Spurs Overcame a 25-Point Deficit
The most remarkable feature of this matchup was San Antonio’s comeback.
The Spurs trailed 75-50 during the third quarter.
Instead of allowing the game to get away, San Antonio responded with a major run to begin the fourth quarter.
The comeback was built around defensive stops and transition opportunities.
One especially important sequence involved Wembanyama blocking a Kris Dunn attempt near the basket. The Spurs then converted the defensive play into an alley-oop dunk by Carter Bryant.
That type of sequence can change an entire game.
A defensive block became a fast-break opportunity, which became points.
The Spurs then continued to attack.
Devin Vassell’s three-pointer helped San Antonio take a 99-97 lead. That was the first time the Spurs had moved ahead since the early portion of the game.
From that point, the game became a possession-by-possession contest.
Clippers Had Better Free-Throw Efficiency
Los Angeles made 16 of 20 free throws.
San Antonio made only 7 of 14.
That is a significant difference in efficiency.
The Clippers converted 80 percent of their attempts, while the Spurs made only half.
If a team wins a game despite shooting 50 percent at the line, another part of the box score usually explains how it survived.
Here, that explanation comes from three-point shooting and rebounding.
San Antonio’s 17 made threes and 15 offensive rebounds helped offset the free-throw disadvantage.
This is a useful reminder when evaluating NBA statistics: individual percentages should not be viewed independently.
Clippers Won the Turnover Battle
Los Angeles also had an advantage in turnovers.
The supplied team statistics show 9 Clippers turnovers compared with 12 for San Antonio.
ESPN’s team-stat presentation lists total turnovers at 10 for Los Angeles and 13 for San Antonio when team turnover accounting is included.
Either way, the basic conclusion remains the same: Los Angeles protected the ball better.
That makes the defeat more interesting.
The Clippers did several things well:
- Better free-throw shooting
- Fewer turnovers
- Better overall field-goal percentage
- Strong scoring from Leonard and Lopez
- 12 steals
Yet San Antonio still won.
The Spurs compensated through rebounding, three-point volume, interior defense, and late-game execution.
Defensive Statistics Tell an Important Story
San Antonio finished with 7 blocks.
Los Angeles recorded 3.
The difference was largely driven by Wembanyama, who recorded 4 blocks himself.
The Spurs also collected 6 steals.
Los Angeles had 12 steals, so the Clippers actually produced more takeaways.
Again, the defensive story is not simply that one team was better in every category.
Los Angeles was more disruptive in passing lanes, while San Antonio was stronger around the basket.
Those are different forms of defense.
The Spurs’ rim protection became increasingly valuable as the game progressed because it helped discourage direct attacks and gave San Antonio additional opportunities to run after defensive stops.
Plus/Minus Leaders
Plus/minus is not a perfect individual statistic, but it can help identify which lineups controlled the scoreboard during a particular game.
For San Antonio, Keldon Johnson finished with the best plus/minus at +11.
For Los Angeles, Derrick Jones Jr. led the Clippers at +3.
Interestingly, neither player was the leading scorer for his team.
That is a useful reminder that winning basketball impact cannot always be measured by points.
Johnson scored 10 points, grabbed 6 rebounds, and finished +11.
Jones Jr. scored 12 points, collected 3 rebounds, added 2 assists and 2 blocks, and finished +3.
Their contributions came within the context of different lineups and game situations.
What the Player Stats Say About the Clippers
The Clippers’ statistical profile suggests a team that had enough offensive quality to control the game but struggled to protect its advantage.
Leonard and Lopez combined for 56 points.
That is exactly the type of production a team needs from its leading scorers.
Los Angeles also shot 49 percent overall and 80 percent at the line.
The problem was not simply offensive inefficiency.
The larger issue was sustaining control.
The Clippers lost the rebounding battle by 11, gave up 15 offensive rebounds, and allowed San Antonio to make 17 threes.
When a team builds a large lead, defensive rebounding becomes particularly important because every missed Spurs shot that turned into another possession gave San Antonio another opportunity to cut into the deficit.
The Clippers did not do enough to close those possessions.
What the Player Stats Say About the Spurs
San Antonio’s numbers show a team that could win through multiple pathways.
Wembanyama supplied scoring, rebounding, rim protection, and spacing.
Fox supplied playmaking.
Champagnie provided elite three-point shooting for the night.
Johnson and Bryant contributed off the bench.
The Spurs also won the rebounding battle and generated 15 offensive boards.
This balance mattered.
Los Angeles could not simply focus on Wembanyama because Fox was capable of creating shots and Champagnie was hitting threes.
The Clippers therefore faced a difficult defensive choice.
Help too much on Wembanyama and open shooters could punish the defense.
Stay attached to shooters and Wembanyama could attack the interior.
That balance is one of the clearest tactical explanations for the comeback.
A Closer Look at the Three-Point Battle
The three-point numbers deserve special attention.
Los Angeles:
- 12 made
- 33 attempts
- 36 percent
San Antonio:
- 17 made
- 41 attempts
- 41 percent
The Spurs made five more threes.
At three points per make, that represents a 15-point difference.
This almost completely explains why San Antonio could overcome the Clippers’ advantages in free-throw shooting and field-goal percentage.
The Spurs also attempted eight more threes.
That shows a difference not only in accuracy but also in offensive volume.
San Antonio consistently looked for perimeter opportunities.
Champagnie was particularly effective, while Wembanyama also connected on four threes.
The Importance of Offensive Rebounding
San Antonio’s 15 offensive rebounds were perhaps the most underrated number in the entire box score.
Consider the game situation.
The Spurs were down by 20 at halftime and later fell 25 points behind.
Every extra possession mattered.
An offensive rebound gives a team another chance to score without requiring a defensive stop.
It also prevents the opponent from starting a transition possession.
That creates a two-sided benefit.
The Spurs gained another scoring opportunity while simultaneously denying Los Angeles the opportunity to push the ball.
The Clippers had only 7 offensive rebounds.
That eight-rebound difference gave San Antonio a steady supply of additional possessions during the comeback.
Why the Final Four Points Do Not Tell the Full Story
A 116-112 final score might suggest a tightly contested game.
The quarter scores show something very different.
Los Angeles won the first quarter by 7.
The Clippers won the second quarter by 13.
San Antonio then won the third by 9 and the fourth by 15.
The game was therefore divided into two very different phases.
Phase One: Clippers Control
Los Angeles established a strong offensive rhythm.
Leonard and Lopez scored efficiently.
The Clippers moved the ball well enough to build a substantial advantage.
Phase Two: Spurs Respond
San Antonio changed the game after halftime.
The Spurs increased their pressure, controlled the offensive glass, created transition chances, and improved their perimeter production.
By the final possessions, the earlier Clippers advantage had completely disappeared.
Most Important Statistical Takeaways
The key numbers from this matchup can be summarized in several points.
1. Wembanyama was the defensive difference-maker
His 27 points were important, but his 10 rebounds and 4 blocks were equally significant.
2. Leonard was the Clippers’ offensive leader
His 30 points and 9 rebounds kept Los Angeles competitive even after San Antonio’s comeback began.
3. Lopez delivered major secondary scoring
His 26 points on 11-for-19 shooting gave Los Angeles a strong second scoring option.
4. San Antonio won the glass
The Spurs collected 52 rebounds to the Clippers’ 41.
5. Three-point shooting favored San Antonio
The Spurs made 17 threes compared with 12 for Los Angeles.
6. Offensive rebounding favored San Antonio
The Spurs grabbed 15 offensive rebounds compared with 7 for the Clippers.
7. Fourth-quarter execution decided the result
San Antonio scored 35 points in the final period while limiting Los Angeles to 20.
What This Matchup Reveals About Both Teams
The game provides a useful case study in how NBA games can change even when one team appears to be in complete control.
The Clippers demonstrated that they could generate efficient half-court offense. Leonard and Lopez were highly productive, and the team shot 49 percent from the field.
But San Antonio showed that its size and offensive versatility could create pressure over a full 48 minutes.
The Spurs did not need to win every statistical category.
They simply needed to dominate the categories that created extra possessions and high-value shots.
That is exactly what happened.
Season Series Context
At this point in the season series, San Antonio led 1-0.
The victory also improved the Spurs’ record to 46-17, while Los Angeles fell to 30-32.
The home record was particularly notable for San Antonio. The Spurs improved to 23-6 at home, while the Clippers dropped to 14-19 on the road.
These records provide useful context, but the individual game statistics remain more revealing for understanding what happened on the court.
Who Was the Best Player in the Game?
Victor Wembanyama has the strongest overall case.
Leonard scored more points, but Wembanyama influenced more areas of the game.
His final line included:
- 27 points
- 10 rebounds
- 4 blocks
- 1 steal
- 11-for-21 shooting
- 4-for-9 from three-point range
Most importantly, his impact arrived during the comeback.
He helped San Antonio protect the rim, rebound the ball, score inside and outside, and create late-game defensive pressure.
Leonard was arguably the best Clippers player, but Wembanyama’s all-around contribution had the greater effect on the final result.
Who Had the Biggest Supporting Performance?
Julian Champagnie deserves strong consideration.
His 20 points and 9 rebounds were valuable, but the 5-for-8 three-point shooting was the biggest factor.
His shooting stretched the Clippers’ defense and helped San Antonio create room for Wembanyama and Fox.
De’Aaron Fox was another major contributor because his 9 assists helped turn individual scoring opportunities into team offense.
Final Statistical Verdict
The la clippers vs san antonio spurs match player stats show a game in which Los Angeles performed well for roughly three quarters but could not maintain its advantage when San Antonio increased the pressure.
The Clippers had several statistical advantages.
They shot better overall, made their free throws at a much higher rate, and committed fewer turnovers.
But the Spurs controlled the areas that mattered most during the comeback.
San Antonio had:
- 52 rebounds
- 15 offensive rebounds
- 17 made three-pointers
- 29 assists
- 7 blocks
- 35 fourth-quarter points
Those numbers explain the comeback better than the final score alone.
The Clippers’ 112 points were not enough because San Antonio repeatedly created additional possessions and converted enough high-value opportunities to erase a huge deficit.
For readers analyzing la clippers vs san antonio spurs match player stats, this game is a strong example of why box-score analysis should go beyond points scored. Rebounding, three-point volume, defensive rim protection, assists, turnovers, and quarter-by-quarter scoring can completely change the meaning of a final result.
The most important conclusion is simple: Los Angeles had the better start, but San Antonio had the stronger finish. Wembanyama’s two-way impact, Fox’s playmaking, Champagnie’s shooting, and the Spurs’ dominance on the glass combined to turn a 25-point deficit into a four-point victory.
FAQs
Who led the Clippers in scoring against the Spurs?
Kawhi Leonard led the Clippers with 30 points. He also recorded 9 rebounds, 3 assists, and 3 steals.
Who led the Spurs in scoring?
Victor Wembanyama led San Antonio with 27 points. He also had 10 rebounds and 4 blocks.
What was the final score between the Clippers and Spurs?
The San Antonio Spurs defeated the Los Angeles Clippers 116-112.
How many rebounds did Victor Wembanyama have?
Wembanyama recorded 10 rebounds.
How many points did Brook Lopez score?
Brook Lopez scored 26 points for the Clippers on 11-for-19 shooting.
How did the Spurs overcome the Clippers’ large lead?
San Antonio overcame the deficit through improved second-half defense, offensive rebounding, three-point shooting, rim protection, and stronger fourth-quarter execution. The Spurs outscored Los Angeles 70-46 after halftime.
Conclusion
The la clippers vs san antonio spurs match player stats provide a detailed picture of a game that changed dramatically after halftime.
Kawhi Leonard led Los Angeles with 30 points and 9 rebounds, while Brook Lopez added 26 points. The Clippers shot 49 percent from the field and 80 percent from the free-throw line.
San Antonio responded with a balanced attack led by Victor Wembanyama, who finished with 27 points, 10 rebounds, and 4 blocks. De’Aaron Fox added 19 points and 9 assists, while Julian Champagnie delivered 20 points and 9 rebounds.
The decisive advantages were San Antonio’s 52-41 rebounding edge, 15 offensive rebounds, 17 made three-pointers, and 35-point fourth quarter.
Los Angeles controlled the opening half, but San Antonio controlled the final phase of the game. The result was a 116-112 Spurs victory and a memorable comeback after the team had fallen 25 points behind.
For statistical analysis, the game is a useful reminder that a box score becomes much more meaningful when individual production is connected to team-level trends. Points explain who scored, but rebounds, shooting distribution, assists, defensive plays, and quarter-by-quarter performance explain why the game was won.