Golden State Warriors vs LA Clippers Match Player Stats
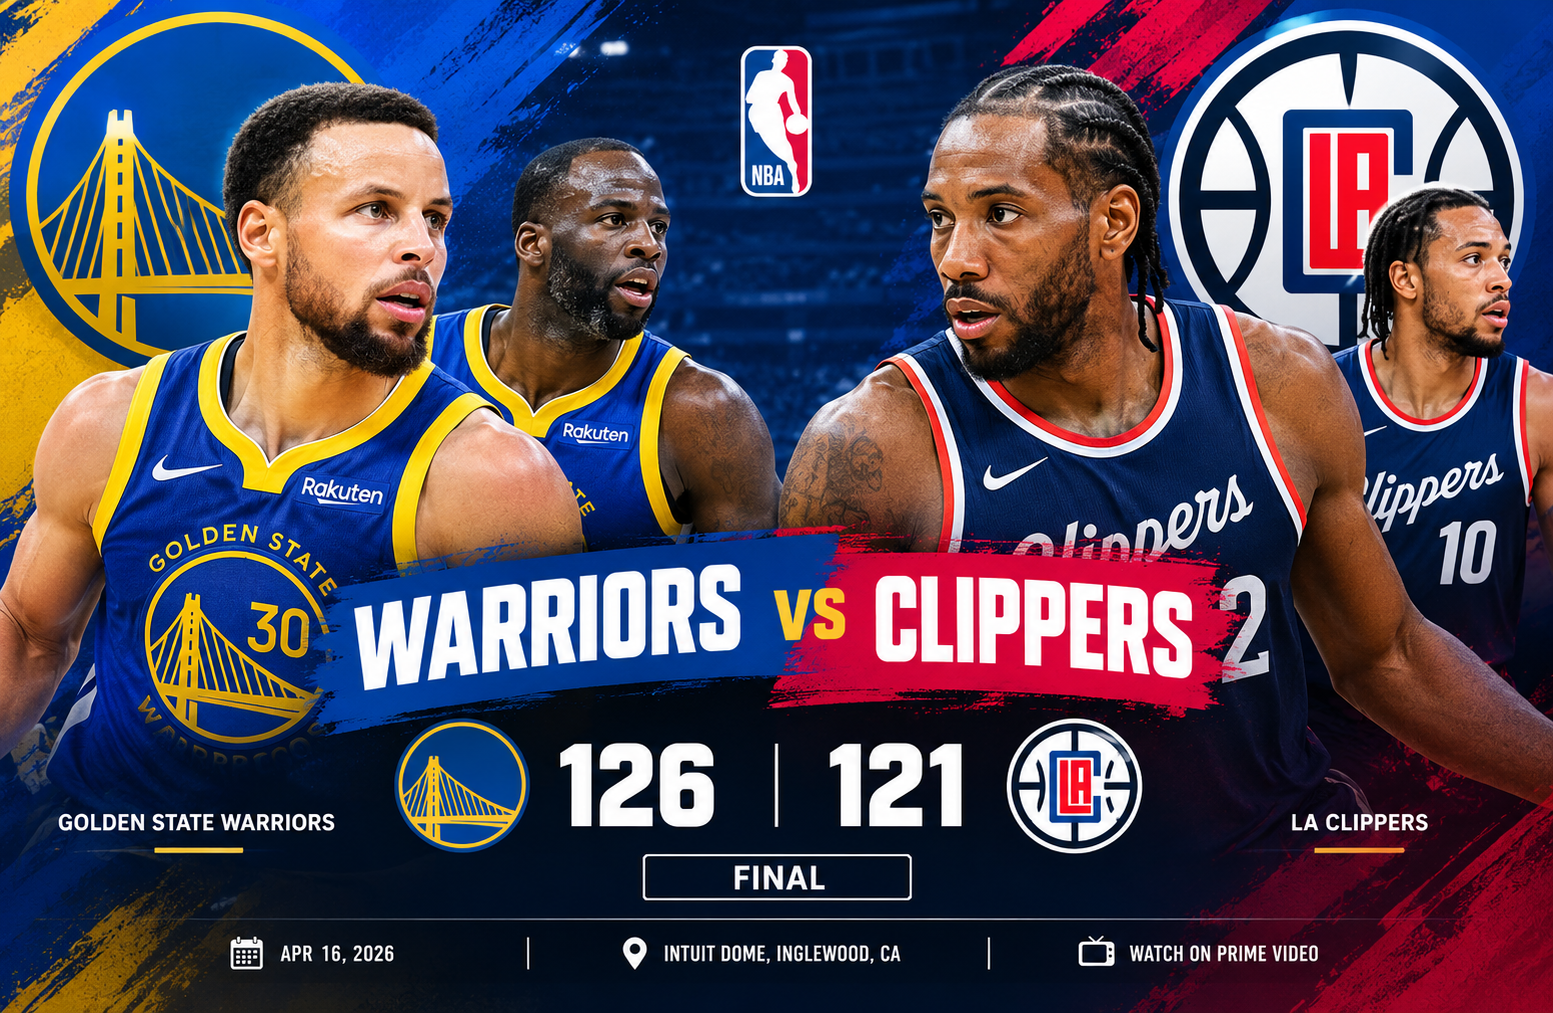
The Golden State Warriors vs LA Clippers match player stats from April 16, 2026, tell the story of a dramatic NBA Play-In Tournament game decided by a powerful fourth-quarter comeback. Golden State defeated Los Angeles 126-121 at Intuit Dome in Inglewood, California, overcoming a nine-point first-quarter deficit to secure a five-point victory. Stephen Curry led the Warriors with 35 points, while Gui Santos and Kristaps Porzingis contributed 20 points each. For the Clippers, Bennedict Mathurin scored 23 points, and Kawhi Leonard and Darius Garland added 21 points apiece.
The result was especially significant because both teams were competing in the Western Conference Play-In Tournament, where a single game could determine the direction of their postseason hopes. The Clippers started strongly and held a 31-22 lead after the opening quarter. However, Golden State gradually closed the gap before producing a 43-point fourth quarter that turned the contest in its favor.
Beyond the final score, the box score reveals several important differences between the teams. Golden State shot 57% from the field and made 19 three-pointers, while Los Angeles recorded 15 steals, 30 assists, and a perfect 17-for-17 performance at the free-throw line. These contrasting strengths help explain how the Warriors won despite committing more turnovers and facing an aggressive Clippers defense.
This breakdown examines the final score, individual player performances, team statistics, quarter-by-quarter scoring, and the key factors that shaped the result. All numerical game details below follow the supplied ESPN box-score data for April 16, 2026.
Game Overview: Warriors vs Clippers
The matchup featured two teams with different statistical strengths. Golden State relied on efficient shooting and perimeter scoring, while Los Angeles combined defensive pressure, ball movement, and reliable free-throw shooting.
| Game detail | Result |
| Match date | April 16, 2026 |
| Competition | NBA Play-In Tournament |
| Venue | Intuit Dome |
| Location | Inglewood, California |
| Home team | LA Clippers |
| Away team | Golden State Warriors |
| Final score | Warriors 126, Clippers 121 |
| Winning margin | 5 points |
| Attendance | 17,927 |
| Warriors’ listed record | 37-45 |
| Clippers’ listed record | 42-40 |
| Warriors’ leading scorer | Stephen Curry, 35 points |
| Clippers’ leading scorer | Bennedict Mathurin, 23 points |
The Warriors entered the game with a listed overall record of 37-45, compared with the Clippers’ 42-40 record. Los Angeles also had a listed home record of 23-18, while Golden State had a 15-26 away record. Those figures made the Clippers’ home-court position a relevant part of the pregame context, but the result ultimately came down to execution during the game.
The five-point margin also reflects how competitive the matchup remained. Los Angeles scored 121 points and made every free throw it attempted, yet Golden State’s combination of shooting accuracy and fourth-quarter production proved decisive.
Golden State Warriors vs LA Clippers Match Player Stats: Quarter-by-Quarter Breakdown
The scoring pattern provides one of the clearest ways to understand the contest. The Clippers controlled the opening period, but Golden State improved its position in each subsequent quarter.
| Quarter | Golden State Warriors | LA Clippers |
| First quarter | 22 | 31 |
| Second quarter | 31 | 30 |
| Third quarter | 30 | 28 |
| Fourth quarter | 43 | 32 |
| Final score | 126 | 121 |
First quarter: Los Angeles establishes control
The Clippers opened with 31 points while limiting Golden State to 22. That nine-point advantage gave the home team an early platform and put the Warriors in a position where they needed to respond without allowing the deficit to grow.
Los Angeles’ opening lead did not guarantee a comfortable finish. In a high-scoring game, a nine-point advantage can disappear quickly when an opponent begins making outside shots. Golden State needed to improve its offensive rhythm, create cleaner scoring opportunities, and remain close enough to make the second half competitive.
Second quarter: Golden State begins its recovery
The Warriors scored 31 points in the second quarter, one more than the Clippers’ 30. That small difference reduced the gap from nine points to eight by halftime.
The importance of this period lies less in the individual quarter margin and more in the direction of the game. Golden State was no longer losing ground. The team had begun matching the Clippers’ scoring output while building the foundation for a stronger second half.
Third quarter: The margin continues to shrink
Golden State added another 30 points in the third quarter, while Los Angeles scored 28. The Warriors won the period by two points, reducing the Clippers’ lead to six entering the fourth.
At this stage, the contest remained open. Los Angeles still held the advantage, but Golden State had outscored the Clippers in both middle quarters. The Warriors needed one more sustained offensive push to turn a close game into a lead.
Fourth quarter: A 43-point finish changes everything
The defining period arrived in the fourth quarter. Golden State scored 43 points, compared with 32 for Los Angeles, producing an 11-point advantage over the final 12 minutes.
That performance was enough to erase the Clippers’ six-point lead and finish five points ahead. The Warriors’ fourth-quarter output was also their highest-scoring period of the game.
The scoring sequence demonstrates why a final score alone can hide the structure of a basketball result. Los Angeles led for much of the contest, but Golden State produced its strongest offense when the game was at its most consequential.
The official NBA recap also records that Golden State had trailed by as many as 13 points in the fourth quarter before completing the comeback. Al Horford’s late three-point shooting and Curry’s decisive perimeter basket were central to the turnaround.
NBA.com
+1
Golden State Warriors Player Stats
The Warriors’ individual performances show that the victory was not the product of one scorer alone. Curry supplied the biggest scoring total, while Santos, Porzingis, Podziemski, Green, and Horford each contributed in different ways.
Warriors player statistics table
The following table summarizes the leading Golden State performers using the supplied game data and published box-score figures.
| Player | Points | Rebounds | Assists | Key contribution |
| Stephen Curry | 35 | 1 | 4 | Game-high scoring and seven three-pointers |
| Gui Santos | 20 | 6 | 5 | Efficient scoring and all-around production |
| Kristaps Porzingis | 20 | 5 | 5 | Interior presence and perimeter shooting |
| Brandin Podziemski | 17 | 7 | 2 | Rebounding and secondary scoring |
| Al Horford | 14 | 3 | 0 | Four three-pointers, including crucial late shots |
| Draymond Green | 7 | 6 | 9 | Playmaking and defensive disruption |
| De’Anthony Melton | 7 | 5 | 3 | Defensive pressure and supporting offense |
| Gary Payton II | 6 | 3 | 0 | Energy and transition defense |
Note: Individual statistics in this table are shown where supported by the supplied data and published game box-score records. Rebound and assist figures for the leading players are included to give readers a more complete picture of their contributions.
Stephen Curry: 35 points and the decisive perimeter threat
Stephen Curry finished with 35 points, the highest total of the game. He made 12 of 23 field-goal attempts, including seven of 12 three-pointers, and converted four of five free throws. His scoring efficiency was a major reason Golden State could recover from the early deficit.
Curry’s performance was particularly important because his impact extended beyond the raw point total. A high-volume perimeter scorer forces defenders to pay attention to him well beyond the three-point line. That attention can create driving lanes, passing opportunities, and more favorable matchups for teammates.
His timing mattered as much as his overall production. Curry scored 27 of his 35 points in the second half, according to the game recap. His seventh three-pointer broke a tie with 50.4 seconds remaining, giving Golden State a critical advantage late in the contest.
NBA.com
+1
For readers analyzing his performance, three figures deserve attention:
- 35 points: the highest scoring total in the game.
- 7 made three-pointers: a major source of Golden State’s perimeter advantage.
- 27 second-half points: evidence that his scoring became especially important as the game tightened.
Curry’s line illustrates why scoring totals should be evaluated alongside shot selection and game timing. His late basket did not merely add three points; it changed the situation at a moment when both teams were competing for control.
Gui Santos: An efficient 20-point performance
Gui Santos scored 20 points on nine-of-13 shooting, while adding six rebounds and five assists. He also made two of four three-point attempts.
His 69.2% field-goal percentage stands out because he converted a high share of his attempts without needing the same volume as Curry. Efficient supporting scoring is valuable in games where a primary scorer attracts substantial defensive attention.
Santos also contributed beyond shooting. Six rebounds helped Golden State compete on the glass, while five assists showed that he could participate in the team’s ball movement rather than functioning solely as a finisher.
One useful way to assess a supporting player’s value is to consider whether his scoring complements the main offensive threat. Santos’ production did exactly that: he gave the Warriors another dependable scoring option when the Clippers had to account for Curry.
Kristaps Porzingis: Scoring versatility and frontcourt value
Kristaps Porzingis also finished with 20 points. He made eight of 12 field-goal attempts, including three of six from beyond the arc, and recorded five rebounds and five assists.
Porzingis’ combination of size and shooting can complicate defensive assignments. A traditional center may be more comfortable protecting the paint than following a capable perimeter shooter away from the basket. Conversely, a smaller defender may struggle to contest his shots around the rim.
His three made three-pointers added another dimension to Golden State’s attack. The Warriors finished with 19 made threes as a team, so Porzingis’ perimeter contribution supported one of the most important statistical advantages in the game.
His five assists are also worth noting. They show that his performance was not limited to finishing plays. In a game where Golden State needed contributions from several players, that combination of scoring, rebounding, and passing was useful.
Brandin Podziemski: Rebounding and secondary scoring
Brandin Podziemski recorded 17 points and seven rebounds, the highest rebound total among the Warriors listed in the supplied leading-player data. He made five of 11 field-goal attempts and two of seven three-point attempts, while converting five of eight free throws.
His scoring was important because the Warriors did not have to rely exclusively on Curry to produce points. Podziemski also helped the team recover missed shots and maintain possessions.
His seven rebounds were particularly useful in a contest where both teams finished with 36 total rebounds. When the overall rebounding numbers are level, individual contributions can still matter by preventing second chances or helping initiate transition offense.
Podziemski’s performance provides a good example of why player evaluation should combine scoring and supporting statistics. Seventeen points tell only part of the story; seven rebounds and his role as a secondary ball handler add context.
Al Horford: A critical contribution from the bench
Al Horford scored 14 points and made four three-pointers. His late shooting was a defining element of Golden State’s comeback, according to the official game recap.
Horford’s impact was especially clear in the final minutes. After Santos’ layup brought the Warriors within one point at 115-114, Horford hit a three-pointer to put Golden State ahead 117-115 with 2:12 remaining. His perimeter accuracy gave the Warriors another scoring threat at the moment when the Clippers were trying to protect their lead.
NBA.com
+1
This is an important distinction when reviewing bench production. A reserve’s contribution cannot always be judged by minutes or total points alone. The timing of those points, the difficulty of the shots, and the pressure of the situation all influence their practical value.
Horford’s four made threes helped stretch the Clippers’ defense and made it harder for Los Angeles to focus exclusively on Curry.
Draymond Green: Playmaking and defensive influence
Draymond Green finished with seven points, six rebounds, nine assists, and four steals. His scoring total was modest compared with Curry’s, but his overall contribution was much broader.
Nine assists made Green Golden State’s leading playmaker in the supplied statistics. Four steals also demonstrate how his defensive activity helped disrupt the Clippers’ offense.
His defensive role became especially important late in the game. The NBA recap highlights Green’s defensive work against Kawhi Leonard, who struggled to find clean scoring opportunities during the fourth quarter until the final seconds. Green’s pressure helped the Warriors make their comeback sustainable by limiting one of Los Angeles’ primary offensive options.
NBA.com
+1
Green’s performance reinforces a central principle of basketball analysis: a player can influence the outcome without leading the team in points. Passing, defensive positioning, anticipation, and late-game stops can be just as important as scoring.
Golden State’s supporting cast
De’Anthony Melton contributed seven points, five rebounds, and three assists, while Gary Payton II added six points and three rebounds. Their numbers were smaller than those of the leading scorers, but the team needed contributions throughout the rotation to sustain its comeback.
Golden State’s most significant collective achievement was distributing enough production across multiple players to prevent the Clippers from concentrating all their defensive resources on Curry.
The scoring balance was clear:
- Curry led with 35 points.
- Santos and Porzingis each scored 20.
- Podziemski added 17.
- Horford supplied 14.
Those five players accounted for 106 of Golden State’s 126 points. Their combined output gave the Warriors a reliable scoring base, while Green helped connect the offense through his passing and defensive activity.
LA Clippers Player Stats
The Clippers also received strong performances from several players. Bennedict Mathurin led Los Angeles with 23 points, while Kawhi Leonard and Darius Garland scored 21 each. Brook Lopez added 17 points.
However, Los Angeles could not maintain its lead during the final quarter. The individual statistics suggest that the Clippers had enough scoring to remain competitive, but their late-game defense and inability to contain Golden State’s shooting became costly.
Clippers player statistics table
| Player | Points | Rebounds | Assists | Key contribution |
| Bennedict Mathurin | 23 | Not specified in supplied summary | Not specified in supplied summary | Team-leading scorer and three steals |
| Kawhi Leonard | 21 | Not specified in supplied summary | Not specified in supplied summary | Primary scoring option |
| Darius Garland | 21 | Not specified in supplied summary | Not specified in supplied summary | Scoring and perimeter creation |
| Brook Lopez | 17 | Not specified in supplied summary | Not specified in supplied summary | Frontcourt scoring |
| John Collins | Not specified in supplied summary | 9 | Not specified in supplied summary | Team-leading rebounder |
| Kris Dunn | Not specified in supplied summary | Not specified in supplied summary | 10 | Team-leading playmaker and three steals |
| Derrick Jones Jr. | Not specified in supplied summary | Not specified in supplied summary | Not specified in supplied summary | Three steals and defensive activity |
The supplied summary does not include every individual box-score field for every Clippers player. Unavailable figures are deliberately not estimated or invented.
Bennedict Mathurin: Los Angeles’ leading scorer
Bennedict Mathurin finished with 23 points, making him the Clippers’ highest scorer. His scoring helped Los Angeles build and maintain its advantage for much of the game.
Mathurin also recorded three steals, according to the supplied statistics. That defensive contribution was consistent with the Clippers’ overall pressure, as the team finished with 15 steals.
The challenge for Los Angeles was converting that activity into a winning result. Even strong individual scoring and defensive plays can be undermined when an opponent shoots efficiently during the closing minutes.
Mathurin’s performance was productive, but the final outcome depended on more than which player scored the most points for each team. Golden State’s collective shooting accuracy ultimately outweighed the Clippers’ advantages in several other categories.
Kawhi Leonard: A strong scoring total under late pressure
Kawhi Leonard recorded 21 points. His scoring helped the Clippers remain competitive, particularly while they controlled the game early.
The fourth quarter, however, proved difficult. The game recap notes that Leonard was held without a field goal until the final 16 seconds of the period, as Green and the Warriors applied stronger defensive pressure.
NBA.com
+1
This sequence helps explain why a player can finish with a respectable scoring total yet have limited influence during the decisive moments. Leonard’s overall points reflected his contribution across the game, but Golden State’s defense reduced his ability to answer the Warriors’ late scoring surge.
For the Clippers, that was a crucial problem. When a game enters its final minutes, teams need their primary scorers to find ways to generate efficient attempts, draw help defenders, or create openings for teammates.
Darius Garland: A second major scoring option
Darius Garland added 21 points, matching Leonard’s total. His production gave the Clippers another scoring threat and helped prevent the offense from depending on a single player.
Having two players score at least 21 points is generally a useful foundation for a competitive offensive performance. The Clippers also received 17 points from Lopez and 23 from Mathurin, creating a four-player group with substantial scoring output.
Yet the team still lost. This illustrates the difference between individual offensive success and team efficiency. Scoring totals do not reveal how effectively a team defended the opponent, how many possessions it wasted, or how well it performed under late-game pressure.
Garland’s 21 points helped keep Los Angeles in the contest, but Golden State’s fourth-quarter shooting and execution proved more decisive.
Brook Lopez: Frontcourt scoring support
Brook Lopez scored 17 points for the Clippers. His contribution gave Los Angeles another dependable scoring option alongside Leonard, Garland, and Mathurin.
Lopez’s presence also mattered because the Warriors had a frontcourt rotation that included Porzingis and Horford. In such a matchup, frontcourt scoring can help prevent the defense from focusing too heavily on perimeter players.
Even so, the Clippers’ overall field-goal percentage of 52% was lower than Golden State’s 57%. The difference was not enormous, but in a game featuring 247 combined points, small efficiency gaps can become meaningful.
Lopez’s scoring was a positive element of the Clippers’ performance, though it was not enough to offset the Warriors’ superior shooting.
Kris Dunn: Playmaking and defensive pressure
Kris Dunn led the Clippers with 10 assists and recorded three steals. His assist total indicates that he played an important role in creating scoring opportunities for teammates.
Los Angeles finished with 30 assists, one more than Golden State’s 29. The Clippers also recorded 15 steals, compared with the Warriors’ 12. Those numbers show that Los Angeles was active defensively and effective at moving the ball.
The problem was that these strengths did not translate into a win. The Clippers committed 17 turnovers according to the supplied data, while the Warriors committed 20. Golden State also converted its shooting opportunities at a higher rate.
Dunn’s performance illustrates the importance of balancing playmaking and possession control. Assists create opportunities, but teams still need to finish those chances and limit the damage caused by missed rotations or late defensive breakdowns.
John Collins and the Clippers’ rebounding effort
John Collins led Los Angeles with nine rebounds. The Clippers finished with 36 total rebounds, matching Golden State.
That equal total suggests neither team gained a clear overall advantage on the glass. Rebounding can still affect the game through timing and location, however. An offensive rebound in the closing minutes may be more valuable than a defensive rebound early in the first quarter because it creates an additional scoring opportunity when possessions are limited.
The Clippers also recorded nine offensive rebounds, compared with Golden State’s 10. The difference was small, and it does not independently explain the result.
Los Angeles’ challenge was not a lack of effort on the boards. Rather, the team struggled to contain Golden State’s high-efficiency offense when the outcome was still in doubt.
Team Statistics Comparison: Warriors vs Clippers
The team numbers reveal why Golden State won despite Los Angeles recording more assists and steals. The Warriors were more accurate from the field and beyond the three-point line, while the Clippers were perfect at the free-throw line.
| Team statistic | Golden State Warriors | LA Clippers |
| Final points | 126 | 121 |
| Field goals made | 47 | 45 |
| Field goals attempted | 83 | 86 |
| Field-goal percentage | 57% | 52% |
| Three-pointers made | 19 | 14 |
| Three-pointers attempted | 41 | 35 |
| Three-point percentage | 46% | 40% |
| Free throws made | 13 | 17 |
| Free throws attempted | 21 | 17 |
| Free-throw percentage | 62% | 100% |
| Total rebounds | 36 | 36 |
| Offensive rebounds | 10 | 9 |
| Defensive rebounds | 26 | 27 |
| Assists | 29 | 30 |
| Turnovers | 20 | 17 |
| Steals | 12 | 15 |
| Blocks | 3 | 3 |
| Personal fouls | 19 | 23 |
Field-goal percentage: Golden State’s efficiency advantage
Golden State made 47 of 83 field-goal attempts, while the Clippers made 45 of 86. That gave the Warriors a 57% field-goal percentage against Los Angeles’ 52%.
The difference matters because field-goal percentage measures how often a team converts its attempts into points. A team can attempt more shots but still score less efficiently if it misses a larger share of them.
Golden State made two more field goals despite attempting three fewer shots. That combination reflects more efficient finishing and contributed directly to the final margin.
Three-point shooting: Five additional makes
The three-point comparison was even more revealing. Golden State made 19 of 41 attempts, while the Clippers made 14 of 35.
| Three-point measure | Warriors | Clippers |
| Three-pointers made | 19 | 14 |
| Attempts | 41 | 35 |
| Accuracy | 46% | 40% |
| Points from made threes | 57 | 42 |
Golden State scored 57 points from three-point shots, compared with 42 for Los Angeles. The 15-point difference from beyond the arc was one of the most important statistical advantages in the matchup.
This does not mean three-point shooting alone explains every part of the result. Teams can compensate for outside shooting with points in the paint, transition baskets, free throws, or offensive rebounds. However, the Warriors’ five additional made threes provided a substantial scoring advantage.
Free throws: The Clippers were perfect
Los Angeles converted all 17 free throws, finishing with a 100% success rate. Golden State made 13 of 21, or approximately 62%.
This was a clear advantage for the Clippers. They scored four more points at the free-throw line, even though they lost the game.
The result demonstrates why one statistical category should never be considered in isolation. Perfect free-throw shooting helped Los Angeles remain competitive, but it could not fully offset Golden State’s stronger field-goal and three-point accuracy.
Rebounds: An even contest
Both teams recorded 36 rebounds. Golden State had 10 offensive rebounds and 26 defensive rebounds, while Los Angeles had nine offensive rebounds and 27 defensive rebounds.
The nearly identical totals indicate that neither team dominated the glass. Golden State’s one-rebound advantage on the offensive boards was modest, and the overall rebounding comparison does not suggest a major difference in possession recovery.
In a close game, rebound totals are most useful when considered alongside missed shots, second-chance opportunities, and the timing of individual rebounds. The final totals alone cannot explain every possession.
Assists and turnovers: Different sides of ball control
The Clippers recorded 30 assists, one more than Golden State’s 29. They also committed 17 turnovers, compared with the Warriors’ 20.
On those two measures, Los Angeles had an advantage. More assists suggest effective ball movement, while fewer turnovers generally mean fewer wasted possessions.
However, the Warriors’ shooting efficiency helped them overcome the turnover difference. Golden State converted 57% of its field-goal attempts, which meant that a higher share of its shots resulted in baskets.
The lesson is straightforward: possession security matters, but its value depends partly on what a team does with the possessions it retains.
Steals and blocks: Defensive activity did not decide the game
The Clippers recorded 15 steals, compared with Golden State’s 12. Both teams finished with three blocks.
Los Angeles’ three-steal advantage reflected its ability to pressure the ball and disrupt offensive actions. Yet those defensive statistics did not guarantee a victory because the Warriors remained efficient enough to score 126 points.
Golden State also produced important defensive stops during the closing stages. The overall steal total does not capture every contested shot, forced hesitation, or successful defensive rotation that influences a possession.
Why the Warriors Won the Game
Several factors combined to produce Golden State’s comeback. The most useful analysis considers the scoring efficiency, the fourth-quarter surge, the contributions from multiple players, and the defensive work that helped protect the lead.
1. The Warriors won the three-point battle
Golden State made five more three-pointers than the Clippers. That difference produced 15 additional points from outside the arc.
In a five-point game, a 15-point advantage in one shooting category is substantial. The Clippers compensated for part of it with superior free-throw shooting, but the Warriors’ perimeter accuracy still played a central role in the result.
2. Curry delivered in the second half
Curry scored 27 of his 35 points after halftime. His scoring helped Golden State remain close and then move ahead when the game reached its decisive phase.
His late three-pointer was especially important because it broke a tie with less than a minute remaining. A basket in that situation can change both the scoreboard and the opponent’s next decision, forcing the trailing team to respond under greater pressure.
3. Horford supplied timely bench scoring
Horford’s four made three-pointers gave Golden State another source of perimeter offense. His late shots were especially valuable because they arrived during the stretch when the Warriors were overturning the Clippers’ lead.
This illustrates the value of bench depth. A reserve does not need to lead the team in points to influence the outcome. Producing timely baskets can prevent an opponent from loading its defense toward a single star.
4. Multiple Warriors reached double figures
Curry scored 35, Santos and Porzingis each scored 20, Podziemski recorded 17, and Horford added 14. This spread of scoring made Golden State more difficult to defend.
The Clippers had four leading scorers with at least 17 points, so their offensive production was also balanced. The distinction was that Golden State’s shooting was more efficient and its biggest scoring burst came late.
5. Green helped disrupt Los Angeles’ closing offense
Green’s nine assists and four steals reflect his two-way influence. His defensive work against Leonard also helped Golden State limit the Clippers’ primary options during the final quarter.
The closing stretch required more than scoring. Golden State needed to prevent Los Angeles from answering every basket, and its defensive execution helped create the separation required to win.
What the Box Score Does Not Tell You
A box score is essential for understanding a basketball game, but it cannot fully explain the decisions and sequences behind every result.
First, a made field goal and a missed field goal do not describe shot difficulty. A contested three-pointer late in the shot clock is different from an open corner three, even though both attempts count the same in the basic statistics.
Second, total assists do not reveal every detail of offensive movement. A possession may involve several passes that force the defense to rotate before the eventual shot. Only the final pass may count as an assist.
Third, the plus/minus statistic measures a team’s point differential while a player is on the court. It can provide context about lineup performance, but it should not be treated as a standalone judgment of individual ability. Teammates, opponents, and substitution patterns all affect the number.
Finally, late-game execution deserves separate attention. The Warriors’ 43-point fourth quarter and the Clippers’ 32-point period reveal a major scoring difference, but the official play-by-play is needed to reconstruct each possession and identify the precise decisions that created it.
For readers who want to verify the numbers, the official ESPN game box score provides the central statistical record for this matchup.
Frequently Asked Questions
1. Who won the Golden State Warriors vs LA Clippers game on April 16, 2026?
The Golden State Warriors defeated the LA Clippers 126-121 in the Western Conference NBA Play-In Tournament at Intuit Dome in Inglewood, California.
2. How many points did Stephen Curry score against the Clippers?
Stephen Curry scored 35 points, the highest total of the game. He made 12 of 23 field-goal attempts and seven of 12 three-point attempts.
3. Who was the Clippers’ leading scorer?
Bennedict Mathurin led Los Angeles with 23 points. Kawhi Leonard and Darius Garland each scored 21 points, while Brook Lopez added 17.
4. What was the biggest difference between the two teams’ statistics?
Golden State’s three-point shooting was a major difference. The Warriors made 19 three-pointers, compared with 14 for the Clippers, and shot 57% overall from the field against Los Angeles’ 52%.
5. How did Golden State overcome the Clippers’ lead?
Golden State outscored Los Angeles 43-32 in the fourth quarter after trailing by as many as 13 points during that period. Curry’s late three-pointer and Horford’s timely perimeter shooting helped complete the comeback.
6. Which player led the Warriors in assists?
Draymond Green led Golden State with nine assists. He also recorded six rebounds and four steals, contributing as both a playmaker and a defender.
Conclusion
The Golden State Warriors vs LA Clippers match player stats reveal a game shaped by efficient shooting, late-game execution, and contributions from several key players. Golden State secured a 126-121 victory after trailing through the first quarter and entering the final period behind on the scoreboard.
Curry’s 35 points led the way, while Santos and Porzingis scored 20 apiece, Podziemski added 17, and Horford contributed 14. Green’s nine assists and four steals highlighted the importance of playmaking and defense beyond the scoring column.
For Los Angeles, Mathurin scored 23 points, Leonard and Garland recorded 21 each, and Lopez contributed 17. The Clippers also had advantages in assists, steals, turnovers, and free-throw accuracy. Nevertheless, Golden State’s 19 made three-pointers and 57% field-goal shooting helped offset those disadvantages.
The decisive difference was the fourth quarter. Golden State scored 43 points in the final period, turning a six-point deficit entering the quarter into a five-point victory. The result demonstrates how perimeter accuracy, timely bench production, and defensive stops can outweigh advantages in other statistical categories.
For readers reviewing this matchup, the most complete assessment comes from combining the final score with individual player performances, team shooting percentages, possession statistics, and the quarter-by-quarter scoring pattern. Together, these figures explain not only who won, but also how the Warriors overcame the Clippers’ early advantage.