Dallas Wings vs Seattle Storm Match Player Stats
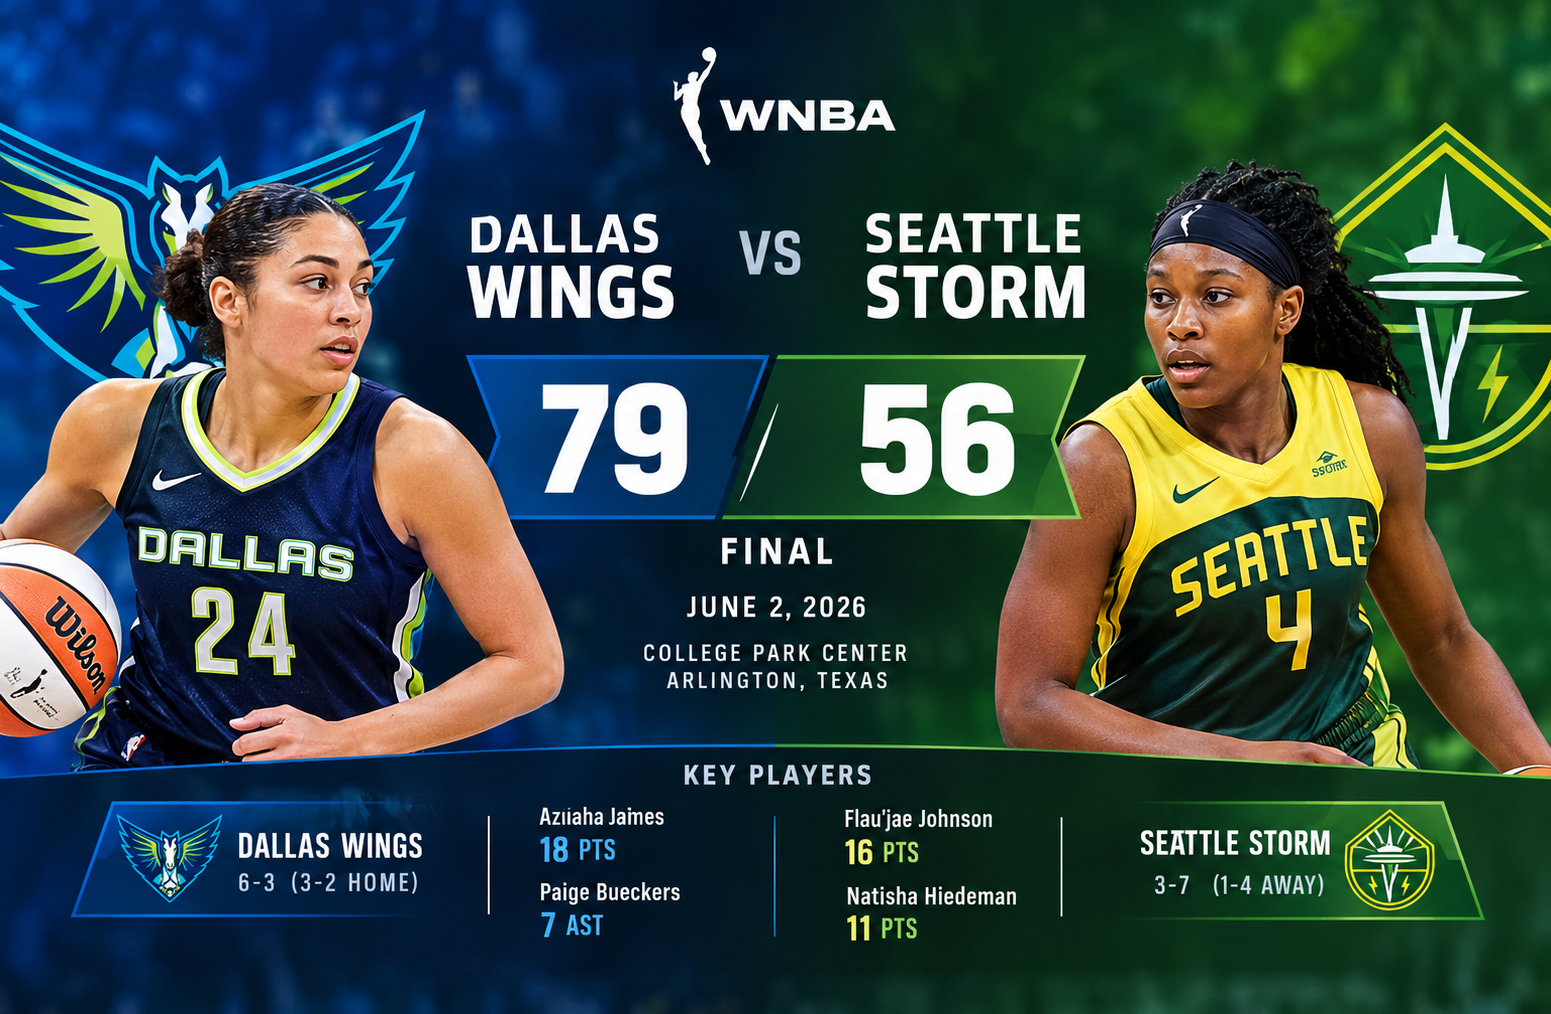
The Dallas Wings vs Seattle Storm match player stats from June 2, 2026, tell the story of a dominant Dallas performance built on rebounding, ball control, balanced scoring, and steady improvement across all four quarters. Dallas defeated Seattle 79-56 at College Park Center in Arlington, Texas, earning a 23-point victory in their WNBA Commissioner’s Cup matchup. The Wings scored more points in every quarter, collected 12 more rebounds than the Storm, and committed fewer than half as many turnovers. Those differences help explain why Dallas controlled the contest despite shooting only 36% from the field.
The game also offered several individual performances worth examining. Aziaha James led Dallas with 18 points on 7-of-14 shooting, while Paige Bueckers contributed 10 points, nine rebounds, and seven assists. For Seattle, Flau’jae Johnson finished with 16 points and 10 rebounds, and Natisha Hiedeman added 11 points. Mackenzie Holmes supplied an important contribution off the bench with eight points, seven rebounds, and four steals. Looking beyond the final score reveals how each team’s offensive decisions, defensive execution, and possession management shaped the result.
Data note: This breakdown uses the supplied ESPN box-score information for the June 2, 2026, game. The analysis distinguishes recorded statistics from interpretations of why the result unfolded as it did.
Game Overview: Dallas Wings vs Seattle Storm Match Player Stats
The opening matchup established a pattern that continued throughout the evening. Dallas won the first quarter 16-10, extended its advantage to 36-25 by halftime, and increased the margin to 57-37 after three quarters. The Wings then outscored Seattle 22-19 in the fourth to complete a comfortable victory.
Dallas Wings
79
Home team
Final
23-point margin
vs.
Seattle Storm
56
Away team
Date
June 2, 2026
Venue
College Park Center
Location
Arlington, Texas
Attendance
6,251
Quarter-by-quarter scoring
| Quarter | Dallas Wings | Seattle Storm | Dallas lead |
| Q1 | 16 | 10 | 6 |
| Q2 | 20 | 15 | 11 |
| Q3 | 21 | 12 | 20 |
| Q4 | 22 | 19 | 23 |
| Final | 79 | 56 | 23 |
Dallas won all four quarters, an important detail because the victory was not the product of a single late scoring burst. The Wings added to their lead throughout the game and entered the fourth quarter ahead by 20.
Seattle scored 19 points in the final period, its highest-scoring quarter of the game. However, Dallas also produced its best quarter by raw points, scoring 22. The Storm therefore made no meaningful reduction in the deficit during the closing period.
The game was played at College Park Center, and the supplied box-score record identifies it as a Commissioner’s Cup contest. The listed team records at the time of the matchup were 6-3 for Dallas and 3-7 for Seattle.
Complete Team Statistics Breakdown
The team numbers provide the clearest explanation for the result. Dallas did not overwhelm Seattle through superior shooting percentage alone. Instead, the Wings created more opportunities, protected the ball, and converted enough of their possessions to build a substantial lead.
| Team statistic | Dallas Wings | Seattle Storm |
| Points | 79 | 56 |
| Field goals | 29/81 (36%) | 20/61 (33%) |
| Three-pointers | 5/25 (20%) | 4/19 (21%) |
| Free throws | 16/24 (67%) | 12/17 (71%) |
| Total rebounds | 48 | 36 |
| Offensive rebounds | 18 | 6 |
| Defensive rebounds | 30 | 30 |
| Assists | 19 | 11 |
| Turnovers | 8 | 17 |
| Steals | 7 | 6 |
| Blocks | 1 | 7 |
| Personal fouls | 15 | 22 |
Source: supplied ESPN box-score data. Shooting percentages are rounded.
1. Rebounding gave Dallas more opportunities
Dallas recorded 48 rebounds compared with Seattle’s 36. The 12-rebound difference was significant, but the most revealing figure was offensive rebounding.
The Wings collected 18 offensive rebounds, while Seattle managed just six. That gave Dallas a substantial advantage in recovering missed shots and creating additional scoring opportunities.
This matters because Dallas attempted 81 field goals and made 29. The team missed 52 shots from the field, and its offensive rebounds helped it retain possession after some of those misses. Seattle attempted 61 shots and missed 41, but its six offensive rebounds limited its ability to turn those misses into additional chances.
Offensive rebounds do not automatically produce points. A team must still convert the second-chance opportunity. Nevertheless, securing a missed shot can extend an attack, force the defense to recover its positioning, and create another chance near the basket or beyond the arc.
Dallas’s 18 offensive rebounds were therefore one of the most important features of this game. The advantage was not simply about collecting loose balls. It helped the Wings compensate for modest shooting efficiency.
2. Turnover control separated the teams
Dallas committed eight turnovers. Seattle committed 17.
That difference of nine turnovers is particularly important in a game in which both teams struggled to shoot efficiently. Each turnover can eliminate a scoring opportunity before a shot is even attempted. It can also give the opponent a chance to attack before the defense is set.
The Wings’ lower turnover total indicates that they retained possession more reliably. Their 19 assists against eight turnovers also show a favorable balance between creating scoring opportunities for teammates and protecting the ball.
Seattle finished with 11 assists and 17 turnovers. That combination suggests that the Storm had difficulty maintaining efficient offensive possessions. However, the box score alone cannot establish whether every turnover resulted from defensive pressure, a passing mistake, a miscommunication, or another cause.
The practical takeaway is straightforward: Dallas did a better job of making its possessions count. Seattle needed cleaner ball movement and fewer lost possessions to keep the game competitive.
3. Shooting efficiency was similar, but Dallas shot more often
The Wings made 36% of their field-goal attempts, while the Storm made 33%. Neither team had a particularly strong overall field-goal percentage.
Dallas’s advantage came partly from taking 20 more field-goal attempts. The combination of more attempts and a slightly higher conversion rate helped produce its 23-point win.
The three-point numbers tell a slightly different story. Dallas made five of 25 attempts, or 20%, while Seattle made four of 19, or approximately 21%. Seattle was marginally more accurate from long range, but the difference was small and neither team established a major advantage from beyond the arc.
Free throws also favored Seattle in percentage terms. The Storm converted 71% of their attempts, compared with 67% for Dallas. Yet Dallas attempted 24 free throws and made 16, while Seattle attempted 17 and made 12.
The broader lesson is that shooting percentages cannot explain a basketball result on their own. Rebounds, turnovers, total attempts, and the distribution of scoring opportunities all contribute to the final outcome.
4. Dallas controlled the defensive glass
Both teams recorded 30 defensive rebounds. This equal total is worth noting because Dallas’s overall rebounding advantage came entirely from the offensive glass.
The Wings were not ahead because they collected more defensive rebounds. They were ahead because they recovered more of their own missed shots.
Seattle’s seven blocks also deserve attention. The Storm protected the basket effectively on individual possessions, but those blocks did not translate into overall control of the game. Dallas still generated 81 field-goal attempts and maintained its advantage in rebounds and turnovers.
This illustrates an important distinction when interpreting defensive statistics: an impressive individual category does not necessarily mean a team performed better overall. Blocks can disrupt shots, but a defense must also finish possessions with rebounds and limit opponents’ opportunities.
Dallas Wings Player Stats: Full Performance Analysis
Dallas’s victory featured contributions from its starting lineup and bench. Aziaha James led the scoring, while Paige Bueckers helped connect the offense through passing and rebounding. Other players contributed points, defensive activity, and possession management.
The following figures are drawn from the supplied player-stat lines.
Dallas Wings player statistics table
| Player | Points | Rebounds | Assists | Additional recorded stats |
| Aziaha James | 18 | 3 | 1 | 7/14 FG |
| Paige Bueckers | 10 | 9 | 7 | 2 turnovers |
| Jessica Shepard | 9 | 8 | 1 | 1 steal |
| Maddy Siegrist | 9 | 9 | 2 | 1 steal |
| Arike Ogunbowale | 9 | 5 | 1 | 1 steal |
| Azzi Fudd | 9 | 1 | 1 | 1 steal, 1 block |
| Alysha Clark | 6 | 5 | 1 | 1 steal |
| Alanna Smith | 5 | 4 | 3 | Not specified |
| Li Yueru | 2 | 2 | Not specified | Not specified |
| Odyssey Sims | 2 | 2 | 4 | 1 steal |
The table lists the individual statistics provided for these players. Where a category was not included in the supplied data, it is left unspecified rather than treated as zero.
Aziaha James: Dallas’s leading scorer
Aziaha James led Dallas with 18 points, making seven of her 14 field-goal attempts. Her 50% field-goal conversion rate was considerably higher than the team’s overall 36%.
James’s contribution gave Dallas a clear scoring leader without requiring the offense to rely on a single high-volume shooter throughout the game. Her seven made field goals accounted for a meaningful share of the team’s 29 total field goals.
Her performance is especially notable when compared with the team’s three-point shooting. Dallas made only five of 25 three-point attempts, so its offense benefited from contributions that did not depend entirely on long-range accuracy.
James also recorded three rebounds and one assist in the supplied statistics. Her primary impact was scoring, and the 18-point total made her the game’s leading scorer.
A responsible statistical interpretation should stop short of assigning every point to a specific play type without a full play-by-play record. The available numbers establish her scoring efficiency, but they do not independently reveal how many points came from transition opportunities, drives, midrange shots, or other situations.
Paige Bueckers: An all-around contribution
Paige Bueckers recorded 10 points, nine rebounds, and seven assists. She also committed two turnovers.
Her statistical line shows a player contributing across several areas rather than focusing exclusively on scoring. Seven assists represented a substantial portion of Dallas’s 19 team assists, while nine rebounds placed her among the team’s leading rebounders.
Bueckers’s assist total is particularly useful when evaluating the Wings’ ball movement. Dallas assisted on many scoring opportunities and finished with more assists than Seattle. Bueckers’s seven assists were an important part of that distribution.
Her nine rebounds also helped the team maintain its possession advantage. Although Maddy Siegrist and Bueckers each recorded nine rebounds in the supplied data, the team’s overall rebounding edge was driven by its offensive work as a unit.
The two turnovers provide useful context. Seven assists are valuable, but assists should not be evaluated without considering possession security. In this case, Bueckers contributed to the offense’s creation of shots while the team as a whole kept its turnover total to eight.
Her performance is a strong example of why a box score should be read across several categories. Ten points alone would not fully describe her impact.
Jessica Shepard: Rebounding and interior support
Jessica Shepard finished with nine points, eight rebounds, one assist, and one steal.
Her eight rebounds were important in a game in which Dallas dominated the offensive glass. The supplied individual line does not specify how many of Shepard’s rebounds came on offense, so it would be inaccurate to attribute a particular number of second-chance possessions to her.
Still, her overall rebounding contribution helped Dallas maintain its advantage on the boards. She also added nine points, giving the Wings another scoring option alongside James and Bueckers.
The combination of points, rebounds, and a steal demonstrates a contribution across both ends of the floor. It also shows why team success in basketball often depends on players whose impact extends beyond being the leading scorer.
Maddy Siegrist: Nine points and nine rebounds
Maddy Siegrist recorded nine points and nine rebounds, along with two assists and one steal.
Her near double-double was one of the more balanced statistical performances in Dallas’s lineup. The nine rebounds matched Bueckers’s total and helped the Wings establish a presence on the boards.
Siegrist’s two assists also contributed to the team’s 19-assist total. While that number is smaller than Bueckers’s seven, it illustrates that the Wings received playmaking support from multiple players.
Her nine points complemented the scoring of James and Bueckers. Dallas had several players contributing between five and 10 points, which reduced the pressure on any one player to produce a large scoring total.
Arike Ogunbowale: A supporting scoring contribution
Arike Ogunbowale finished with nine points, five rebounds, one assist, and one steal.
The available line does not identify her field-goal attempts or shooting percentage, so it is not possible to evaluate her individual scoring efficiency precisely from these figures alone.
Her five rebounds added to Dallas’s team total, and the steal recorded in the supplied data reflects defensive activity. The important team-level context is that Dallas won comfortably without needing one player to account for most of its points.
Ogunbowale’s nine points were part of a wider distribution that included James’s 18, Bueckers’s 10, and several players with nine points each.
Azzi Fudd: Contributing beyond scoring
Azzi Fudd recorded nine points, one rebound, one assist, one steal, and one block.
Her line shows contributions in multiple categories, including a block that added to Dallas’s defensive activity. The Wings recorded only one block as a team in the supplied statistics, making Fudd’s recorded block the notable individual contribution in that category.
Fudd’s nine points also gave Dallas another player with a meaningful scoring total. Although the team made only five three-pointers, the supplied figures do not specify Fudd’s individual three-point attempts or makes. Her overall performance should therefore be evaluated using the available totals rather than assumptions about her perimeter shooting.
Dallas’s bench: James leads the way
The Dallas bench played an important role in the team’s scoring distribution. James led the group with 18 points, while Alysha Clark added six points, Alanna Smith scored five, and Li Yueru and Odyssey Sims each recorded two.
Clark contributed six points, five rebounds, one assist, and one steal. Smith added five points, four rebounds, and three assists. Sims recorded two points, two rebounds, four assists, and one steal.
These numbers demonstrate that the bench supplied more than isolated scoring. Smith and Sims combined for seven assists, supporting Dallas’s overall ball movement.
The provided box-score summary lists JJ Quinerly among Dallas’s bench players, but it does not supply an individual statistical line for her. No additional figures should be inferred from her appearance on the roster list.
The broader finding is that Dallas received a strong scoring performance from James and useful supporting contributions from other players. This balance made it easier for the team to sustain its lead over four quarters.
Seattle Storm Player Stats: Individual Performances
Seattle finished with 56 points, but the player statistics show that several Storm players still produced useful individual performances. Flau’jae Johnson led the team in scoring and rebounding, Natisha Hiedeman provided additional scoring, and Mackenzie Holmes made a notable contribution from the bench.
The challenge for Seattle was turning those individual efforts into consistent team offense. The Storm recorded 11 assists, 17 turnovers, and just six offensive rebounds. Those team numbers limited the benefits of their individual contributions.
Seattle Storm player statistics table
| Player | Points | Rebounds | Additional recorded stats |
| Flau’jae Johnson | 16 | 10 | Team scoring and rebounding leader |
| Natisha Hiedeman | 11 | Not specified | Second-leading scorer |
| Mackenzie Holmes | 8 | 7 | 4 steals |
| Other listed players | Not fully supplied | Not fully supplied | Individual lines unavailable |
The supplied information identifies the Seattle starters as Jordan Horston, Stefanie Dolson, Natisha Hiedeman, Flau’jae Johnson, and Jade Melbourne. The bench list includes Katie Lou Samuelson, Mackenzie Holmes, Awa Fam, Lexie Brown, Zia Cooke, Joyner Holmes, Ezi Magbegor, and Dominique Malonga.
Because complete individual lines for every Storm player were not included in the supplied data, the analysis below focuses on verified figures rather than filling gaps with estimates.
Flau’jae Johnson: Seattle’s leading scorer and rebounder
Flau’jae Johnson recorded 16 points and 10 rebounds, leading Seattle in both categories. Her double-double was one of the clearest individual highlights for the Storm.
Scoring 16 of Seattle’s 56 points means Johnson accounted for a substantial portion of the team’s offense. Her 10 rebounds also gave Seattle a player capable of contributing to possession recovery at both ends of the floor.
However, her individual rebounding success did not translate into an overall team advantage. Seattle finished with 36 rebounds, compared with Dallas’s 48. The Storm collected only six offensive rebounds, a key weakness in the team statistics.
This distinction matters when assessing a player’s performance. Johnson’s 10 rebounds were a strong individual contribution, but the team’s overall rebounding results depended on the collective efforts of all five players on the court.
Her scoring total also illustrates Seattle’s offensive challenge. Johnson led the team, but the Storm finished 23 points behind. A leading scorer can produce an impressive line without the team generating enough efficient possessions to win.
Natisha Hiedeman: An important secondary scorer
Natisha Hiedeman contributed 11 points, making her Seattle’s second-leading scorer in the supplied data.
Her 11 points were important because they gave Johnson support in the scoring column. Nevertheless, Seattle’s total of 56 points suggests that the team struggled to turn its available scoring contributions into sustained offense.
The Storm made 20 of 61 field-goal attempts and committed 17 turnovers. Those figures indicate two distinct areas for improvement: converting more shots and preserving possessions long enough to generate more attempts.
Hiedeman’s individual points helped the offense, but the team needed more consistent production across its lineup. Without complete shooting and playmaking figures for her performance, it would be inappropriate to assign a specific efficiency rating or claim that her shot selection was a cause of the defeat.
Mackenzie Holmes: A disruptive bench performance
Mackenzie Holmes finished with eight points, seven rebounds, and four steals.
The four steals stand out because they show how a bench player can influence a game defensively even when her scoring total is below that of the team’s leading players. Steals can create additional possessions, disrupt passing sequences, and sometimes lead to fast-break opportunities.
Holmes also collected seven rebounds, providing another source of work on the boards. Her eight points added useful scoring support.
The Storm recorded six offensive rebounds as a team, but the supplied data does not separate Holmes’s offensive and defensive rebounds. Her seven total rebounds should therefore be understood as a contribution to the overall total, not proof of a particular number of second-chance possessions.
Holmes’s line was one of Seattle’s most notable individual performances because it combined scoring, rebounding, and defensive activity. The larger challenge was that this contribution was not enough to offset Dallas’s possession advantage.
Jordan Horston: Defensive presence near the basket
Jordan Horston led Seattle with four blocks according to the supplied data.
Four blocks represent a significant defensive contribution in an individual game. They indicate that Horston disrupted multiple shot attempts, helping explain why Seattle finished with seven team blocks despite losing by 23 points.
However, blocks tell only part of the defensive story. The Storm also needed to finish possessions by securing rebounds, avoid unnecessary fouls, and prevent Dallas from creating additional opportunities after missed shots.
Seattle’s 36 total rebounds and 22 personal fouls show the broader context in which Horston’s blocks occurred. The defensive plays were valuable, but the team did not consistently turn stops into secure possessions.
A useful evaluation of Horston’s performance would combine her four blocks with the full defensive record, including matchup assignments and shot locations. Those additional details are not available in the supplied summary.
Seattle’s bench and the challenge of collective production
The Storm’s bench included several experienced and developing players, but the available figures identify Holmes as the clearest statistical highlight. Her eight points, seven rebounds, and four steals provided production across three categories.
Seattle’s team total of 11 assists was eight fewer than Dallas’s 19. That difference suggests the Storm generated fewer assisted scoring opportunities overall. However, team assists depend on many factors, including shot creation, successful finishing, and how scoring possessions develop.
The 17 turnovers were another major obstacle. Even when a player creates a good shot or contributes defensively, repeated lost possessions can undermine the team’s overall performance.
Seattle’s path to a more competitive game would have required improved possession management, stronger offensive rebounding, and more efficient shooting from the lineup as a whole.
Head-to-Head Statistical Comparison
The most useful way to understand this matchup is to compare the categories that directly influenced the score.
Key statistical advantages
Total rebounds
Dallas 48
Seattle 36
Offensive rebounds
Dallas 18
Seattle 6
Assists
Dallas 19
Seattle 11
Turnovers
Dallas 8
Seattle 17
Note: Fewer turnovers are better. The bars show raw totals, not adjusted efficiency.
What the numbers reveal
Rebounding: Dallas had 12 more total rebounds and three times as many offensive rebounds. The offensive-rebound gap was particularly important because it helped the Wings generate more opportunities.
Ball security: Dallas committed eight turnovers compared with Seattle’s 17. The nine-turnover difference is a strong indicator of how much better Dallas protected its possessions.
Playmaking: The Wings recorded 19 assists, while the Storm recorded 11. Dallas’s higher assist total was consistent with a more productive overall offensive performance.
Interior defense: Seattle recorded seven blocks compared with Dallas’s one. This was a genuine defensive advantage for the Storm, even though it did not determine the final result.
Shooting: Dallas made 36% of its field goals and Seattle made 33%. The modest percentage difference was accompanied by a much larger difference in shot attempts, 81 to 61.
Free throws: Seattle converted a higher percentage of its attempts, 71% compared with Dallas’s 67%. Dallas nevertheless made more free throws, 16 to 12, because it attempted seven more.
These comparisons show why a single statistic cannot fully explain a basketball game. Seattle had the edge in blocks and free-throw percentage, but Dallas was better in several possession-related categories and maintained a scoring advantage in every quarter.
Why Dallas Won by 23 Points
The 79-56 result can be understood through five connected factors.
1. The Wings built their advantage early
Dallas scored 16 points in the first quarter and 20 in the second, while Seattle scored 10 and 15. By halftime, Dallas had established an 11-point lead.
That early advantage reduced the need for a dramatic comeback later in the game. The Wings could focus on extending the lead and managing possessions rather than chasing the score.
2. Second-chance opportunities favored Dallas
The Wings recorded 18 offensive rebounds. Seattle recorded six.
This 12-rebound difference created a substantial contrast in how the teams handled missed shots. Dallas had more opportunities to recover possession and attempt another shot, while Seattle had fewer chances to extend its own attacks.
3. Dallas protected possession more effectively
Eight turnovers is a much lower total than Seattle’s 17. The difference suggests that Dallas avoided many of the lost possessions that interrupted Seattle’s offense.
This advantage was especially relevant because neither team shot particularly well. When shooting efficiency is modest, preserving possessions becomes even more valuable.
4. Dallas received contributions from several players
James led the Wings with 18 points, but Bueckers, Shepard, Siegrist, Ogunbowale, and Fudd each recorded nine or 10 points.
That distribution gave Dallas multiple scoring contributors. It prevented the offense from depending entirely on one player to generate points.
5. Seattle’s defensive plays did not offset its offensive problems
The Storm’s seven blocks were an impressive team statistic. Horston contributed four, showing that Seattle could disrupt shots at the rim.
But the team also committed 17 turnovers, recorded only six offensive rebounds, and shot 33% from the field. Those disadvantages reduced the impact of its defensive successes.
The overall conclusion is that Dallas won through a combination of opportunity creation, possession control, and balanced scoring. Seattle had some effective individual defensive performances, but its offense did not produce enough points to remain close.
How to Interpret the Most Important Player Statistics
Readers often look at points first when evaluating a WNBA matchup. Points are essential, but they do not provide a complete picture of performance. The Dallas-Seattle game illustrates why rebounds, assists, turnovers, and shooting percentages should be examined together.
Points and scoring efficiency
Points show how much scoring a player contributed. However, the number of points alone does not show how many attempts were needed to score them.
For example, James scored 18 points on 7-of-14 field-goal shooting. Her field-goal percentage was 50%, calculated by dividing seven made shots by 14 attempts.
Dallas’s team field-goal percentage was 36%. James therefore converted her field-goal attempts at a higher rate than the team average.
Free throws and three-pointers require additional context when calculating scoring efficiency. A full assessment would consider all scoring attempts, including free throws, rather than relying only on field-goal percentage.
Rebounds and possession value
A rebound is recorded when a player gains possession of the ball after a missed field-goal or free-throw attempt, subject to the applicable statistical rules.
Rebounds are commonly divided into two categories:
- Offensive rebounds: The attacking team recovers a missed shot and can continue its possession.
- Defensive rebounds: The defending team secures the missed shot and usually ends the opponent’s possession.
Dallas’s 18 offensive rebounds were especially important because they offered opportunities to continue attacks. Its 30 defensive rebounds matched Seattle’s 30, so the Wings’ overall rebounding advantage came from the offensive end.
Assists and offensive teamwork
An assist is generally credited when a pass directly leads to a teammate’s made basket, according to the scorer’s judgment and the league’s statistical rules.
Dallas recorded 19 assists, compared with Seattle’s 11. This difference supports the observation that Dallas generated more assisted baskets.
However, assists are not a perfect measure of overall teamwork. A player can make a valuable pass that leads to a basket without receiving an assist, and an unassisted basket can still be the result of effective team play earlier in a possession.
Turnovers and lost opportunities
Turnovers occur when a team loses possession without completing a successful shot attempt or otherwise retaining the ball under the rules.
The Wings’ eight turnovers were substantially fewer than the Storm’s 17. Lower turnover totals generally help a team maintain offensive opportunities, although the value of each possession also depends on whether the team scores.
For this matchup, turnover control and offensive rebounding worked in the same direction. Dallas lost the ball less frequently and recovered more of its missed shots, giving it a clear advantage in possession management.
Blocks and defensive disruption
A block occurs when a defender legally deflects or stops an opponent’s shot attempt. Blocks can prevent scoring, but they do not automatically end a possession if the attacking team recovers the ball.
Seattle recorded seven blocks, while Dallas recorded one. That figure highlights the Storm’s ability to challenge shots, particularly around the basket.
The final score demonstrates why blocks must be considered alongside other defensive categories. Seattle’s blocks did not overcome Dallas’s advantage in rebounds, turnovers, and total scoring.
Game Context and Source Verification
For readers who want to verify the figures, the supplied record identifies ESPN as the source and lists the game as Dallas Wings 79, Seattle Storm 56, on June 2, 2026.
The original ESPN box score is the relevant reference for the game’s recorded scoring and player statistics.
Several details should be kept in mind when using the numbers in an article or statistical report.
First, the supplied data includes the teams’ records as displayed on the game page: Dallas at 6-3 overall and Seattle at 3-7. Those records are game-page context, not a claim about either team’s final season record.
Second, the supplied material contains a later season-series summary that lists additional Dallas-Seattle results. Those later games are separate from the June 2 contest and should not be used to explain individual statistics in this matchup.
Third, some individual player lines are incomplete. Where points, rebounds, assists, or other categories are not provided, they should remain unspecified. A missing figure does not mean a player recorded zero in that category.
Finally, statistical descriptions and tactical explanations should be kept separate. The figures establish that Dallas had more offensive rebounds and fewer turnovers. They support an interpretation of better possession management, but they do not establish the exact cause of every turnover or rebound.
This distinction improves the reliability of sports reporting. Readers receive the available facts, a useful explanation of their significance, and a clear boundary between recorded information and analysis.
Frequently Asked Questions
1. Who won the Dallas Wings vs Seattle Storm game on June 2, 2026?
The Dallas Wings defeated the Seattle Storm 79-56 at College Park Center in Arlington, Texas. Dallas won by 23 points and outscored Seattle in all four quarters.
2. Who was the top scorer in the game?
Aziaha James led Dallas with 18 points on 7-of-14 field-goal shooting. Flau’jae Johnson was Seattle’s leading scorer with 16 points.
3. What were Paige Bueckers’s stats against Seattle?
Paige Bueckers recorded 10 points, nine rebounds, and seven assists. She also committed two turnovers, according to the supplied box-score data.
4. How many rebounds did Dallas and Seattle record?
Dallas collected 48 total rebounds, while Seattle recorded 36. The Wings’ 18 offensive rebounds compared with Seattle’s six were a particularly important difference.
5. Why did Dallas win the game?
Dallas combined better ball security, a substantial offensive-rebounding advantage, and contributions from several scorers. The Wings committed eight turnovers to Seattle’s 17 and finished with 19 assists compared with the Storm’s 11.
6. Where can readers find the complete game statistics?
The ESPN box score for the June 2, 2026, matchup provides the reference for the recorded game statistics. Individual player lines should be checked against the original record whenever a complete statistical breakdown is required.
Conclusion
The Dallas Wings’ 79-56 victory over the Seattle Storm on June 2, 2026, was built on more than a small advantage in shooting percentage. Dallas created additional opportunities through 18 offensive rebounds, protected the ball with just eight turnovers, and received scoring contributions from multiple players. Its lead increased in every quarter, reflecting a consistent advantage throughout the game.
Aziaha James led Dallas with 18 points, while Paige Bueckers contributed 10 points, nine rebounds, and seven assists. Jessica Shepard and Maddy Siegrist each recorded nine points and contributed on the boards. For Seattle, Flau’jae Johnson led with 16 points and 10 rebounds, Natisha Hiedeman added 11 points, and Mackenzie Holmes recorded eight points, seven rebounds, and four steals.
Seattle’s seven blocks showed that the Storm could disrupt shots defensively. However, 17 turnovers, six offensive rebounds, and 33% field-goal shooting limited the team’s ability to compete with Dallas’s more productive offense.
The most important lesson from this matchup is that individual scoring totals tell only part of the story. Rebounding, ball security, assists, defensive stops, and the number of scoring opportunities all help explain the final result. Examining these categories together provides a more complete understanding of the game and the performances behind the score.