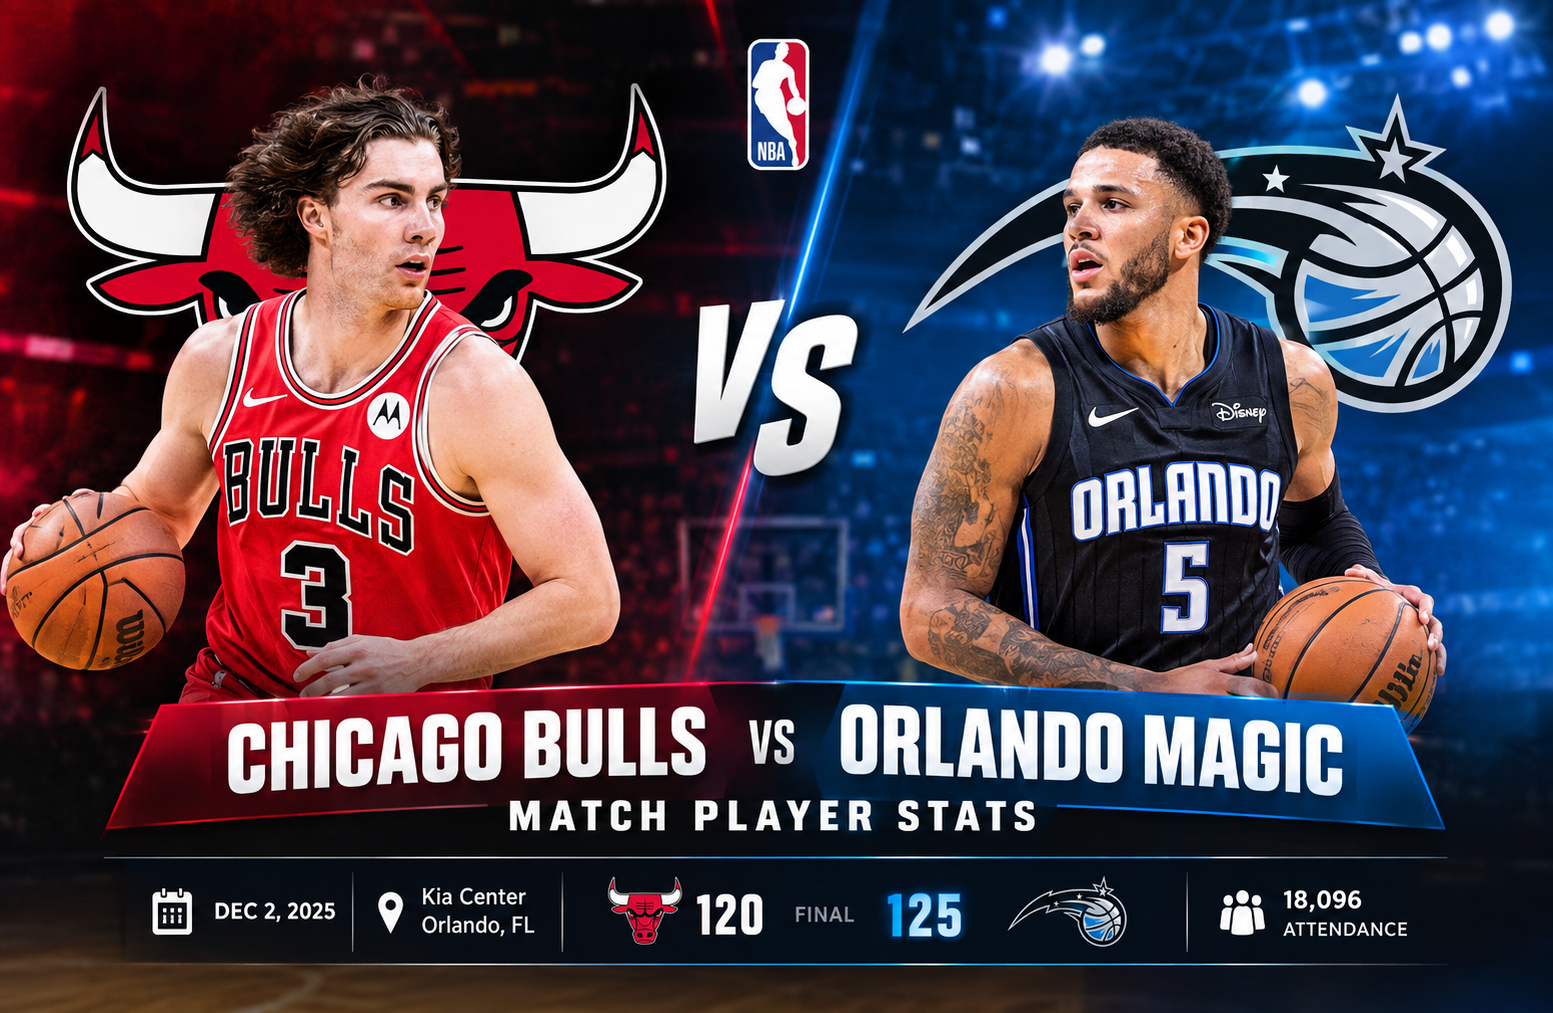
Chicago Bulls vs Orlando Magic Match Player Stats
The chicago bulls vs orlando magic match player stats from the December 2, 2025 matchup tell a much more detailed story than the 125-120 final score alone. Orlando defeated Chicago at Kia Center, but the game was competitive throughout, with 10 lead changes and 12 ties. Chicago shot 50% from the field and made 16 three-pointers, yet Orlando created enough advantages at the free throw line, on defense, and around the rim to close the game strongly. (NBA.com)
For anyone studying this matchup from a statistical perspective, the most important point is that Chicago did many things well offensively. The Bulls made 44 of 88 field goals and 16 of 37 three-point attempts. They also recorded 30 assists and 43 rebounds. However, Orlando’s 26-for-33 free throw shooting, 12 steals, and 11 blocks gave the Magic additional ways to score and disrupt Chicago’s offense.
Desmond Bane was the central figure for Orlando. He finished with 37 points on 12-of-17 shooting, including three three-pointers, while making all 10 of his free throw attempts. He also produced six rebounds and five assists. According to the official NBA recap, Bane scored 18 of his 37 points in the fourth quarter, including a go-ahead three-pointer that helped trigger Orlando’s decisive late run. (NBA.com)
On the Chicago side, Josh Giddey led the Bulls with 22 points, while Matas Buzelis added 21 and Nikola Vucevic contributed 20 points and 11 rebounds. The numbers show that Chicago had several reliable offensive contributors, but Orlando’s defensive activity and late-game execution ultimately separated the teams.
Chicago Bulls vs Orlando Magic Match Player Stats Overview
The game took place at Kia Center in Orlando, Florida, with an announced attendance of 18,096. Orlando entered the matchup with a 13-8 record and an 8-3 home record, while Chicago was 9-11 overall and 3-9 on the road.
The four-quarter scoring pattern shows just how closely the game was contested:
| Quarter | Chicago Bulls | Orlando Magic |
| Q1 | 26 | 29 |
| Q2 | 27 | 24 |
| Q3 | 32 | 32 |
| Q4 | 35 | 40 |
| Final | 120 | 125 |
Chicago actually outscored Orlando 35-40 in the fourth quarter, but the wording of the table is important: Orlando scored 40 and Chicago scored 35. That five-point fourth-quarter advantage was enough to preserve the Magic’s lead and produce the 125-120 result.
The official NBA game summary confirms the same quarter-by-quarter scoring and final score. (NBA.com)
Final Team Comparison
| Statistic | Chicago Bulls | Orlando Magic |
| Points | 120 | 125 |
| Field Goals | 44-88 | 45-88 |
| Field Goal % | 50.0% | 51.1% |
| 3-Pointers | 16-37 | 9-33 |
| 3PT % | 43.2% | 27.3% |
| Free Throws | 16-22 | 26-33 |
| FT % | 72.7% | 78.8% |
| Rebounds | 43 | 46 |
| Assists | 30 | 25 |
| Turnovers | 20 | 17 |
| Steals | 9 | 12 |
| Blocks | 4 | 11 |
This table immediately reveals one of the most interesting features of the game.
Chicago was substantially better from three-point range. The Bulls made 16 threes compared with Orlando’s nine, a seven-three difference. Chicago also had five more assists.
Yet Orlando won.
That happened because basketball efficiency cannot be judged from three-point shooting alone. Orlando had a 10-point advantage in free throw makes, three more rebounds, three fewer turnovers, three more steals, and seven more blocks. Those defensive possessions and additional free throws created enough value to offset Chicago’s perimeter shooting advantage.
The official NBA box score records the same team totals. (NBA.com)
Desmond Bane Dominates the Scoring Battle
The most important individual number in the game was Desmond Bane’s 37 points.
Bane finished 12-of-17 from the field, which works out to 70.6% shooting. He also went 3-of-7 from three-point range and a perfect 10-of-10 at the free throw line.
His complete line was:
37 points, 12-17 FG, 3-7 3PT, 10-10 FT, 6 rebounds, 5 assists, 2 turnovers, 1 steal, +7.
What makes the performance especially significant is how Bane distributed his scoring.
He was productive throughout the game, but his fourth-quarter impact was decisive. The NBA’s game recap states that he scored 18 points in the final period. He hit a go-ahead three-pointer with 3:23 remaining and then converted a late free throw as Orlando protected its advantage. (NBA.com)
That is an important distinction when evaluating player statistics.
A 37-point game is impressive by itself. A 37-point game with 18 points in the fourth quarter during a five-point victory provides much stronger evidence of direct game-changing impact.
Bane also avoided excessive mistakes. He committed only two turnovers while producing five assists. That gave Orlando scoring efficiency without creating many additional possessions for Chicago.
Franz Wagner Provides a Strong Second Scoring Option
Franz Wagner finished with 25 points and was one of Orlando’s most efficient scorers.
His final line:
25 points, 11-18 FG, 0-2 3PT, 3-3 FT, 6 rebounds, 2 assists, 5 turnovers, 2 steals, 1 block.
Wagner’s 11 made field goals were the second-highest total for either team, behind Bane’s 12.
His 61.1% field goal percentage was also excellent. Although he did not make a three-pointer, Orlando did not need him to become a perimeter shooter because he was highly effective inside the three-point line.
The five turnovers are worth noting, however. Wagner’s offensive efficiency was strong, but the turnovers reduced some of the value he created.
His defensive contributions helped compensate. Two steals and a block gave him additional impact beyond his scoring.
Anthony Black’s Two-Way Contribution Stands Out
Anthony Black produced one of the most complete statistical performances of the night.
He finished with:
22 points, 8-15 FG, 2-5 3PT, 4-6 FT, 9 rebounds, 3 assists, 1 turnover, 2 blocks, +25.
The +25 plus-minus was the best mark among the players listed in the supplied game statistics.
Black’s 22 points tied Josh Giddey’s scoring total, but the supporting numbers were very different. Black nearly recorded a double-double, collected nine rebounds, committed only one turnover, and added two blocks.
The rebounding number is particularly important because Orlando finished with a 46-43 overall advantage.
Black also shot 53.3% from the field and connected on two of his five three-point attempts.
For readers analyzing player performance beyond points, this is exactly the type of box score that deserves attention. His production was spread across scoring, rebounding, ball security, and defense.
Josh Giddey Leads the Bulls
Josh Giddey was Chicago’s leading scorer with 22 points.
His final statistics were:
22 points, 8-14 FG, 3-6 3PT, 3-5 FT, 9 rebounds, 6 assists, 8 turnovers, 3 steals, 1 block, +5.
There is a lot to like in that line.
Giddey shot 57.1% from the field, made half of his three-point attempts, grabbed nine rebounds, handed out six assists, collected three steals, and added a block.
But the eight turnovers are the obvious weakness.
That number was the highest individual turnover total in the game and accounted for a significant portion of Chicago’s 20 turnovers.
This is an important lesson when reading the chicago bulls vs orlando magic match player stats. A player can have strong scoring efficiency and fill several statistical categories while still having one area that meaningfully affects the outcome.
Giddey’s +5 plus-minus also indicates that his overall floor impact was not simply negative despite the turnovers.
Matas Buzelis Delivers 21 Points
Matas Buzelis was another major offensive contributor for Chicago.
He recorded:
21 points, 7-16 FG, 2-7 3PT, 5-6 FT, 6 rebounds, 4 assists, 2 steals, 3 blocks, +5.
His three-point shooting was not especially efficient, with two makes on seven attempts, but he compensated with strong free throw shooting and contributions in several other categories.
The three blocks are particularly notable.
Chicago’s team total was only four blocks, meaning Buzelis accounted for three of them. That gave the Bulls a defensive presence that was not fully reflected in the final team result.
His six rebounds and four assists also demonstrate that his impact was broader than scoring.
Nikola Vucevic Controls the Glass
Nikola Vucevic produced Chicago’s best rebounding performance.
He finished with:
20 points, 9-13 FG, 1-2 3PT, 1-2 FT, 11 rebounds, 5 assists, 2 turnovers, 2 steals, +12.
The 11 rebounds were the highest total by any player in the game.
Vucevic was also extremely efficient from the field, making nine of his 13 attempts for a 69.2% field goal percentage.
His five assists were another valuable contribution. For a center, combining 20 points, 11 rebounds, and five assists provides a broad offensive profile.
His +12 plus-minus was also the best figure among Chicago’s leading contributors.
This is why box score analysis should not focus solely on scoring leaders. Vucevic did not lead Chicago in points, but his combination of efficiency, rebounding, passing, and plus-minus made his performance highly significant.
Ayo Dosunmu Adds Playmaking and Perimeter Shooting
Ayo Dosunmu finished with 18 points and seven assists.
His line:
18 points, 6-13 FG, 4-6 3PT, 2-2 FT, 3 rebounds, 7 assists, 4 turnovers, 1 steal, +8.
Dosunmu’s four three-pointers were tied for the highest individual total on the Bulls.
His 66.7% three-point shooting was particularly useful because Chicago’s overall success from deep was one of its biggest offensive advantages.
The seven assists also show that he was an important creator.
Like Giddey, however, turnovers were an issue. Dosunmu committed four, which contributed to Chicago’s team total of 20.
Tre Jones Provides Efficient Scoring
Tre Jones had a relatively unusual statistical profile.
He scored 20 points on only 10 field goal attempts, going 7-for-10 from the floor and 2-for-3 from three-point range. He also made four of five free throws.
His line was:
20 points, 7-10 FG, 2-3 3PT, 4-5 FT, 1 rebound, 3 assists, 1 turnover, -16.
The shooting efficiency was excellent.
However, his -16 plus-minus illustrates another important point about basketball statistics. Individual scoring efficiency does not necessarily equal positive team results during a player’s minutes.
Jones produced 20 points efficiently, but the Bulls were outscored significantly during his time on the court according to the supplied plus-minus figure.
Wendell Carter Jr. Gives Orlando Interior Efficiency
Wendell Carter Jr. scored 17 points on 6-of-8 shooting.
His complete line was:
17 points, 6-8 FG, 1-2 3PT, 4-6 FT, 6 rebounds, 1 assist, 1 steal, 1 block, -1.
His 75% field goal percentage was one of the best marks among the game’s high-volume scorers.
Carter also added six rebounds and contributed on defense.
His performance was especially useful because Orlando already had major scoring production from Bane, Wagner, and Black. Carter did not need to dominate possessions to remain valuable.
Jalen Suggs Impacts the Game Without Efficient Shooting
Jalen Suggs had a difficult shooting night but made a significant defensive contribution.
He finished with:
10 points, 3-13 FG, 2-10 3PT, 2-2 FT, 4 rebounds, 4 assists, 4 turnovers, 5 steals, 1 block, -9.
The five steals were the highest individual total in the game.
That defensive activity matters when examining Orlando’s 12 team steals.
Suggs struggled offensively, making only 23.1% of his field goal attempts and 20% of his three-point attempts. But his defensive pressure created extra possessions and helped Orlando maintain its disruptive defensive approach.
This is another example of why a player’s performance should not be judged by points alone.
Goga Bitadze Protects the Rim
Goga Bitadze finished with eight points, five rebounds, three assists, one steal, and four blocks.
His line was:
8 points, 3-5 FG, 2-2 FT, 5 rebounds, 3 assists, 1 steal, 4 blocks, +6.
The four blocks were the most in the game.
Orlando finished with 11 blocks as a team, compared with Chicago’s four.
That seven-block difference is one of the clearest statistical explanations for Orlando’s defensive success.
Bitadze’s contribution was therefore much larger than his eight points suggest.
Tyus Jones Makes an Impact as a Passer
Tyus Jones did not score in the game, going 0-for-2 from the field and 0-for-2 from three-point range.
But he finished with six assists, one steal, and only one turnover.
His +13 plus-minus was also one of Orlando’s better marks.
This is a useful reminder that a point guard can influence the game through ball movement even without scoring.
Jones helped Orlando create offensive opportunities while avoiding the kind of turnover volume that hurt Chicago.
Team Shooting Tells an Interesting Story
At first glance, Chicago’s shooting numbers look strong enough to suggest the Bulls should have won.
Chicago shot:
- 50.0% from the field
- 43.2% from three
- 72.7% from the free throw line
Orlando shot:
- 51.1% from the field
- 27.3% from three
- 78.8% from the free throw line
Chicago’s seven-three advantage from beyond the arc was substantial.
Yet Orlando made 26 free throws compared with Chicago’s 16.
That produced a 10-point advantage in made free throws.
The difference in three-point makes was seven in Chicago’s favor, while the difference in free throws was 10 in Orlando’s favor.
That alone does not explain every possession, but it demonstrates why Orlando could survive a major disadvantage from three-point range.
Turnovers Helped Orlando Create Extra Opportunities
Chicago committed 20 turnovers.
Orlando committed 17.
The three-turnover difference may appear small, but it mattered in a game decided by only five points.
The official NBA game summary also records 20 turnovers for Chicago and 17 for Orlando. (NBA.com)
Giddey’s eight turnovers were the largest individual contribution to Chicago’s turnover total.
Dosunmu had four, Suggs had four for Orlando, and Wagner had five.
Chicago’s 30 assists show that the Bulls were capable of moving the ball effectively. The problem was that some of those possessions ended in turnovers rather than shots.
That distinction becomes particularly important in close games.
Orlando’s Defensive Numbers Were the Difference
The strongest statistical argument for Orlando’s victory is its defensive production.
The Magic recorded:
- 12 steals
- 11 blocks
- 46 rebounds
- 17 turnovers committed
Chicago recorded:
- 9 steals
- 4 blocks
- 43 rebounds
- 20 turnovers committed
Orlando therefore had a seven-block advantage and a three-steal advantage.
Those numbers suggest the Magic were able to disrupt Chicago’s attempts at the rim while also creating additional possessions through steals.
Chicago’s offense still produced 120 points, which demonstrates how effective the Bulls were in many areas. But Orlando found more ways to interfere with that offense.
The Fourth Quarter Decided the Game
The first three quarters were extremely competitive.
Orlando led 29-26 after the opening quarter.
Chicago responded in the second quarter, winning the period 27-24 and taking momentum into halftime.
The third quarter was perfectly even at 32-32.
That meant the game entered the final period with very little separating the teams.
Then Orlando produced a 40-point fourth quarter.
Chicago also scored 35, so the Bulls did not collapse offensively. Instead, Orlando simply produced the more effective closing period.
The late sequence illustrates this clearly.
Bane’s scoring pushed Orlando ahead, Wagner added a key basket, Bane converted two free throws, and Wendell Carter Jr. finished the scoring with a cutting dunk. The NBA play-by-play records the closing sequence and final 125-120 score. (NBA.com)
The official NBA recap specifically highlights Bane’s 18 fourth-quarter points and his late three-pointer as central moments in the win. (NBA.com)
Chicago’s 15-Point Lead Did Not Hold
One of the most revealing details of the game is that Chicago built a substantial advantage during the third quarter.
According to the official game recap, the Bulls led by as many as 15 points and held Orlando without a field goal for the first five minutes of the third period. (NBA.com)
That makes the final result even more significant from a game-flow perspective.
Orlando did not simply control the game from beginning to end.
The Magic had to respond to a major Chicago run.
Bane’s three-pointer and Noah Penda’s driving dunk helped Orlando erase the deficit, with the teams tied at 85 entering the fourth quarter according to the NBA recap. (NBA.com)
That comeback changed the game from a potential Chicago victory into a tightly contested fourth-quarter battle.
What the Chicago Bulls Needed More Of
Chicago’s numbers suggest that the Bulls did not need a complete offensive overhaul.
They scored 120 points.
They shot 50% from the field.
They made 16 three-pointers.
They recorded 30 assists.
Instead, the most obvious areas for improvement were possession control and defensive disruption.
The 20 turnovers were costly.
The four blocks were also well below Orlando’s 11.
Chicago’s 9 steals were respectable, but Orlando’s 12 gave the Magic additional transition opportunities.
The Bulls also allowed Orlando to shoot 51.1% overall.
In a five-point game, small differences become decisive.
What Orlando Did Particularly Well
Orlando’s biggest strength was balance.
Bane scored 37.
Wagner scored 25.
Black scored 22.
Carter Jr. scored 17.
That gave Orlando four players with at least 17 points.
The Magic also received valuable contributions from Bitadze, Suggs, and Jones in areas beyond scoring.
The result was an offense that did not depend on one player for every successful possession.
Bane was clearly the leading scorer, but Orlando had multiple ways to generate points.
Defensively, the Magic’s 11 blocks and 12 steals provided another layer of pressure.
Comparing the Main Scoring Leaders
| Player | Team | Points | FG | 3PT | REB | AST |
| Desmond Bane | Orlando | 37 | 12-17 | 3-7 | 6 | 5 |
| Franz Wagner | Orlando | 25 | 11-18 | 0-2 | 6 | 2 |
| Anthony Black | Orlando | 22 | 8-15 | 2-5 | 9 | 3 |
| Josh Giddey | Chicago | 22 | 8-14 | 3-6 | 9 | 6 |
| Matas Buzelis | Chicago | 21 | 7-16 | 2-7 | 6 | 4 |
| Nikola Vucevic | Chicago | 20 | 9-13 | 1-2 | 11 | 5 |
| Tre Jones | Chicago | 20 | 7-10 | 2-3 | 1 | 3 |
| Ayo Dosunmu | Chicago | 18 | 6-13 | 4-6 | 3 | 7 |
| Wendell Carter Jr. | Orlando | 17 | 6-8 | 1-2 | 6 | 1 |
Bane’s 37 points clearly separated him from the rest of the scoring group.
However, Chicago had four players with at least 18 points among its primary contributors, showing that the Bulls had considerable scoring balance.
The Most Important Statistical Takeaways
Several numbers deserve special attention when evaluating this matchup.
1. Orlando won despite making seven fewer three-pointers
Chicago made 16 threes.
Orlando made nine.
That is a significant shooting advantage for the Bulls, yet it was not enough.
2. Free throws favored Orlando
Orlando made 26 free throws.
Chicago made 16.
The 10-made-free-throw difference was one of the clearest ways Orlando generated points without relying on three-point shooting.
3. Orlando blocked seven more shots
The Magic had 11 blocks.
The Bulls had four.
Goga Bitadze alone had four blocks, while Anthony Black added two.
4. Chicago had more assists
Chicago finished with 30 assists compared with Orlando’s 25.
This shows that Orlando did not win because of superior assist production.
Instead, the Magic found advantages through shooting efficiency, free throws, defense, rebounding, and turnovers.
5. Chicago had more turnovers
The Bulls committed 20 turnovers.
Orlando committed 17.
In a five-point game, giving away three additional possessions can have an outsized effect.
Full Chicago Bulls Player Statistics
The supplied box score gives the following individual production for Chicago:
| Player | PTS | REB | AST | STL | BLK | FG |
| Josh Giddey | 22 | 9 | 6 | 3 | 1 | 8-14 |
| Matas Buzelis | 21 | 6 | 4 | 2 | 3 | 7-16 |
| Nikola Vucevic | 20 | 11 | 5 | 2 | 0 | 9-13 |
| Tre Jones | 20 | 1 | 3 | 0 | 0 | 7-10 |
| Ayo Dosunmu | 18 | 3 | 7 | 1 | 0 | 6-13 |
| Julian Phillips | 10 | 3 | 0 | 0 | 0 | 4-7 |
| Patrick Williams | 6 | 6 | 1 | 0 | 0 | 2-7 |
| Emanuel Miller | 3 | 0 | 2 | 1 | 0 | 1-2 |
| Kevin Huerter | 0 | 0 | 0 | 0 | 0 | 0-3 |
| Jevon Carter | 0 | 0 | 0 | 0 | 0 | 0-2 |
The most productive Chicago players combined scoring with secondary contributions, but the team’s overall turnover total remained a problem.
Full Orlando Magic Player Statistics
Orlando’s main statistical contributors were:
| Player | PTS | REB | AST | STL | BLK | FG |
| Desmond Bane | 37 | 6 | 5 | 1 | 0 | 12-17 |
| Franz Wagner | 25 | 6 | 2 | 2 | 1 | 11-18 |
| Anthony Black | 22 | 9 | 3 | 0 | 2 | 8-15 |
| Wendell Carter Jr. | 17 | 6 | 1 | 1 | 1 | 6-8 |
| Jalen Suggs | 10 | 4 | 4 | 5 | 1 | 3-13 |
| Goga Bitadze | 8 | 5 | 3 | 1 | 4 | 3-5 |
| Noah Penda | 5 | 5 | 0 | 0 | 0 | 2-4 |
| Jonathan Isaac | 1 | 2 | 0 | 0 | 1 | 0-1 |
| Tyus Jones | 0 | 0 | 6 | 1 | 0 | 0-2 |
| Tristan da Silva | 0 | 2 | 1 | 1 | 1 | 0-4 |
This table demonstrates how Orlando’s production extended beyond Bane’s scoring.
Why the Matchup Was So Close
The final five-point margin does not fully communicate how evenly matched the teams were for much of the night.
Chicago had the better three-point shooting volume.
Chicago had more assists.
Chicago had several highly efficient scorers.
The Bulls also built a sizable lead during the third quarter.
Orlando responded with defensive pressure and a major fourth-quarter scoring effort.
The Magic’s 40-point fourth quarter was therefore the defining team statistic.
The game was not decided by one massive overall shooting disparity. It was decided by a combination of late scoring, free throws, defensive plays, and possession management.
Season Series Context
This result left the season series tied 1-1 based on the supplied matchup data.
The previous meeting was a 110-98 Chicago victory on October 26, 2025.
This second meeting therefore gave Orlando an opportunity to level the season matchup.
The later scheduled meetings in the supplied data include a January 3 game and an April 11 matchup, providing additional opportunities for the teams to separate themselves in the season series.
When analyzing a multi-game season matchup, it is useful to compare the same categories across every meeting. Points per possession, turnover rate, free throw frequency, offensive rebounding, and three-point volume can reveal whether a team’s success was repeatable or specific to one game.
How to Analyze These Player Stats Correctly
Readers often search for player statistics because they want more than a final score.
A useful analysis should answer several questions.
First, who scored the most?
Bane clearly led with 37 points.
Second, who contributed across multiple categories?
Anthony Black and Vucevic stand out because of their combination of scoring and rebounding.
Third, who created opportunities for teammates?
Dosunmu led Chicago with seven assists, while Jones led Orlando with six.
Fourth, who created defensive events?
Suggs recorded five steals, while Bitadze had four blocks.
Finally, which team converted those individual performances into winning possessions?
In this game, Orlando did.
That is the difference between reading a box score and understanding it.
Where the Official Numbers Matter
For readers who want to verify individual minutes, shooting splits, rebounds, assists, steals, blocks, turnovers, and plus-minus figures, the official NBA box score provides the primary statistical record for the matchup. (NBA.com)
Using an official box score is especially important when analyzing player statistics because small differences in totals can change an interpretation.
For example, Bane’s 37 points were not simply a high scoring total. His 12-of-17 shooting, 10-of-10 free throw shooting, five assists, and 18 fourth-quarter points explain why his scoring had such a direct connection to Orlando’s victory.
Frequently Asked Questions
Who was the top scorer in the Chicago Bulls vs Orlando Magic game?
Desmond Bane was the top scorer with 37 points for Orlando. He shot 12-of-17 from the field and made all 10 of his free throws.
What was the final score between the Bulls and Magic?
The Orlando Magic defeated the Chicago Bulls 125-120.
Who led the Bulls in scoring?
Josh Giddey led Chicago with 22 points. He also recorded nine rebounds, six assists, three steals, and one block.
Who had the most rebounds in the game?
Nikola Vucevic led all players with 11 rebounds. Anthony Black was Orlando’s top rebounder with nine.
Who had the most assists?
Ayo Dosunmu led Chicago with seven assists, while Tyus Jones led Orlando with six.
Why did Orlando win despite Chicago making more three-pointers?
Chicago made 16 three-pointers compared with Orlando’s nine, but the Magic gained major advantages in free throws, blocks, steals, rebounds, and turnovers. Orlando made 26 free throws and recorded 11 blocks and 12 steals.
Conclusion
The chicago bulls vs orlando magic match player stats show a game in which traditional shooting numbers did not tell the entire story.
Chicago shot 50% from the field and made 16 three-pointers. The Bulls also recorded 30 assists and received strong individual performances from Josh Giddey, Matas Buzelis, Nikola Vucevic, Tre Jones, and Ayo Dosunmu.
Orlando answered with greater defensive disruption and more opportunities at the free throw line. The Magic recorded 11 blocks, 12 steals, 46 rebounds, and 26 made free throws. Desmond Bane’s 37-point performance, particularly his 18 fourth-quarter points, became the defining individual contribution.
The final five-point margin reflected a game that remained competitive deep into the fourth quarter. Orlando’s ability to finish the game with 40 points in the final period ultimately proved decisive.
From an analytical standpoint, the matchup is a strong example of why player statistics should be examined collectively. Scoring efficiency, shooting volume, turnovers, assists, rebounding, free throws, steals, blocks, and fourth-quarter production all contributed to the final result. Looking at those categories together provides a much clearer explanation of how Orlando turned a competitive contest into a 125-120 victory.