Cleveland Cavaliers vs Dallas Mavericks Match Player Stats
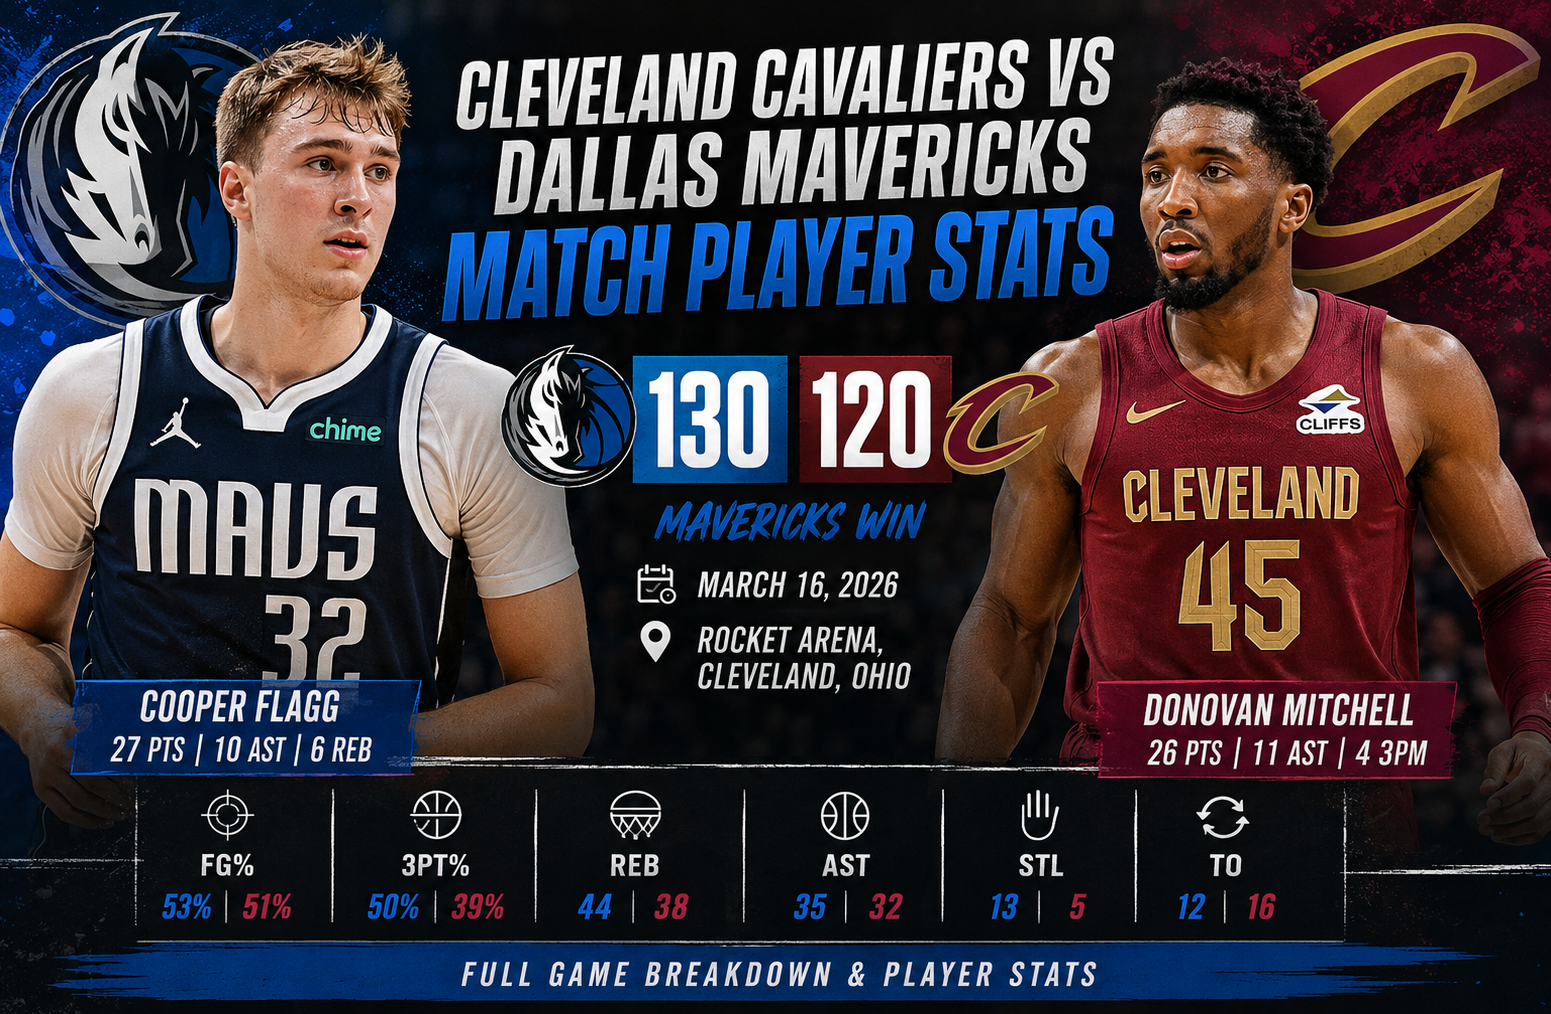
The Cleveland Cavaliers vs Dallas Mavericks match player stats reveal how Dallas produced an impressive 130-120 road victory through efficient shooting, balanced scoring, defensive pressure, and a dominant third-quarter performance. Played at Rocket Arena in Cleveland, the March 15, 2026, matchup featured outstanding individual performances from Cooper Flagg, Naji Marshall, Donovan Mitchell, and Max Strus. Dallas found its offensive rhythm at the right time, while Cleveland struggled to contain the Mavericks during a decisive stretch in the second half.
Cooper Flagg led Dallas with 27 points and 10 assists, demonstrating his ability to influence the game as both a scorer and playmaker. Naji Marshall delivered another important contribution with 25 points, five rebounds, and seven assists. P.J. Washington added 20 points and 11 rebounds, giving the Mavericks another reliable offensive option. For Cleveland, Donovan Mitchell recorded 26 points and 11 assists, while Max Strus scored 24 points and made six three-pointers.
Although Cleveland had several impressive individual performances, Dallas controlled the most important statistical categories. The Mavericks shot 53% from the field, converted 50% of their three-point attempts, and recorded 35 assists. Their defensive pressure also produced 13 steals, helping them create additional scoring opportunities.
This detailed game breakdown examines the final score, individual player performances, shooting efficiency, team statistics, quarter-by-quarter results, and the major factors that determined the outcome. It also explains what the numbers reveal about both teams and why Dallas managed to leave Cleveland with an important road victory.
Cleveland Cavaliers vs Dallas Mavericks Match Player Stats: Game Overview
The Mavericks and Cavaliers entered this matchup with different objectives and contrasting recent performances. Cleveland had already demonstrated its offensive strength in the first meeting between the teams, defeating Dallas 138-105. The second contest provided Dallas with an opportunity to respond.
The Mavericks delivered that response with a 10-point victory.
VISITING TEAM
Dallas Mavericks
130
WINNER
VS
HOME TEAM
Cleveland Cavaliers
120
FINAL
| Game information | Details |
| Date in Cleveland | March 15, 2026 |
| Date in Pakistan | March 16, 2026 |
| Venue | Rocket Arena |
| Location | Cleveland, Ohio |
| Attendance | 19,432 |
| Dallas record | 23-45 |
| Cleveland record | 41-27 |
| Game duration | 2 hours, 11 minutes |
| Officials | Brian Forte, Tyler Ford, Jenna Schroeder |
The NBA records the game under March 15 in Cleveland. The March 16 date reflects the local calendar date in Pakistan.
The result was particularly interesting because Dallas had struggled in its recent meetings with Cleveland. The Mavericks entered this game after losing seven consecutive contests against the Cavaliers. Their improved shooting and stronger defensive activity helped them end that run.
Cleveland remained competitive throughout the first half, but the Mavericks created separation after halftime. Dallas combined efficient perimeter shooting with better ball movement and converted defensive opportunities into points.
The final 130-120 score reflected a game in which both teams generated plenty of offense, but Dallas executed more consistently.
Quarter-by-Quarter Score
The scoring progression shows exactly where the game changed.
| Quarter | Dallas Mavericks | Cleveland Cavaliers |
| First Quarter | 35 | 31 |
| Second Quarter | 25 | 28 |
| Third Quarter | 40 | 27 |
| Fourth Quarter | 30 | 34 |
| Final Score | 130 | 120 |
Dallas started strongly, scoring 35 points in the opening quarter. Cleveland responded with 28 points in the second period and entered halftime within one possession of the Mavericks.
The third quarter became the defining period.
Dallas scored 40 points while limiting Cleveland to 27. That 13-point difference transformed a competitive game into a much more difficult challenge for the home team.
Cleveland improved its offensive production in the fourth quarter, scoring 34 points. However, Dallas maintained enough separation to protect its advantage and secure the victory.
Complete Dallas Mavericks Player Stats
Dallas received valuable contributions from several players rather than relying entirely on one scorer. Cooper Flagg led the offensive attack, but Naji Marshall and P.J. Washington were equally important to the team’s overall production.
The Mavericks also received useful minutes from their supporting players, helping maintain offensive pressure throughout the contest.
Dallas Mavericks Player Statistics Table
| Player | Points | Rebounds | Assists | Steals | Blocks |
| Cooper Flagg | 27 | 6 | 10 | 0 | 2 |
| Naji Marshall | 25 | 5 | 7 | 1 | 0 |
| P.J. Washington | 20 | 11 | 2 | 5 | 1 |
| Ryan Nembhard | 11 | 3 | 3 | 2 | 0 |
| Brandon Williams | 12 | 2 | 5 | 2 | 0 |
| Max Christie | 9 | 2 | 5 | 1 | 1 |
| John Poulakidas | 10 | 3 | 0 | 1 | 0 |
| Khris Middleton | 5 | 5 | 2 | 1 | 0 |
| Marvin Bagley III | 6 | 5 | 0 | 0 | 1 |
| Caleb Martin | 5 | 1 | 0 | 0 | 0 |
Dallas finished with 130 points, and its leading performers combined scoring with playmaking and defensive contributions.
Cooper Flagg’s Outstanding All-Around Performance
Cooper Flagg was Dallas’s leading scorer and one of the most influential players on the court.
His final numbers included:
- 27 points
- 6 rebounds
- 10 assists
- 2 blocks
- 10-of-17 field-goal shooting
- 1-of-3 three-point shooting
- 6-of-8 free-throw shooting
Flagg’s 27-point performance demonstrated his scoring ability, but his 10 assists were just as important.
He created opportunities for teammates and helped Dallas maintain offensive movement. His passing allowed the Mavericks to generate scoring chances without depending exclusively on individual isolation plays.
His field-goal efficiency was another positive factor. Making 10 of 17 attempts meant he converted approximately 58.8% of his shots.
That efficiency matters because a player can score heavily while consuming a large number of possessions. Flagg produced 27 points without needing an unusually high volume of attempts.
His two blocks also added value on the defensive end.
One of the most interesting aspects of his performance was the combination of scoring and playmaking. A player who can attract defensive attention and then find open teammates creates difficult decisions for opposing defenses.
Cleveland had to respect Flagg’s ability to attack the basket and score from different areas. At the same time, his passing made it difficult to focus defensive attention entirely on him.
His performance was therefore about much more than reaching the highest individual scoring total for Dallas.
Naji Marshall’s Efficient Scoring Contribution
Naji Marshall delivered one of the most efficient offensive performances of the evening.
He recorded:
- 25 points
- 5 rebounds
- 7 assists
- 1 steal
- 8-of-12 field-goal shooting
- 1-of-1 three-point shooting
- 8-of-8 free-throw shooting
Marshall’s 25 points came on excellent shooting efficiency.
He converted eight of his 12 field-goal attempts, giving him a field-goal percentage of 66.7%. He also made every free throw he attempted.
His perfect 8-of-8 performance from the free-throw line was particularly valuable because free throws allowed Dallas to collect points without needing another field-goal attempt.
Marshall also contributed seven assists. This showed that he was not simply looking to finish possessions himself.
His ability to score and create opportunities helped Dallas maintain offensive balance. Cleveland could not concentrate all its defensive resources on Flagg because Marshall remained a consistent scoring threat.
His performance was a major reason the Mavericks had multiple players capable of controlling offensive possessions.
P.J. Washington’s Dominant Two-Way Performance
P.J. Washington delivered one of the most complete performances in the game.
His statistical contribution included:
- 20 points
- 11 rebounds
- 2 assists
- 5 steals
- 1 block
- 8-of-16 field-goal shooting
- 3-of-4 three-point shooting
Washington recorded a double-double with 20 points and 11 rebounds.
His offensive production was important, but his defensive statistics deserve equal attention.
Five steals represented a significant contribution to Dallas’s defensive effort. Those plays helped disrupt Cleveland’s offensive rhythm and created additional opportunities for the Mavericks.
Washington also converted three of his four three-point attempts. That gave Dallas another effective perimeter shooter and made Cleveland’s defensive assignments more complicated.
His 11 rebounds helped Dallas compete for possession around the basket.
When a forward can contribute scoring, rebounding, perimeter shooting, and defensive pressure in the same game, his overall impact becomes much greater than his points total suggests.
Washington was an important contributor to the Mavericks’ success on both ends of the floor.
Ryan Nembhard’s Valuable Backcourt Contribution
Ryan Nembhard finished with 11 points, three rebounds, and three assists.
He made four of his 10 field-goal attempts and converted three of seven three-point attempts.
His perimeter shooting provided additional spacing for Dallas.
Nembhard’s contribution was important because the Mavericks needed several players to support their leading scorers. His ability to make three-pointers helped prevent Cleveland from concentrating its defense around Flagg and Marshall.
He also recorded two steals, contributing to Dallas’s defensive activity.
Although his scoring total was not among the team’s highest, his contribution helped the Mavericks maintain offensive pressure.
Brandon Williams Provides Bench Scoring
Brandon Williams added 12 points and five assists.
His performance gave Dallas another useful offensive option, particularly when the primary creators needed support.
Williams converted four of seven field-goal attempts and made all four of his free throws.
His ability to contribute as a scorer and passer was valuable because Dallas needed production from its supporting lineup.
Five assists also demonstrated his role in moving the ball and creating opportunities for other players.
A strong supporting performance can make a major difference in games involving high-scoring offenses. Williams helped Dallas maintain its offensive production without placing excessive responsibility on Flagg.
Max Christie Adds Shooting and Playmaking
Max Christie recorded nine points, two rebounds, and five assists.
He shot three-of-four from the field and made two of his three three-point attempts.
His shooting efficiency was particularly impressive.
Christie did not need a large number of attempts to contribute offensively. He made the most of his opportunities while also helping teammates through his passing.
His five assists gave Dallas another player capable of creating offense.
This reduced the burden on Flagg and Marshall and helped the Mavericks maintain their offensive rhythm.
John Poulakidas Makes an Important Contribution
John Poulakidas finished with 10 points, three rebounds, and two three-pointers.
He converted four of six field-goal attempts and made two of four attempts from beyond the arc.
His contribution was useful because Dallas received additional scoring from its supporting players.
When a team receives points from several different lineup options, opposing defenses have fewer opportunities to focus exclusively on the leading scorers.
Poulakidas provided that additional offensive threat.
Other Dallas Mavericks Contributors
Several other players helped Dallas complete its 130-point performance.
Khris Middleton recorded five points and five rebounds. Although his scoring contribution was limited, his rebounding helped the Mavericks maintain possession and compete around the basket.
Marvin Bagley III added six points and five rebounds. His presence provided additional frontcourt support and helped Dallas maintain its interior rotation.
Caleb Martin contributed five points and added another scoring option.
These contributions demonstrate that Dallas benefited from a collective offensive performance rather than depending on only two or three players.
Complete Cleveland Cavaliers Player Stats
Cleveland had several strong individual performances, particularly from Donovan Mitchell and Max Strus.
The Cavaliers scored 120 points, which would normally represent a productive offensive performance. However, their defensive struggles and lower efficiency in several important categories prevented them from matching Dallas.
Cleveland Cavaliers Player Statistics Table
| Player | Points | Rebounds | Assists | Steals | Blocks |
| Donovan Mitchell | 26 | 1 | 11 | Not specified | Not specified |
| Max Strus | 24 | 8 | Not specified | Not specified | Not specified |
| Evan Mobley | 18 | 11 | 4 | Not specified | 4 |
| James Harden | 13 | 5 | 7 | Not specified | Not specified |
| Dean Wade | 12 | 5 | Not specified | Not specified | Not specified |
| Thomas Bryant | 10 | 2 | Not specified | Not specified | Not specified |
| Dennis Schroder | 8 | 1 | 6 | Not specified | Not specified |
| Keon Ellis | 5 | 5 | 3 | Not specified | Not specified |
| Nae’Qwan Tomlin | 4 | Not specified | Not specified | Not specified | Not specified |
The table focuses on the player statistics available in the supplied game data. Unspecified individual defensive numbers are intentionally not estimated.
Donovan Mitchell Leads Cleveland’s Offense
Donovan Mitchell was Cleveland’s leading scorer, finishing with 26 points and 11 assists.
His performance included:
- 26 points
- 1 rebound
- 11 assists
- 10-of-24 field-goal shooting
- 4-of-11 three-point shooting
Mitchell was an important part of Cleveland’s offensive production.
His 11 assists demonstrated his playmaking ability and willingness to involve teammates. He helped create scoring opportunities and kept Cleveland competitive during different stages of the contest.
However, his shooting efficiency was not as strong as Flagg’s.
Mitchell converted 10 of his 24 field-goal attempts, producing a field-goal percentage of approximately 41.7%.
His four three-pointers helped Cleveland generate perimeter scoring, but his overall shooting volume was considerably higher.
This difference is worth considering when evaluating individual scoring performances.
Both Flagg and Mitchell finished with at least 26 points, but Flagg needed fewer attempts to reach his total.
Mitchell also faced the challenge of trying to create offense against a Dallas defense that generated 13 steals.
Despite Cleveland’s defeat, his 26-point and 11-assist performance remained one of the most important individual contributions in the game.
Max Strus Delivers an Outstanding Three-Point Performance
Max Strus produced one of Cleveland’s most efficient scoring performances.
He finished with:
- 24 points
- 8 rebounds
- 7-of-9 field-goal shooting
- 6-of-7 three-point shooting
His three-point accuracy was exceptional.
Strus converted six of his seven attempts from beyond the arc, giving him an impressive 85.7% success rate.
This performance demonstrated how dangerous he could become when given opportunities to shoot from the perimeter.
He was also highly efficient overall, making seven of his nine field-goal attempts.
Strus gave Cleveland an important scoring boost and helped the Cavaliers remain competitive despite Dallas’s strong offensive performance.
However, even his exceptional shooting was not enough to overcome the Mavericks’ collective efficiency.
Dallas received more consistent production from multiple players and made better use of its free-throw opportunities.
Strus’s performance remains one of the clearest examples of individual shooting excellence in this matchup.
Evan Mobley Contributes a Double-Double
Evan Mobley recorded 18 points, 11 rebounds, four assists, and four blocks.
His performance demonstrated his value as an interior scorer and defensive presence.
The 18 points helped Cleveland maintain its offensive production, while his 11 rebounds provided important support around the basket.
His four blocks were especially notable.
Mobley’s defensive presence helped Cleveland challenge Dallas near the rim. However, the Mavericks found ways to score through perimeter shooting, ball movement, and opportunities created by defensive breakdowns.
His four assists also showed that he contributed beyond scoring and rebounding.
Mobley’s overall numbers represented a productive individual performance, even though Cleveland did not receive enough defensive support to control the game.
James Harden’s Playmaking and Scoring
James Harden contributed 13 points, five rebounds, and seven assists.
His role involved creating scoring opportunities and helping Cleveland maintain offensive organization.
Harden’s seven assists were an important part of the Cavaliers’ ball movement.
His five rebounds also added value, particularly because Cleveland needed additional contributions from its guards and perimeter players.
Although his scoring total was lower than Mitchell’s and Strus’s, Harden provided another playmaking option.
The Cavaliers had three players capable of contributing through scoring and passing, but their combined production could not overcome Dallas’s greater shooting efficiency.
Dean Wade Provides Supporting Offense
Dean Wade finished with 12 points and five rebounds.
His scoring contribution helped Cleveland distribute offensive responsibility across the lineup.
Wade’s five rebounds also provided additional frontcourt support.
Although he did not reach the scoring levels of Mitchell or Strus, his 12 points were useful in a game where Cleveland needed production from multiple players.
Thomas Bryant Adds Interior Scoring
Thomas Bryant recorded 10 points and two rebounds.
His offensive contribution helped Cleveland maintain its scoring total.
Bryant provided another option around the basket and gave the Cavaliers additional frontcourt depth.
His 10 points were valuable, although Cleveland needed stronger collective production to keep pace with Dallas’s offensive efficiency.
Dennis Schroder Helps Organize Cleveland’s Offense
Dennis Schroder finished with eight points, one rebound, and six assists.
His six assists were important because Cleveland needed additional playmaking beyond Mitchell and Harden.
Schroder helped move the ball and create opportunities for teammates.
Although his scoring total was relatively modest, his passing contribution helped maintain offensive activity.
Other Cleveland Contributors
Keon Ellis added five points, five rebounds, and three assists.
His contribution helped Cleveland receive additional production across different statistical categories.
Nae’Qwan Tomlin recorded four points, providing another scoring contribution.
These supporting performances helped Cleveland reach 120 points, but the Cavaliers were unable to match Dallas in the areas that ultimately decided the contest.
Dallas Mavericks vs Cleveland Cavaliers Team Statistics Comparison
Individual performances explain how particular players influenced the game. Team statistics provide a broader understanding of why Dallas won.
The Mavericks held advantages in several important categories, including shooting efficiency, rebounding, assists, free throws, and steals.
Complete Team Statistical Comparison
| Statistical Category | Dallas Mavericks | Cleveland Cavaliers |
| Total Points | 130 | 120 |
| Field Goals Made | 46 | 45 |
| Field Goals Attempted | 87 | 88 |
| Field-Goal Percentage | 53% | 51% |
| Three-Pointers Made | 15 | 16 |
| Three-Point Attempts | 30 | 41 |
| Three-Point Percentage | 50% | 39% |
| Free Throws Made | 23 | 14 |
| Free-Throw Attempts | 27 | 21 |
| Free-Throw Percentage | 85% | 67% |
| Total Rebounds | 44 | 38 |
| Assists | 35 | 32 |
| Turnovers | 12 | 16 |
| Steals | 13 | 5 |
| Blocks | 5 | 5 |
The statistical comparison reveals several important differences.
Dallas made only one more field goal than Cleveland, but its superior three-point and free-throw efficiency helped create the scoring difference.
The Mavericks also collected six more rebounds, recorded three additional assists, and committed four fewer turnovers.
The eight-steal advantage was another important factor.
Field-Goal Efficiency Favored Dallas
Dallas converted 46 of 87 field-goal attempts, while Cleveland made 45 of 88.
The difference in shooting percentage was relatively small.
Dallas shot approximately 52.9%, compared with Cleveland’s 51.1%.
Although the difference was less than two percentage points, Dallas made slightly better use of its opportunities.
More importantly, the Mavericks converted a significantly higher percentage of their three-point attempts.
This helped them create additional scoring value without needing to take substantially more shots.
Three-Point Shooting Created a Major Advantage
One of the most important differences appeared beyond the three-point line.
Dallas converted 15 of 30 attempts, producing a 50% shooting percentage.
Cleveland made 16 of 41 attempts, finishing at approximately 39%.
The Cavaliers actually made one more three-pointer than Dallas.
However, they needed 11 additional attempts to reach that total.
This is an important distinction when evaluating perimeter shooting.
A team can make more three-pointers but still be less efficient if it requires considerably more attempts.
Dallas benefited from better shot selection and more effective conversion.
The Mavericks’ 50% three-point performance helped them maintain offensive pressure and punish Cleveland whenever defensive coverage allowed an open perimeter opportunity.
Free-Throw Shooting Added Valuable Points
Dallas also created a major advantage at the free-throw line.
The Mavericks made 23 of 27 free throws, producing an 85% success rate.
Cleveland converted only 14 of 21 attempts, finishing at approximately 67%.
That meant Dallas scored nine more points from free throws.
In a game decided by 10 points, this difference was extremely significant.
Free throws are sometimes overlooked when analyzing basketball results because they do not involve the same type of movement or shot creation as field goals.
However, they remain an important part of offensive efficiency.
Dallas consistently converted its opportunities, while Cleveland left additional points at the line.
Rebounding Helped Dallas Control Possessions
The Mavericks collected 44 rebounds compared with Cleveland’s 38.
That six-rebound difference gave Dallas an advantage in controlling possessions.
Rebounding is important because it determines which team gains possession after missed shots.
Defensive rebounds help teams prevent second-chance opportunities, while offensive rebounds can create additional scoring chances.
Washington led Dallas with 11 rebounds.
Flagg, Marshall, and other contributors also helped the Mavericks compete around the basket.
Mobley led Cleveland’s rebounding effort with 11 boards, but the Cavaliers could not match Dallas’s overall team total.
The Mavericks’ collective rebounding performance was another important component of their victory.
Assists Demonstrated Better Offensive Distribution
Dallas recorded 35 assists, while Cleveland finished with 32.
The three-assist difference might appear relatively small, but it reflects an important aspect of the Mavericks’ offense.
Flagg recorded 10 assists, Marshall added seven, and several other players also contributed as playmakers.
This distribution allowed Dallas to generate scoring opportunities from different areas of the lineup.
Cleveland also moved the ball effectively, with Mitchell recording 11 assists and Harden contributing seven.
However, Dallas combined its passing production with better shooting efficiency.
That combination made its offensive possessions more productive.
Defensive Pressure and Steals Changed the Game
Dallas recorded 13 steals compared with Cleveland’s five.
This was one of the most noticeable defensive differences.
Steals can create immediate transition opportunities and prevent opponents from completing offensive possessions.
Washington’s five steals were particularly impressive.
Nembhard and other Dallas players also contributed to the team’s defensive activity.
The Mavericks finished with 12 turnovers, while Cleveland committed 16.
Dallas therefore protected the ball more effectively while also creating more opportunities to disrupt Cleveland’s offense.
The combination of fewer turnovers and more steals helped the Mavericks gain an advantage in possession quality.
How Dallas Won the Third Quarter
The third quarter was the defining period of the contest.
Dallas entered halftime with a narrow advantage after the teams traded offensive runs during the first two periods.
The Mavericks then produced 40 points in the third quarter, while Cleveland managed only 27.
That 13-point difference gave Dallas a major advantage heading into the final period.
Offensive Execution Improved After Halftime
Dallas became more effective at generating scoring opportunities after the break.
The Mavericks benefited from the combined contributions of Flagg, Marshall, Washington, and their supporting players.
Their ability to move the ball and find efficient shooting opportunities made Cleveland’s defensive assignments more difficult.
Instead of depending on one player to produce every important basket, Dallas used multiple offensive options.
This created more flexibility and prevented Cleveland from focusing all its attention on a single scorer.
Cleveland Lost Defensive Consistency
Cleveland’s offensive production was not the only issue during the third quarter.
The Cavaliers also struggled to prevent Dallas from building its lead.
The Mavericks found scoring opportunities through perimeter shooting, attacking the basket, and converting opportunities at the free-throw line.
Cleveland’s inability to slow down the Dallas offense allowed the visitors to establish a more comfortable advantage.
The Fourth Quarter Came Too Late
Cleveland responded with 34 points in the fourth quarter.
The Cavaliers improved their scoring output and showed that they were still capable of generating offense.
However, Dallas also scored 30 points during the final period.
The Mavericks did not need another explosive quarter. They simply needed to maintain their offensive production and prevent Cleveland from completely eliminating the deficit.
That approach allowed Dallas to finish with a 10-point victory.
Five Major Factors Behind the Mavericks’ Victory
The final result was not determined by one isolated performance. Several statistical advantages combined to give Dallas control of the contest.
1. Cooper Flagg’s Scoring and Playmaking
Flagg provided Dallas with a reliable offensive leader.
His 27 points made him the team’s leading scorer, while his 10 assists helped create opportunities for teammates.
This combination gave Dallas a more flexible offensive approach.
He could score when Cleveland’s defense allowed opportunities, but he could also create shots for other players when defensive attention increased.
2. Naji Marshall’s Shooting Efficiency
Marshall’s 25 points on 12 field-goal attempts represented an outstanding offensive contribution.
His perfect free-throw shooting added further value.
He also contributed seven assists, helping Dallas maintain its offensive movement.
His performance reduced the pressure on Flagg and made the Mavericks more difficult to defend.
3. Dallas Won the Three-Point Efficiency Battle
Dallas shot 50% from beyond the arc, compared with Cleveland’s 39%.
This difference helped the Mavericks produce more points from fewer attempts.
The Cavaliers made one additional three-pointer, but Dallas needed considerably fewer shots to reach its total.
This was a major example of how efficiency can matter more than raw shooting totals.
4. Defensive Activity Created Additional Opportunities
Dallas recorded 13 steals and committed only 12 turnovers.
Cleveland finished with five steals and 16 turnovers.
The Mavericks’ defensive pressure helped disrupt Cleveland’s offensive rhythm.
It also created additional opportunities for Dallas to score without depending entirely on half-court offense.
5. Dallas Converted Free Throws More Consistently
The Mavericks scored 23 points from the free-throw line, while Cleveland collected 14.
That nine-point difference was nearly equal to the final 10-point margin.
Dallas also rebounded more effectively and recorded more assists.
These smaller advantages combined to produce a meaningful overall difference.
First-Half Performance: How the Game Developed
The first half was much closer than the final score might suggest.
Dallas scored 35 points in the opening quarter, showing early offensive confidence.
Cleveland responded with 31 points, preventing the Mavericks from building a substantial lead.
The second quarter was more balanced.
Dallas scored 25 points, while Cleveland added 28.
The Cavaliers therefore reduced the margin slightly before halftime.
This part of the game showed that Cleveland was capable of matching Dallas’s offensive production.
However, the Mavericks entered the second half with enough momentum to make adjustments and improve their execution.
Why the First Half Was Competitive
Both teams had several players capable of creating scoring opportunities.
Dallas benefited from Flagg and Marshall, while Cleveland received important production from Mitchell and Strus.
The difference was that Dallas gradually established better control over its offensive possessions.
Although Cleveland remained close, its defensive performance became less effective during the third quarter.
Second-Half Performance: Dallas Takes Control
The second half completely changed the direction of the game.
Dallas scored 70 points across the third and fourth quarters.
Cleveland scored 61.
The Mavericks’ 40-point third quarter was the main reason for the difference.
Dallas Maintained Its Offensive Balance
The Mavericks did not depend entirely on Flagg to carry the offense.
Marshall continued contributing, Washington provided interior and perimeter scoring, and the supporting lineup added useful production.
This balance allowed Dallas to keep generating opportunities even when individual players were not directly involved in a possession.
Cleveland’s Offensive Response Was Not Enough
Cleveland scored 34 points in the fourth quarter, demonstrating its ability to respond offensively.
However, the Cavaliers needed a much stronger defensive effort to recover from the third-quarter deficit.
Dallas continued scoring and protected its advantage.
The Cavaliers’ late improvement therefore did not translate into a comeback.
Individual Matchups That Shaped the Result
Comparing key players from both teams provides another useful way to understand the outcome.
Cooper Flagg vs Donovan Mitchell
| Statistic | Cooper Flagg | Donovan Mitchell |
| Points | 27 | 26 |
| Rebounds | 6 | 1 |
| Assists | 10 | 11 |
| Field Goals | 10/17 | 10/24 |
| Three-Pointers | 1/3 | 4/11 |
| Blocks | 2 | Not specified |
Both players were major offensive contributors.
Mitchell finished with one more assist, while Flagg scored one additional point.
However, Flagg was considerably more efficient from the field.
He made 10 of 17 attempts, compared with Mitchell’s 10 of 24.
Flagg also contributed six rebounds and two blocks.
This comparison demonstrates how two players can produce similar scoring totals through different offensive approaches.
Naji Marshall vs Max Strus
| Statistic | Naji Marshall | Max Strus |
| Points | 25 | 24 |
| Rebounds | 5 | 8 |
| Assists | 7 | Not specified |
| Field Goals | 8/12 | 7/9 |
| Three-Pointers | 1/1 | 6/7 |
| Free Throws | 8/8 | Not specified |
This was one of the most interesting individual comparisons.
Marshall provided scoring, playmaking, and perfect free-throw shooting.
Strus produced outstanding perimeter shooting and collected eight rebounds.
Both players were extremely efficient, but their contributions came through different strengths.
Marshall offered a more balanced statistical performance, while Strus was particularly effective from three-point range.
P.J. Washington vs Evan Mobley
| Statistic | P.J. Washington | Evan Mobley |
| Points | 20 | 18 |
| Rebounds | 11 | 11 |
| Assists | 2 | 4 |
| Steals | 5 | Not specified |
| Blocks | 1 | 4 |
Washington and Mobley both recorded double-doubles.
Mobley provided greater shot-blocking production, finishing with four blocks.
Washington, however, contributed five steals and made three three-pointers.
Their performances demonstrate the different ways frontcourt players can influence a basketball game.
Mobley offered important interior defense, while Washington helped Dallas through perimeter shooting and defensive disruption.
What the Result Means for Both Teams
A single regular-season game does not determine an entire season, but the performance provides useful information about each team’s strengths and weaknesses.
Dallas demonstrated that it could produce an effective offensive performance against a strong opponent, even after losing the previous matchup by a large margin.
Cleveland, meanwhile, showed that its leading players could score efficiently in certain situations but needed stronger collective execution to protect against Dallas’s offensive pressure.
What Dallas Can Take Away
The Mavericks can take several positives from this performance.
Offensive balance: Multiple players reached double figures, giving Dallas more than one dependable scoring option.
Improved shooting efficiency: The team converted 50% of its three-point attempts and approximately 53% of its overall field goals.
Defensive pressure: Thirteen steals demonstrated the team’s ability to disrupt opposing possessions.
Better ball movement: Thirty-five assists showed that Dallas generated opportunities through collective offensive execution.
Free-throw consistency: The Mavericks made 23 of 27 attempts, an important advantage in a close contest.
These strengths provide useful examples of how Dallas can improve its offensive and defensive performance in future matchups.
What Cleveland Can Learn
Cleveland also had several positive individual performances.
Mitchell produced 26 points and 11 assists, while Strus delivered exceptional three-point shooting.
Mobley contributed a double-double with four blocks, and Harden added seven assists.
However, the team statistics reveal areas that required improvement.
The Cavaliers needed to:
- Improve their three-point efficiency.
- Convert more free-throw opportunities.
- Reduce turnovers.
- Improve defensive consistency after halftime.
- Limit the opposing team’s open perimeter opportunities.
- Generate stronger collective defensive pressure.
The biggest concern was the third quarter, when Dallas outscored Cleveland by 13 points.
That period demonstrated how quickly a competitive game can change when one team executes more effectively.
The Two-Game Series Between Dallas and Cleveland
The March meetings between these teams provided an interesting contrast.
Cleveland won the first matchup by a score of 138-105, producing a 33-point victory.
Dallas responded in the second contest with a 130-120 win.
The two teams therefore split their two-game series, with each side recording one victory.
The difference between the games was significant.
In the first contest, Cleveland controlled the matchup and produced a substantial winning margin.
In the rematch, Dallas improved its offensive execution and found ways to challenge Cleveland’s defense.
The second game also showed the importance of adjustments between consecutive meetings.
A team that loses heavily in one matchup does not necessarily have to repeat the same mistakes in the next.
Dallas improved its shooting efficiency, generated more assists, and applied greater defensive pressure.
The result was a much more balanced performance and a victory on Cleveland’s home floor.
Understanding the Most Important Basketball Statistics
For readers who want to understand the numbers behind this matchup, several statistical categories deserve additional explanation.
Points
Points represent the total scoring contribution of a player or team.
Dallas finished with 130 points, while Cleveland recorded 120.
The difference was enough to give the Mavericks a 10-point victory.
Field-Goal Percentage
Field-goal percentage measures how frequently a team converts its overall field-goal attempts.
The calculation is:
Field Goals Made ÷ Field Goals Attempted × 100
Dallas made 46 of 87 attempts, while Cleveland converted 45 of 88.
The Mavericks therefore finished with better overall shooting efficiency.
Three-Point Percentage
Three-point percentage measures successful shots from beyond the three-point line.
Dallas made 15 of 30 attempts, while Cleveland converted 16 of 41.
Although Cleveland made one more three-pointer, Dallas had a considerably better conversion rate.
Free-Throw Percentage
Free-throw percentage measures how many free throws a player or team successfully converts.
Dallas made 23 of 27 attempts, while Cleveland made 14 of 21.
This was one of the most important differences in the final statistical comparison.
Rebounds
Rebounds are collected after missed field-goal or free-throw attempts.
They are important because they determine which team gains possession.
Dallas collected 44 rebounds, compared with Cleveland’s 38.
Assists
An assist is credited when a player passes the ball to a teammate who scores directly from that play.
Dallas recorded 35 assists, showing strong offensive distribution.
Cleveland also performed well with 32 assists.
Steals
A steal occurs when a defensive player legally takes possession of the basketball from the opposing team.
Dallas recorded 13 steals, compared with Cleveland’s five.
This difference highlighted the Mavericks’ defensive activity.
Blocks
A block occurs when a defensive player legally deflects an opponent’s shot attempt.
Both teams recorded five blocks.
Mobley led Cleveland’s interior defensive effort with four blocks, while Flagg and other Dallas contributors helped the Mavericks match Cleveland’s overall total.
Where to Find the Official Box Score
Readers who want to examine the complete game record can consult the official NBA box score.
The official record provides detailed player statistics, including:
- Minutes played
- Field goals made and attempted
- Three-pointers made and attempted
- Free throws made and attempted
- Offensive and defensive rebounds
- Assists
- Steals
- Blocks
- Turnovers
- Personal fouls
- Plus-minus ratings
- Total points
Using the official box score is especially useful when comparing individual performances or checking specific statistical details.
It also helps distinguish between a player’s scoring contribution and their overall impact on the game.
FAQs About Cleveland Cavaliers vs Dallas Mavericks Match Player Stats
1. Who won the Cleveland Cavaliers vs Dallas Mavericks game in March 2026?
The Dallas Mavericks defeated the Cleveland Cavaliers 130-120 at Rocket Arena in Cleveland. The NBA lists the game date as March 15, 2026, in the United States. It was March 16 in Pakistan because of the time difference.
2. How many points did Cooper Flagg score against the Cavaliers?
Cooper Flagg scored 27 points for Dallas. He also recorded six rebounds, 10 assists, and two blocks while shooting 10-of-17 from the field.
3. Who was the leading scorer for the Cleveland Cavaliers?
Donovan Mitchell was Cleveland’s leading scorer with 26 points. He also recorded 11 assists and made four three-pointers.
4. How many points did Naji Marshall score against Cleveland?
Naji Marshall scored 25 points for the Mavericks. He added five rebounds and seven assists while making eight of his 12 field-goal attempts and all eight free throws.
5. What was the biggest difference between Dallas and Cleveland’s team statistics?
Dallas had several important advantages, including three-point percentage, free-throw percentage, rebounds, assists, and steals. The Mavericks shot 50% from three-point range, compared with Cleveland’s 39%, and recorded 13 steals against Cleveland’s five.
6. Who recorded the most rebounds in the game?
P.J. Washington for Dallas and Evan Mobley for Cleveland each recorded 11 rebounds. Washington also contributed 20 points, while Mobley finished with 18 points and four blocks.
Conclusion
The March 2026 matchup between the Dallas Mavericks and Cleveland Cavaliers provided an excellent example of how shooting efficiency, defensive pressure, and balanced scoring can determine an NBA game.
Dallas secured a 130-120 victory by performing more consistently across several important statistical categories. Cooper Flagg led the Mavericks with 27 points and 10 assists, while Naji Marshall added 25 points and seven assists. P.J. Washington contributed a double-double with 20 points and 11 rebounds, along with five steals.
Cleveland also received impressive individual performances. Donovan Mitchell finished with 26 points and 11 assists, Max Strus scored 24 points while making six three-pointers, and Evan Mobley recorded 18 points, 11 rebounds, and four blocks.
However, the difference came from the teams’ overall execution. Dallas shot 50% from three-point range, converted 85% of its free throws, collected six more rebounds, and recorded eight more steals than Cleveland.
The third quarter ultimately proved decisive. Dallas scored 40 points compared with Cleveland’s 27, creating an advantage that the Cavaliers could not overcome despite their improved fourth-quarter performance.
The Cleveland Cavaliers vs Dallas Mavericks match player stats demonstrate that individual scoring performances are only one part of basketball success. Efficient shooting, ball movement, defensive activity, and contributions from supporting players can be equally important. Dallas excelled in those areas and earned a valuable road victory, while Cleveland was left with several individual performances to appreciate and important team-level lessons to consider.