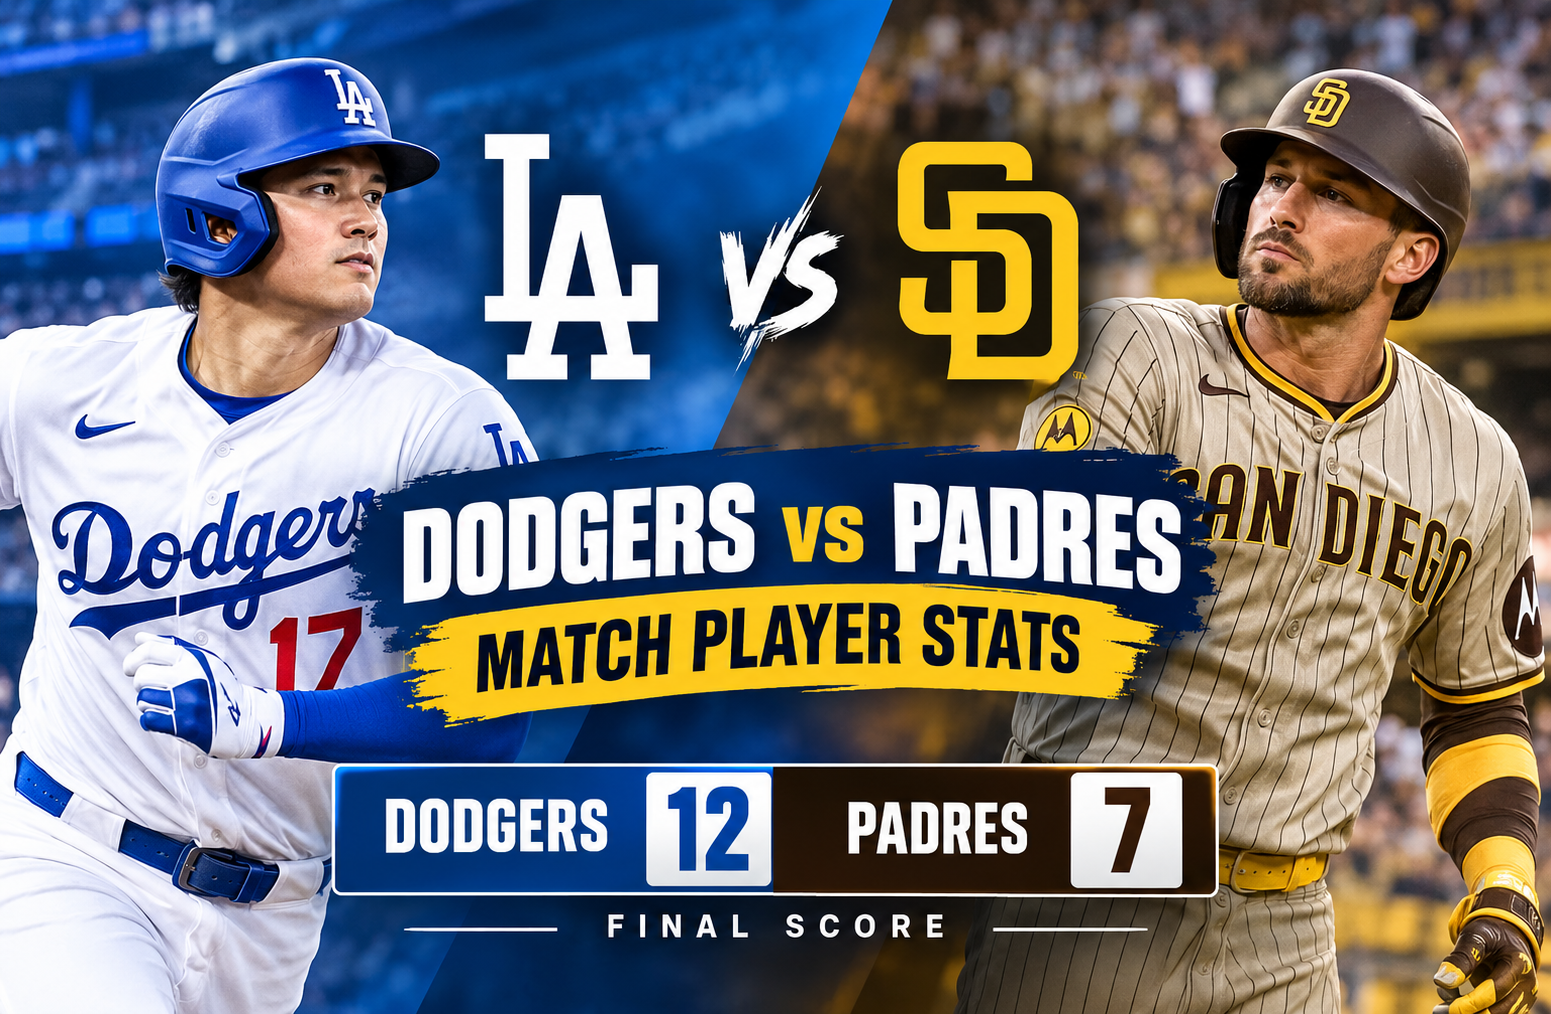
Dodgers vs Padres Match Player Stats
The dodgers vs padres match player stats from this divisional matchup tell a much deeper story than the final 12-7 score suggests. The San Diego Padres built a six-run lead early, but the Los Angeles Dodgers responded with sustained offensive pressure and eventually turned the game into a five-run victory at Dodger Stadium. The official MLB record confirms the 12-7 result, 17 Dodgers hits, 10 Padres hits, and the Dodgers’ comeback after trailing by six runs. MLB.com
The game was especially interesting because both clubs showed legitimate offensive firepower. San Diego hit three home runs and produced seven runs, while Los Angeles collected 17 hits and scored 12 runs despite hitting only one home run. That contrast makes the game useful for understanding how individual hitting profiles, baserunning, plate discipline, and pitching depth can combine to decide a high-scoring MLB matchup.
For readers researching player performance, this breakdown goes beyond the basic box score. It examines the most important hitters, pitching results, situational hitting, home runs, stolen bases, team efficiency, and what the numbers reveal about the game itself.
Dodgers vs Padres Match Player Stats: Game Overview
The matchup took place at Dodger Stadium in Los Angeles in front of 54,081 fans. The game lasted 3 hours and 8 minutes.
The final score was:
| Team | Runs | Hits | Errors |
| San Diego Padres | 7 | 10 | 0 |
| Los Angeles Dodgers | 12 | 17 | 0 |
The Dodgers did not win because the Padres failed to hit. San Diego produced 10 hits, three home runs, five walks, and seven runs. The difference was that Los Angeles generated more total offensive opportunities and converted them more effectively.
The Dodgers finished with 17 hits, six walks, 11 RBIs, and only four strikeouts. Their ability to repeatedly put runners on base created pressure throughout the middle innings.
The Padres finished with five walks and nine strikeouts. Their three home runs provided substantial damage, but the offense did not maintain the same level of production after its explosive opening.
MLB’s official game record lists the contest as a 12-7 Dodgers victory, with the Dodgers improving to 57-31 and the Padres standing at 43-43 at that point in the season. MLB.com
How the Game Unfolded
The most important feature of the game was the dramatic change in momentum.
San Diego opened aggressively and scored twice in the first inning. The Padres then added four more runs in the second, creating a 6-0 advantage.
At that stage, the game appeared to be moving toward a comfortable Padres victory.
Instead, the Dodgers gradually erased the deficit.
The scoring progression was:
| Inning | Padres | Dodgers |
| 1st | 2 | 0 |
| 2nd | 4 | 2 |
| 3rd | 0 | 2 |
| 4th | 0 | 4 |
| 5th | 0 | 2 |
| 6th | 0 | 1 |
| 7th | 0 | 0 |
| 8th | 0 | 1 |
| 9th | 1 | X |
| Final | 7 | 12 |
The Padres’ offense essentially did its most damaging work early. After the six-run second inning, San Diego was held scoreless from the third through eighth innings.
That six-inning scoring drought became the central reason the early advantage disappeared.
The Dodgers, meanwhile, kept adding runs. They scored in six different innings and turned the game around without needing one enormous offensive explosion.
That distinction matters.
A team can score 12 runs through a combination of sustained pressure rather than relying on a single massive inning. Los Angeles demonstrated that approach here.
Padres Offensive Leaders
The Padres produced 10 hits and seven runs, with three different players hitting home runs.
Their offensive production was led by several familiar names.
Jake Cronenworth
Jake Cronenworth was arguably the most productive Padres hitter in terms of run creation.
He finished with:
- 5 at-bats
- 1 run
- 1 hit
- 3 RBIs
- 1 home run
- 1 strikeout
His three RBIs tied him for the largest RBI contribution on the San Diego roster.
The home run was especially important because it helped build the Padres’ early advantage. Cronenworth’s ability to drive in multiple runs from one plate appearance gave San Diego valuable early momentum.
Manny Machado
Manny Machado also made a major contribution.
His line included:
- 3 at-bats
- 1 run
- 1 hit
- 2 RBIs
- 2 walks
- 1 home run
- 1 strikeout
Machado’s two walks are worth noting because his contribution was not limited to his home run.
He reached base three times through his one hit and two walks, giving San Diego opportunities to continue innings.
His home run also helped establish the tone of the game during the opening phase.
Jackson Merrill
Jackson Merrill added another home run for San Diego.
His recorded line included:
- 4 at-bats
- 1 run
- 1 hit
- 1 RBI
- 2 strikeouts
- 1 home run
Merrill’s homer represented another example of the Padres generating power against Dodgers pitching.
However, the broader offensive issue was consistency. San Diego’s home-run production was excellent, but the team could not sustain comparable scoring after the second inning.
Fernando Tatis Jr.
Fernando Tatis Jr. finished with one hit, two runs, one walk, and one stolen base.
His baserunning was an important part of San Diego’s offensive activity.
Tatis did not need to hit a home run to influence the game. His ability to reach base and create pressure with his speed gave the Padres another dimension.
Other Padres Contributors
The Padres also received hits from several other players, including Gavin Sheets, Ty France, Xander Bogaerts, Luis Arraez’s replacement lineup contributors, and Samad Taylor.
Miguel Andujar added an RBI as a pinch hitter.
The broader lesson from the Padres’ box score is that the team did not lack individual contributions. Instead, the timing of those contributions became the issue.
The Padres had enough production to score seven runs. They simply could not continue that production once the Dodgers’ pitching settled down.
Dodgers Offensive Leaders
The Dodgers’ offensive performance was much more consistent.
The team finished with:
- 38 at-bats
- 12 runs
- 17 hits
- 11 RBIs
- 6 walks
- 4 strikeouts
- 1 home run
That combination is extremely important.
The Dodgers generated 23 combined hits and walks while striking out only four times.
This gave the offense a large number of opportunities to put pressure on Padres pitchers.
Kyle Tucker’s Four-Hit Performance
Kyle Tucker was one of the biggest individual standouts.
He recorded:
- 4 at-bats
- 3 runs
- 4 hits
- 1 RBI
- 1 walk
- 0 strikeouts
The four-hit performance was particularly valuable because it combined contact quality with baserunning opportunities.
Tucker’s three runs scored show how his offensive contribution extended beyond simply collecting hits.
A player who repeatedly reaches base can become a major part of a scoring sequence even when he does not drive in most of the runs himself.
Dalton Rushing’s Four-RBI Game
Dalton Rushing was another major difference-maker.
He finished with:
- 4 at-bats
- 3 runs
- 4 hits
- 4 RBIs
- 1 home run
- 0 strikeouts
Rushing’s four RBIs were the highest total by any player in the game.
His performance combined power and contact production in a way that directly influenced the final result.
The home run was the obvious highlight, but his overall four-hit performance was arguably even more important. One big swing can change a game, but four hits create repeated scoring opportunities.
Mookie Betts
Mookie Betts contributed two hits and two runs while driving in one run.
His performance helped maintain the Dodgers’ offensive pressure.
Betts did not need to produce the team’s largest individual numbers because the Dodgers received contributions from multiple spots in the lineup.
That balance is one of the most significant features of the game.
Max Muncy
Max Muncy also collected two hits and drove in two runs.
His production was part of the middle-inning surge that helped the Dodgers turn a six-run deficit into a lead.
When a lineup has multiple hitters contributing simultaneously, opposing pitchers have fewer opportunities to work around individual threats.
Andy Pages
Andy Pages recorded one hit and drove in two runs.
His contribution was another example of the Dodgers spreading production across the lineup rather than relying on one superstar.
That balance helped make the comeback sustainable.
Tommy Edman
Tommy Edman added two hits, two runs, one RBI, one walk, and a stolen base.
His ability to contribute both offensively and on the bases added another layer to the Dodgers’ attack.
The Dodgers finished with one stolen base, while the Padres also recorded one.
What the Batting Numbers Really Show
The surface-level comparison is simple:
Padres: 10 hits, 7 runs, 3 home runs
Dodgers: 17 hits, 12 runs, 1 home run
But the deeper comparison is more revealing.
San Diego generated more home-run power.
Los Angeles generated more overall offensive volume.
That distinction explains much of the result.
The Padres averaged 0.70 runs per hit.
The Dodgers averaged approximately 0.71 runs per hit.
So the efficiency of the two offenses was surprisingly similar on a basic runs-per-hit calculation.
The bigger difference was opportunity volume.
The Dodgers had seven more hits and one more walk than San Diego.
That meant Los Angeles repeatedly created situations in which its hitters could drive runners home.
Situational Hitting and RISP
Runners in scoring position are one of the most useful ways to understand how an offense converts opportunities.
The Padres went:
3-for-9 with runners in scoring position
The Dodgers went:
6-for-16 with runners in scoring position
Neither number represents perfect execution.
However, the Dodgers produced six hits in those situations compared with three for San Diego.
That difference matters because the Dodgers also created more RISP opportunities.
The Padres had nine official RISP at-bats.
The Dodgers had 16.
This is an important distinction when evaluating player performance.
A hitter cannot drive in a runner who never reaches scoring position.
The Dodgers’ offense did both things well enough to win: it created opportunities and then converted a meaningful portion of them.
The Importance of Walks
Walks were another quiet difference.
San Diego drew five walks.
Los Angeles drew six.
The difference was only one walk, so it should not be exaggerated.
But when combined with the Dodgers’ 17 hits, it contributed to a larger volume of baserunners.
The Dodgers also struck out only four times.
The Padres struck out nine times.
That five-strikeout difference is significant in a game decided by five runs.
The Dodgers repeatedly put the ball in play while also avoiding excessive strikeouts.
That combination made their offense difficult to suppress once the game moved into the middle innings.
Pitching Comparison
The pitching statistics show the biggest contrast between the two teams.
Dodgers pitching
The Dodgers pitching staff recorded:
- 9.0 innings
- 10 hits allowed
- 7 runs allowed
- 7 earned runs
- 5 walks
- 9 strikeouts
- 3 home runs allowed
Padres pitching
The Padres pitching staff recorded:
- 8.0 innings
- 17 hits allowed
- 12 runs allowed
- 12 earned runs
- 6 walks
- 4 strikeouts
- 1 home run allowed
The most obvious number is hits allowed.
The Padres surrendered 17 hits.
The Dodgers allowed 10.
That seven-hit difference is enormous.
The Padres actually allowed fewer home runs, but that did not matter because the Dodgers consistently reached base through singles and extra-base contact.
This is one of the clearest lessons from the game.
A pitching staff does not necessarily lose because of home runs alone. Sustained contact can be just as damaging.
Winning Pitcher: W. Klein
- Klein earned the win after throwing:
- 2.0 innings
- 1 hit allowed
- 0 earned runs
- 3 strikeouts
- 0 walks
That is a highly effective relief appearance.
Klein did not allow a walk and surrendered only one hit while striking out three.
The clean relief work helped protect the Dodgers after the offense had completed its comeback.
His record moved to 3-2.
Losing Pitcher: W. Peralta
- Peralta was charged with the loss.
His line was:
- 1.0 inning
- 6 hits allowed
- 4 earned runs
- 2 strikeouts
- 0 walks
The most damaging number is six hits in one inning.
Peralta did not walk a batter, which means the damage came almost entirely through direct contact.
That is an important analytical point.
Walks are often criticized when evaluating pitching, but this performance demonstrates that strike-zone control alone is not enough. A pitcher can avoid free passes and still have a disastrous inning if hitters consistently square up pitches.
Why the Padres Lost Despite Three Home Runs
The Padres hit three home runs.
The Dodgers hit one.
Yet Los Angeles won by five runs.
That fact illustrates why looking only at home runs can produce an incomplete analysis.
San Diego’s three homers produced substantial value, but the Padres had limited scoring outside those major swings.
After scoring six runs in the first two innings, San Diego added only one more run.
The Dodgers took a different path.
Their offense created pressure through singles, extra-base hits, walks, and repeated traffic on the bases.
Instead of waiting for one enormous swing, Los Angeles kept producing.
That is the clearest offensive lesson from the matchup.
A Six-Run Deficit Was Not Enough
The Dodgers’ comeback was not merely a routine recovery from a small early deficit.
They trailed 6-0 after the second inning.
MLB described the comeback as the Dodgers’ second-largest victory in a game in which they had trailed by six or more runs since at least 1900. MLB.com
That context gives the result historical significance beyond the ordinary standings.
The comeback also demonstrates why a baseball game should not be evaluated solely through the first few innings.
A six-run lead can feel decisive, but nine innings create enough opportunities for momentum to change.
In this case, the Dodgers’ offense gradually transformed the game.
Baserunning Impact
Both teams recorded a stolen base.
Fernando Tatis Jr. stole a base for San Diego.
Tommy Edman stole a base for Los Angeles.
These plays did not determine the final score by themselves, but they demonstrate how both teams used speed to create additional pressure.
Stolen bases are most valuable when they change the probability of scoring.
Moving a runner into scoring position can reduce the number of productive plate appearances needed to bring that runner home.
The fact that both clubs recorded a stolen base also shows that the matchup was not purely about power hitting.
Defensive Efficiency
Neither team committed an error.
That means the defensive side of the game did not produce an obvious fielding-related advantage through mistakes.
The Padres turned two double plays.
The Dodgers turned one.
Double plays can erase scoring opportunities and end innings quickly.
San Diego’s two double plays were useful defensive contributions, but they were not enough to compensate for the pitching staff allowing 17 hits.
This is another reason the final score should not be interpreted as a defensive collapse by both clubs.
The Padres played error-free baseball.
Their main problem was pitching contact management.
What the Box Score Says About Team Identity
The game provides an interesting contrast between two different offensive paths.
San Diego’s approach
The Padres demonstrated:
- Home-run power
- Early aggression
- Productive middle-of-the-order hitting
- Useful baserunning
- Strong initial pressure
But they also showed:
- Nine strikeouts
- A six-inning scoring drought
- Limited RISP conversion compared with their total opportunities
- Difficulty maintaining pressure after the early lead
Los Angeles’ approach
The Dodgers demonstrated:
- High contact volume
- 17 total hits
- Six walks
- Only four strikeouts
- Six hits with runners in scoring position
- Multiple players with two or more hits
- Continued scoring throughout the middle innings
That balance made the difference.
Key Takeaways From Dodgers vs Padres Match Player Stats
The most useful conclusions from this game can be summarized in several points.
1. Hits created the biggest separation
Los Angeles collected seven more hits than San Diego.
That was the clearest statistical advantage.
2. The Padres relied heavily on early power
Three home runs helped San Diego build a 6-0 lead.
But the offense could not maintain its production after the second inning.
3. The Dodgers created sustained pressure
The Dodgers scored in multiple innings and continued putting runners on base.
That consistency eventually erased the early deficit.
4. Dalton Rushing was a central offensive figure
Rushing produced four hits, four RBIs, and a home run.
His performance directly contributed to the comeback.
5. Kyle Tucker provided elite contact production
Tucker’s four hits and three runs were critical to maintaining offensive pressure.
6. The Dodgers’ pitching stabilized
- Klein’s two scoreless innings helped prevent San Diego from rebuilding momentum.
7. Strikeout control favored Los Angeles
Four Dodgers strikeouts compared with nine Padres strikeouts gave Los Angeles more balls in play and more chances to create offense.
How to Read Player Stats More Effectively
A useful way to analyze a baseball box score is to avoid focusing on one statistic.
For hitters, examine:
- Hits
- Runs
- RBIs
- Walks
- Strikeouts
- Home runs
- RISP performance
- Stolen bases
- Total opportunities
For pitchers, look at:
- Innings
- Hits allowed
- Earned runs
- Walks
- Strikeouts
- Home runs allowed
- Inherited runners
- Game situation
This approach provides a much more complete picture.
For example, W. Peralta’s zero walks might initially look positive. But six hits and four earned runs in one inning tell a much different story.
Likewise, a player with one home run might appear more impactful than a hitter with four singles. In this particular game, however, repeated contact was extremely valuable because the Dodgers used it to generate 12 runs.
Why Individual Stats Need Team Context
Baseball statistics can be misleading when removed from the game situation.
Consider Cronenworth.
His three RBIs were excellent.
But the Padres still lost.
Now consider Tucker.
He had only one RBI.
Yet his four hits and three runs were extremely valuable.
This illustrates the difference between direct run production and total offensive influence.
A player who reaches base repeatedly can contribute to multiple scoring sequences even without recording an RBI.
That is why a serious analysis should combine individual statistics with team-level numbers.
The Role of Pitching Depth
The Dodgers’ pitching staff allowed seven runs, which is not an especially dominant performance.
Yet it was good enough because the offense produced 12.
This is an important baseball reality.
A team does not always need its pitching staff to dominate.
Sometimes it needs the pitching staff to stop the opposing offense from scoring after an early surge.
The Dodgers did exactly that.
San Diego scored six runs in the first two innings.
The Padres scored only one more run over the remainder of the game.
That stabilization allowed the Dodgers’ offense time to complete the comeback.
What This Matchup Means for Evaluating Future Games
When comparing future Padres and Dodgers games, several statistics from this matchup are worth monitoring.
Contact quality
The Dodgers’ 17-hit performance demonstrates how dangerous their lineup can become when multiple hitters consistently make contact.
Power distribution
The Padres showed that they can generate quick offense through the long ball.
RISP opportunities
The difference between nine Padres RISP at-bats and 16 Dodgers RISP at-bats demonstrates how important it is to create scoring opportunities before evaluating conversion.
Strikeout rate
Four Dodgers strikeouts against nine Padres strikeouts provided Los Angeles with substantially more balls in play.
Bullpen performance
Klein’s scoreless appearance helped preserve the Dodgers’ lead once they gained control.
These indicators can be more informative than simply looking at the final score.
Series Context
The supplied series data shows the Dodgers ultimately winning the four-game set 3-1.
The reported series results were:
| Game | Padres | Dodgers |
| Game 1 | 7 | 12 |
| Game 2 | 3 | 4 |
| Game 3 | 0 | 3 |
| Game 4 | 5 | 2 |
That sequence shows that the first game was the highest-scoring contest of the series.
It also shows how different the games could be.
The Padres scored seven runs in the opening contest but were shut out in the third game.
The Dodgers scored 12 in the opener but only two in the fourth.
That variation reinforces an important point: individual game statistics are valuable, but series-level context can reveal patterns that a single box score cannot.
Final Assessment
The dodgers vs padres match player stats reveal a game that was decided less by raw home-run power and more by sustained offensive pressure.
San Diego’s three home runs helped create a six-run advantage, with Manny Machado, Jackson Merrill, and Jake Cronenworth providing the power. Cronenworth led the Padres with three RBIs, while Machado added two RBIs and two walks.
Los Angeles responded differently.
The Dodgers collected 17 hits, received four-hit games from Kyle Tucker and Dalton Rushing, drew six walks, and struck out only four times. Rushing’s four RBIs and home run made him the biggest direct run producer for Los Angeles, while Tucker’s four hits and three runs provided outstanding table-setting production.
The pitching comparison was equally important.
The Dodgers allowed 10 hits and seven runs but shut San Diego down after the early explosion. W. Klein’s two scoreless innings were particularly useful once Los Angeles had taken control.
Ultimately, the 12-7 score reflects more than a simple offensive shootout. It shows two very different scoring strategies. San Diego produced explosive early power, while Los Angeles generated sustained pressure over the middle and later stages of the game.
For anyone studying player performance, the biggest lesson is clear: the best box-score analysis connects individual statistics with timing, opportunity, lineup depth, pitching performance, and game situation.
Frequently Asked Questions
What was the final score between the Padres and Dodgers?
The Dodgers defeated the Padres 12-7. Los Angeles recorded 17 hits, while San Diego recorded 10 hits. MLB.com
Who was the top RBI producer for the Dodgers?
Dalton Rushing led the Dodgers with four RBIs. He also collected four hits and hit one home run.
Who led the Padres in RBIs?
Jake Cronenworth led San Diego with three RBIs. He also hit one home run.
How many home runs did the Padres hit?
The Padres hit three home runs. Manny Machado, Jackson Merrill, and Jake Cronenworth each homered.
How many hits did the Dodgers record?
The Dodgers recorded 17 hits, seven more than the Padres’ 10 hits.
Who earned the pitching win?
- Klein earned the win after pitching two scoreless innings with one hit allowed, three strikeouts, and no walks. The official MLB box score lists his record as 3-2. MLB.com
Conclusion
The dodgers vs padres match player stats provide a strong example of how a baseball game can change dramatically after an explosive opening.
The Padres’ early six-run lead came from aggressive hitting and three home runs, but the Dodgers responded with a much more sustained offensive attack. Seventeen hits, six walks, four strikeouts, and production from several hitters allowed Los Angeles to keep pressure on San Diego throughout the middle innings.
Dalton Rushing stood out with four hits and four RBIs, while Kyle Tucker also collected four hits and scored three times. On the Padres’ side, Jake Cronenworth delivered three RBIs, while Manny Machado and Jackson Merrill supplied additional home-run power.
The pitching story was equally important. San Diego’s staff gave up 17 hits and 12 runs, while Los Angeles limited the Padres to one additional run after their six-run start.
The result was a 12-7 Dodgers victory and an important example of why complete player analysis requires more than looking at home runs or RBIs alone. Hits, walks, strikeouts, situational hitting, baserunning, pitching stability, and timing all contributed to the final outcome.