49ers vs Tampa Bay Buccaneers Match Player Stats
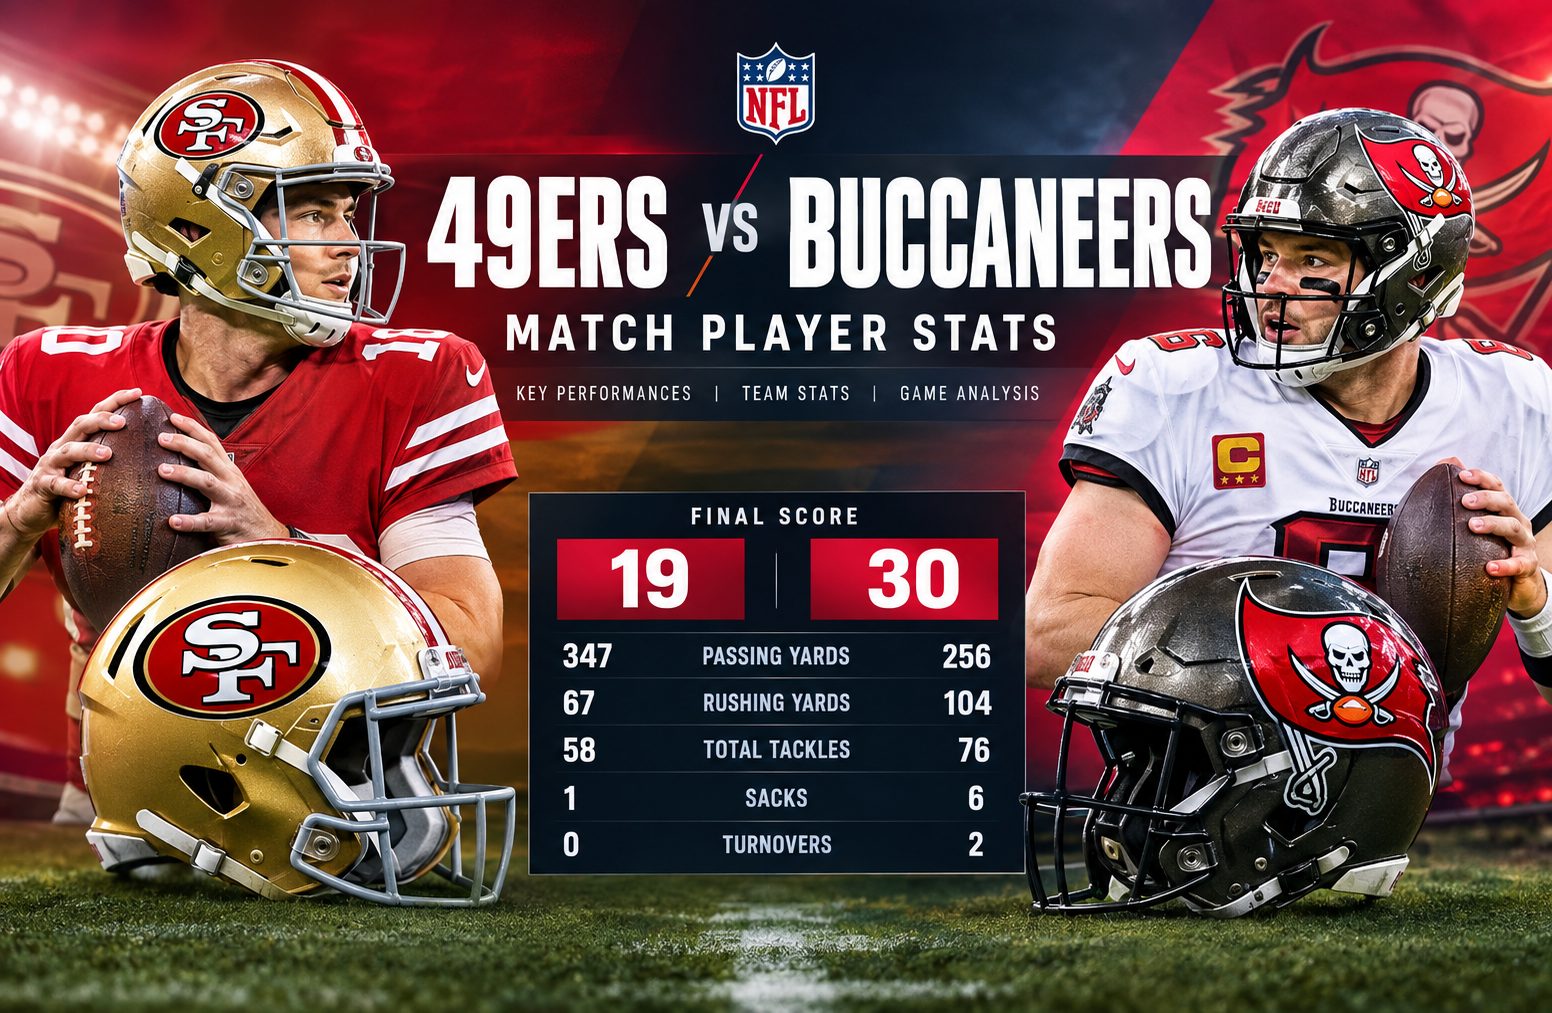
The 49ers vs tampa bay buccaneers match player stats from the 2025 NFL meeting tell a more detailed story than the final 30-19 score alone. Tampa Bay Buccaneers defeated the San Francisco 49ers at Raymond James Stadium in Week 6, turning strong passing efficiency, a productive rushing attack, and six sacks into a convincing home victory. San Francisco moved the ball through the air, with Mac Jones throwing for 347 yards and Kendrick Bourne producing 142 receiving yards, but two interceptions and repeated pressure limited the 49ers when they needed to sustain scoring drives. Tampa Bay, meanwhile, received an efficient performance from Baker Mayfield, who completed 17 of 23 passes for 256 yards and two touchdowns without an interception. (ESPN)
The game was played on October 12, 2025, despite some listings or supplied information showing October 13. The official NFL schedule identifies the matchup as Week 6, with San Francisco entering at 4-2 and Tampa Bay at 5-1. (NFL)
What makes this box score particularly useful is the contrast between yardage and efficiency. San Francisco actually produced 347 passing yards, but Tampa Bay generated the cleaner offensive performance. The Buccaneers combined 256 passing yards with 104 rushing yards and scored 30 points, while San Francisco finished with 347 passing yards, only 67 rushing yards, and 19 points.
This article breaks down the major player statistics, team numbers, scoring pattern, defensive performance, and the details that explain how Tampa Bay created the separation.
Game Overview and Final Score
The final score was:
Tampa Bay Buccaneers 30, San Francisco 49ers 19
The scoring distribution shows that Tampa Bay maintained control throughout the game rather than relying on one late scoring burst.
| Quarter | 49ers | Buccaneers |
| First | 3 | 7 |
| Second | 13 | 13 |
| Third | 3 | 7 |
| Fourth | 0 | 3 |
| Final | 19 | 30 |
San Francisco scored only three points in the opening quarter but responded with 13 points in the second. Tampa Bay matched that second-quarter output and entered halftime with an advantage.
The third quarter again favored Tampa Bay, 7-3. The most important difference came in the fourth quarter, when San Francisco failed to score while Tampa Bay added another field goal.
That fourth-quarter split is important because the 49ers had already demonstrated that their passing offense could generate yardage. The problem was converting that production into enough points after halftime.
Key 49ers vs Tampa Bay Buccaneers Match Player Stats
The central numbers from the matchup are straightforward:
| Category | San Francisco 49ers | Tampa Bay Buccaneers |
| Final Score | 19 | 30 |
| Passing Yards | 347 | 256 |
| Rushing Yards | 67 | 104 |
| Passing TDs | 0 | 2 |
| Rushing TDs | 1 | 2 |
| Interceptions Thrown | 2 | 0 |
| Sacks Allowed | 6 | 1 |
| Team Rushing Attempts | 22 | 26 |
| Team Tackles | 58 | 76 |
| Defensive Sacks | 1 | 6 |
| Fumbles | 1 | 1 |
| Fumbles Lost | 0 | 0 |
The first statistic that can mislead a casual reader is passing yardage.
San Francisco gained 91 more passing yards than Tampa Bay, yet lost by 11 points. That happened because the Buccaneers were substantially more efficient in several high-value areas.
Tampa Bay protected Mayfield, giving up only one sack. San Francisco allowed six sacks. The Buccaneers also intercepted Jones twice.
Those turnovers and negative plays changed the value of the raw yardage totals.
Mac Jones Passing Performance
Mac Jones produced one of the more unusual statistical lines of the game.
He completed:
- 27 of 39 passes
- 347 yards
- 8.9 yards per attempt
- 0 touchdowns
- 2 interceptions
- 6 sacks for 51 yards
- 75.5 passer rating
The official NFL player log confirms the 27-for-39, 347-yard performance with two interceptions and six sacks. (NFL)
A completion rate of 69.2 percent is generally a strong number, and 347 yards indicates that San Francisco was capable of creating significant passing production. Yet the zero touchdowns and two interceptions reveal the other side of the performance.
Jones repeatedly had to operate under pressure.
Six sacks for 51 yards means Tampa Bay’s defense was able to turn successful pass plays into costly negative plays at other moments. That pressure also helped create a difficult environment for San Francisco’s offense on important downs.
The biggest takeaway from Jones’ performance is therefore not simply that he threw for 347 yards. It is that the yardage came without the touchdown production or turnover control required to turn those drives into enough points.
Why the 347 Passing Yards Did Not Translate Into a Win
There are several reasons.
First, San Francisco scored only one offensive touchdown through its rushing attack. Jones did not throw a touchdown pass.
Second, Tampa Bay intercepted Jones twice.
Third, Tampa Bay recorded six sacks.
Fourth, San Francisco rushed for only 67 team yards.
A passing offense can produce large numbers while still struggling to maintain efficient scoring drives. This game is a strong example of that distinction.
Baker Mayfield’s Efficient Night
Baker Mayfield had a very different statistical profile.
His final line was:
- 17 completions
- 23 attempts
- 256 passing yards
- 11.1 yards per attempt
- 2 touchdowns
- 0 interceptions
- 1 sack
- 139.0 passer rating
ESPN’s box score records the same 17-of-23, 256-yard performance, two touchdowns, no interceptions, and one sack. (ESPN)
Mayfield attempted 16 fewer passes than Jones but still produced two touchdown passes and zero interceptions.
That difference is central to understanding the game.
San Francisco relied heavily on its passing game to accumulate yardage. Tampa Bay did not need Mayfield to throw 39 passes because the Buccaneers were able to combine efficient passing with a stronger rushing attack.
Mayfield’s 11.1 yards per attempt also shows that Tampa Bay was not simply completing short passes and slowly moving downfield. The Buccaneers produced explosive gains through the passing game.
Christian McCaffrey’s Rushing Numbers
Christian McCaffrey led San Francisco’s rushing attack with:
- 17 carries
- 54 yards
- 3.2 yards per carry
- 1 touchdown
- 11-yard longest run
McCaffrey accounted for a large share of San Francisco’s rushing workload.
However, the team finished with only 67 rushing yards on 22 attempts, an average of 3.0 yards per carry.
That limited efficiency created a difficult offensive balance.
When a team averages only 3.0 yards per rushing attempt, the passing game often has to carry more of the workload. San Francisco did exactly that, producing 347 passing yards.
The issue was that Tampa Bay’s defense was able to pressure Jones frequently enough to prevent that passing production from becoming consistent scoring.
McCaffrey’s touchdown prevented San Francisco from being completely shut out of the end zone on offense, but his 54 rushing yards were not enough to establish the type of ground efficiency that could have taken pressure off the passing game.
Rachaad White’s Contribution
Rachaad White led Tampa Bay’s rushing production with:
- 17 carries
- 65 yards
- 3.8 yards per carry
- 1 touchdown
- 10-yard longest run
The Buccaneers as a team recorded 104 rushing yards on 26 attempts, averaging 4.0 yards per carry.
That is an important difference from San Francisco’s 67 yards on 22 carries.
Tampa Bay ran the ball four more times and gained 37 additional rushing yards.
The rushing attack also produced two touchdowns at the team level, giving Tampa Bay another way to finish drives.
This helped keep Mayfield from having to shoulder the entire offensive burden.
Kendrick Bourne Leads San Francisco Receivers
Kendrick Bourne was San Francisco’s most productive receiver.
His final numbers were:
- 5 receptions
- 142 yards
- 28.4 yards per reception
- 56-yard longest reception
- 0 touchdowns
Bourne’s 142 receiving yards represented a major portion of San Francisco’s total passing production.
His 28.4 yards per catch average was particularly notable. It shows that San Francisco generated explosive receiving plays despite ultimately losing the game.
This is another reason why the box score requires context.
A receiver can have an outstanding statistical afternoon without the offense necessarily winning. Bourne’s production demonstrates that San Francisco could create big plays, but Tampa Bay was better at preventing those plays from becoming a complete offensive performance.
The official NFL statistics also confirm Bourne’s 142-yard game against Tampa Bay. (NFL)
Kameron Johnson Provides a Major Tampa Bay Contribution
Kameron Johnson led Tampa Bay in receiving:
- 4 receptions
- 64 yards
- 16.0 yards per reception
- 1 touchdown
- 34-yard longest reception
His touchdown was particularly important because Tampa Bay entered the game dealing with significant changes at wide receiver.
The NFL reported that Mike Evans, Chris Godwin, and Jalen McMillan were already unavailable, while Emeka Egbuka later left the game with a hamstring injury. That situation forced Tampa Bay to rely more heavily on lesser-known receivers, including Kameron Johnson and Tez Johnson. Both young receivers scored their first NFL touchdowns in the 30-19 victory. (NFL)
That context makes Kameron Johnson’s four-catch, 64-yard, one-touchdown line more meaningful.
He was not simply collecting routine receptions. He contributed directly to Tampa Bay’s ability to replace missing production and keep its offense dangerous.
Tampa Bay’s Receiving Efficiency
The Buccaneers finished with:
- 17 receptions
- 256 yards
- 15.1 yards per reception
- 2 touchdowns
San Francisco finished with:
- 27 receptions
- 347 yards
- 12.9 yards per reception
- 0 touchdowns
The comparison highlights an important statistical theme.
San Francisco completed more passes and gained more passing yards. Tampa Bay, however, averaged more yards per reception and produced two passing touchdowns.
That is a classic example of quality versus quantity in a box score.
San Francisco generated 27 receptions. Tampa Bay generated only 17.
But Tampa Bay’s average of 15.1 yards per reception was higher than San Francisco’s 12.9.
The Buccaneers were therefore more explosive per reception while also avoiding interceptions.
The Defensive Battle Decided the Game
The defensive statistics may explain the result better than the offensive yardage.
San Francisco recorded:
- 58 total tackles
- 35 solo tackles
- 1 sack
- 4 tackles for loss
- 2 passes defended
- 1 quarterback hit
Tampa Bay recorded:
- 76 total tackles
- 46 solo tackles
- 6 sacks
- 5 tackles for loss
- 5 passes defended
- 10 quarterback hits
The most striking numbers are the six sacks and 10 quarterback hits by Tampa Bay.
San Francisco’s defense recorded only one sack and one quarterback hit.
That is a significant difference in quarterback disruption.
Tampa Bay was able to affect Jones behind the line of scrimmage far more frequently than San Francisco affected Mayfield.
The six sacks also contributed to the difference between Jones’ impressive raw yardage and Tampa Bay’s much more efficient scoring output.
Tampa Bay’s Six-Sack Performance
Six sacks are difficult to overlook.
A sack does more than reduce passing yardage.
It can:
- Put an offense behind schedule.
- Move the offense out of field-goal range.
- Increase the difficulty of third-down conversions.
- Create longer second and third downs.
- Increase quarterback pressure on later plays.
- Help force hurried throws and mistakes.
In this game, Tampa Bay’s pressure worked alongside two interceptions.
That combination is especially important.
The Buccaneers did not merely stop drives by creating sacks. They also created turnovers when Jones attempted to push the ball through the defense.
The Two Interceptions
Tampa Bay’s two interceptions came from:
- Kindle Vildor, 13-yard return
- Jamel Dean, 6-yard return
San Francisco did not record an interception.
That gives Tampa Bay a clear plus-two advantage in interceptions.
Neither team lost a fumble, so the major turnover difference came entirely through the passing game.
This is one of the clearest statistical reasons the Buccaneers were able to win despite giving up more passing yards.
Team Rushing Comparison
The ground-game comparison was also significant.
| Rushing Category | 49ers | Buccaneers |
| Attempts | 22 | 26 |
| Yards | 67 | 104 |
| Average | 3.0 | 4.0 |
| Touchdowns | 1 | 2 |
Tampa Bay gained 37 more rushing yards and scored twice as many rushing touchdowns.
The Buccaneers also had four additional rushing attempts.
That combination matters because a successful rushing attack can support an offense in several ways.
It can help control possession, create manageable downs, reduce quarterback exposure, and make defensive play-calling less predictable.
Tampa Bay’s 4.0-yard average was not spectacular on its own, but it was substantially more effective than San Francisco’s 3.0-yard figure in this particular matchup.
Field-Goal and Special Teams Production
Eddy Pineiro was perfect for San Francisco:
- 4 field goals made on 4 attempts
- Long of 54 yards
- 1 extra point
- 13 total points
Chase McLaughlin recorded:
- 1 field goal made on 2 attempts
- Long of 45 yards
- 3 extra points
- 6 total points
Pineiro’s 13 points were a major part of San Francisco’s final total.
That is worth highlighting because San Francisco scored only one offensive touchdown but still reached 19 points.
Four successful field goals kept the 49ers within reach for much of the game.
However, field goals could not fully compensate for the lack of passing touchdowns and the two interceptions.
Punt and Return Statistics
Thomas Morstead punted twice for San Francisco:
- 2 punts
- 89 total yards
- 44.5-yard average
- 48-yard long
- 1 inside the 20
Riley Dixon handled Tampa Bay’s punting:
- 3 punts
- 166 total yards
- 55.3-yard average
- 60-yard long
- 3 inside the 20
The Buccaneers also held a slight edge in kick-return production.
San Francisco recorded six kick returns for 161 yards, averaging 26.8 yards per return.
Tampa Bay had six kick returns for 158 yards, averaging 26.3 yards.
San Francisco’s two punt returns produced 25 yards, while Tampa Bay had one punt return for six yards.
These numbers did not determine the game on their own, but they contributed to field-position management.
A Closer Look at the Scoring Pattern
The quarter-by-quarter numbers provide a useful way to understand the game.
First Quarter
Tampa Bay led 7-3.
San Francisco opened its scoring with a field goal, while Tampa Bay found the end zone.
That gave the Buccaneers an early four-point advantage.
Second Quarter
Both teams scored 13 points.
This was the highest-scoring quarter for both sides.
San Francisco’s 13-point response prevented Tampa Bay from taking a large halftime lead.
At halftime, Tampa Bay still had the advantage, but the game remained competitive.
Third Quarter
Tampa Bay outscored San Francisco 7-3.
That increased the advantage and placed more pressure on the 49ers’ offense.
Fourth Quarter
Tampa Bay added three points while San Francisco was held scoreless.
That final-quarter shutout was decisive.
San Francisco had produced 16 points across the first two quarters, but its offense could not maintain that scoring pace after halftime.
Why the Final Score Was Different From the Yardage Battle
One of the most valuable lessons from this game is that total yardage does not automatically determine the winner.
San Francisco had:
347 passing yards + 67 rushing yards = 414 yards
Tampa Bay had:
256 passing yards + 104 rushing yards = 360 yards
San Francisco therefore produced 54 more combined offensive yards.
Yet Tampa Bay won by 11 points.
Why?
The most important factors were:
- Tampa Bay threw two touchdown passes.
- San Francisco threw two interceptions.
- Tampa Bay allowed only one sack.
- San Francisco allowed six sacks.
- Tampa Bay rushed for 104 yards.
- San Francisco rushed for 67 yards.
- Tampa Bay scored two rushing touchdowns.
- San Francisco scored zero passing touchdowns.
- Tampa Bay scored in every quarter.
- San Francisco was shut out in the fourth quarter.
This is why evaluating a game solely through total yardage can produce an incomplete conclusion.
What the Player Stats Reveal About Offensive Efficiency
The matchup offers a useful comparison between two very different offensive profiles.
San Francisco’s offense was more volume-oriented through the passing game.
Jones attempted 39 passes and completed 27.
Tampa Bay’s offense was more balanced.
Mayfield attempted only 23 passes, while the Buccaneers ran 26 times as a team.
That balance reduced the number of situations in which Mayfield had to throw under heavy pressure.
It also allowed Tampa Bay to maintain a varied offensive structure.
San Francisco, meanwhile, needed its passing game to generate significant yardage because the rushing attack averaged only 3.0 yards per carry.
That created more opportunities for Tampa Bay’s pass rush to become a factor.
What the Defensive Stats Reveal
The defensive numbers show an even clearer contrast.
Tampa Bay recorded:
- 6 sacks
- 10 quarterback hits
- 5 tackles for loss
- 5 passes defended
- 2 interceptions
San Francisco recorded:
- 1 sack
- 1 quarterback hit
- 4 tackles for loss
- 2 passes defended
- 0 interceptions
Tampa Bay therefore generated more pressure, more quarterback disruption, more passes defended, and more interceptions.
That defensive advantage helped compensate for the 54-yard disadvantage in total offensive yardage.
The Importance of Turnover-Free Football
Tampa Bay’s offense did something particularly valuable: it avoided throwing an interception.
Mayfield’s two touchdown passes came without a turnover through the air.
San Francisco did not receive the same level of ball security from its passing game.
Jones’ two interceptions were costly because San Francisco was already struggling to score touchdowns.
When an offense is relying on field goals, every turnover can become more damaging.
A turnover can eliminate a scoring opportunity while simultaneously giving the opposing offense another possession.
That is exactly why the interception comparison deserves more attention than the raw passing-yardage difference.
Individual Statistical Leaders
The main individual leaders from the game can be summarized as follows.
San Francisco 49ers
Passing: Mac Jones, 27/39, 347 yards, 0 TD, 2 INT
Rushing: Christian McCaffrey, 17 carries, 54 yards, 1 TD
Receiving: Kendrick Bourne, 5 receptions, 142 yards
Kicking: Eddy Pineiro, 4-for-4 field goals, 13 points
Tampa Bay Buccaneers
Passing: Baker Mayfield, 17/23, 256 yards, 2 TD, 0 INT
Rushing: Rachaad White, 17 carries, 65 yards, 1 TD
Receiving: Kameron Johnson, 4 receptions, 64 yards, 1 TD
Interceptions: Kindle Vildor and Jamel Dean, one each
These leaders show why the game cannot be reduced to one matchup.
Both teams had productive individual performers, but Tampa Bay received stronger complementary production across passing, rushing, and defense.
The Most Important Statistical Mismatches
Several statistical mismatches stand out.
Passing Volume vs Passing Efficiency
San Francisco had 347 passing yards compared with Tampa Bay’s 256.
But Mayfield threw two touchdowns without an interception, while Jones threw none and had two interceptions.
Rushing Production
Tampa Bay gained 104 rushing yards compared with 67 for San Francisco.
The Buccaneers also scored two rushing touchdowns.
Pass Protection
Tampa Bay allowed one sack.
San Francisco allowed six.
That is a five-sack difference.
Defensive Pressure
Tampa Bay recorded 10 quarterback hits.
San Francisco recorded one.
Scoring Consistency
Tampa Bay scored in all four quarters.
San Francisco did not score in the fourth quarter.
Taken together, these numbers provide a much clearer explanation of the 30-19 result.
How to Read These Stats Without Overvaluing One Number
A common mistake when reviewing an NFL box score is to select one large number and use it as the entire explanation.
For this matchup, that number might be Jones’ 347 passing yards or Bourne’s 142 receiving yards.
Both are impressive.
But they do not explain the result by themselves.
A better method is to examine the game through several layers:
First, look at scoring efficiency.
How many touchdowns did each offense produce?
Second, look at turnovers.
Who protected the football?
Third, look at pressure.
Which offensive line and quarterback combination handled the pass rush better?
Fourth, examine rushing efficiency.
Was the offense able to produce without relying entirely on the quarterback?
Finally, compare situational scoring.
Did production continue into the second half and fourth quarter?
Using this method makes the statistical picture much easier to understand.
What Fantasy Football Players Can Learn From the Box Score
The game also contains useful fantasy football lessons, although individual fantasy scoring depends on league settings.
Kendrick Bourne’s five catches for 142 yards demonstrate the value of explosive receiving plays.
Mac Jones’ 347 yards also demonstrate that quarterback yardage alone does not guarantee a strong fantasy result. His two interceptions and zero passing touchdowns significantly affect his fantasy value.
Mayfield’s 256 yards with two touchdowns and no interceptions represent a different type of quarterback performance.
Rachaad White’s 17 carries for 65 yards and a touchdown provided Tampa Bay with reliable rushing production.
McCaffrey’s 17 carries for 54 yards and a touchdown gave San Francisco a touchdown-producing rushing contribution despite the team’s limited rushing efficiency.
Why Tampa Bay’s Receiver Situation Matters
The receiving statistics should also be viewed in the context of Tampa Bay’s personnel situation.
The NFL reported that the Buccaneers entered the game without Mike Evans, Chris Godwin, and Jalen McMillan. Emeka Egbuka, who had been an important part of the offense, also left the game with a hamstring injury. (NFL)
Despite those challenges, Tampa Bay still generated 256 passing yards and two passing touchdowns.
Kameron Johnson and Tez Johnson both scored their first NFL touchdowns, giving Mayfield productive options despite the changes at receiver. (NFL)
That context helps explain why Tampa Bay’s 17 completions were so efficient.
The Buccaneers did not need a huge number of receptions to produce a 30-point performance.
The Biggest Takeaway From the Box Score
The most useful insight from these 49ers vs tampa bay buccaneers match player stats is the difference between production and efficiency.
San Francisco produced:
- More passing yards
- More completions
- More total offensive yards
- More field goals
Tampa Bay produced:
- More touchdowns
- More rushing yards
- Fewer sacks allowed
- More sacks
- More quarterback hits
- More interceptions
- No interceptions thrown
- Points in every quarter
The Buccaneers therefore turned fewer total yards into more points.
That is the central statistical story of the matchup.
Frequently Asked Questions
What was the final score between the 49ers and Buccaneers?
The Tampa Bay Buccaneers defeated the San Francisco 49ers 30-19 in Week 6 of the 2025 NFL season.
Who led the 49ers in passing?
Mac Jones led San Francisco with 27 completions on 39 attempts for 347 yards, with no touchdowns and two interceptions.
Who led the Buccaneers in passing?
Baker Mayfield completed 17 of 23 passes for 256 yards and two touchdowns without an interception.
Who was the 49ers’ leading receiver?
Kendrick Bourne led San Francisco with five receptions for 142 yards. He did not record a touchdown.
Who led the Buccaneers in receiving?
Kameron Johnson led Tampa Bay with four receptions for 64 yards and one touchdown.
How many sacks did Tampa Bay record?
The Buccaneers recorded six sacks against San Francisco, while the 49ers recorded one sack against Tampa Bay.
Conclusion
The 49ers vs tampa bay buccaneers match player stats from the 2025 Week 6 matchup show why the Buccaneers were able to win despite producing fewer total offensive yards.
Mac Jones threw for 347 yards and Kendrick Bourne produced 142 receiving yards, giving San Francisco plenty of passing production. Christian McCaffrey also scored a rushing touchdown. However, San Francisco’s offense struggled to maintain that production because Tampa Bay generated six sacks, intercepted Jones twice, and limited the 49ers to 67 rushing yards.
Baker Mayfield was considerably more efficient. His 17-of-23 passing line produced 256 yards and two touchdowns without an interception. Rachaad White led the Buccaneers’ rushing attack with 65 yards and a touchdown, while Kameron Johnson added 64 receiving yards and a touchdown.
The team-level numbers reinforce the individual performances. Tampa Bay rushed for 104 yards, scored four total touchdowns through passing and rushing, recorded six sacks, and scored in every quarter. San Francisco finished with 19 points and was held scoreless in the fourth quarter.
The most revealing comparison is therefore not simply 347 passing yards against 256. It is the combination of turnovers, pressure, rushing efficiency, touchdown production, and second-half scoring. Tampa Bay protected its quarterback, disrupted San Francisco’s passing game, and consistently converted offensive opportunities into points.
That combination explains the 30-19 final score more effectively than total yardage alone.