LA Clippers vs Timberwolves Match Player Stats
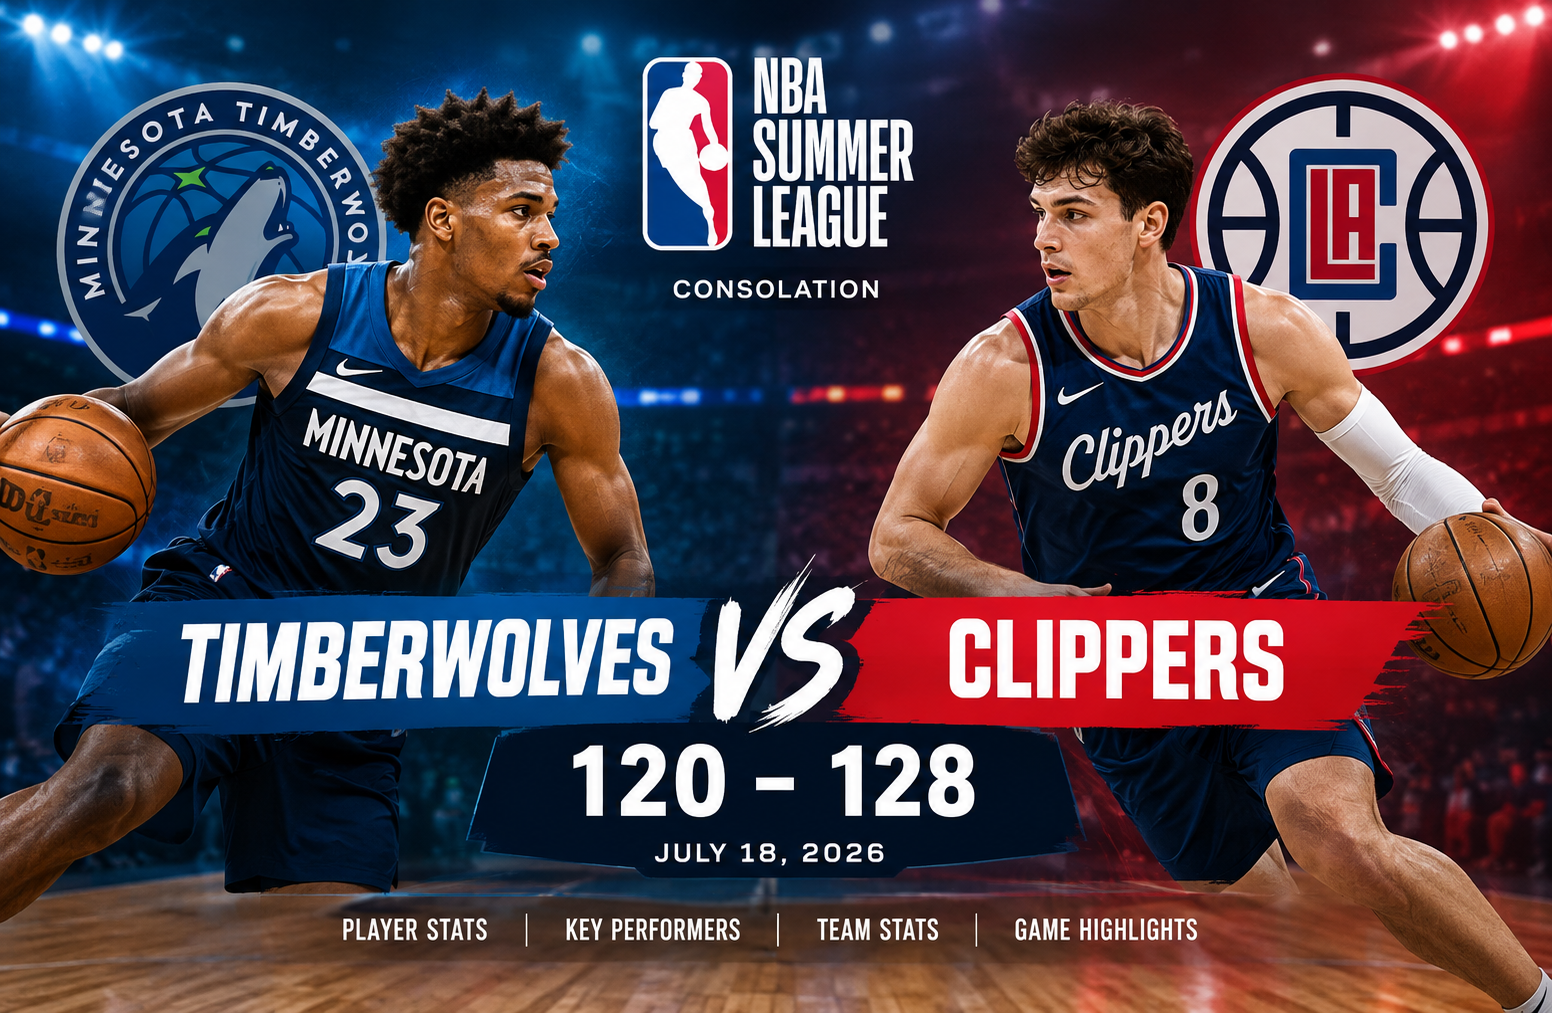
LA Clippers vs Timberwolves match player stats from the 2026 NBA Summer League meeting tell the story of a game that changed completely after halftime. The LA Clippers defeated the Minnesota Timberwolves 128-120 in overtime on July 18, 2026, at Thomas & Mack Center in Las Vegas. Los Angeles built a large lead, Minnesota produced a remarkable fourth-quarter comeback, and the Clippers eventually regained control in overtime.
The game is especially useful for readers who want more than the final score. The box score shows why Los Angeles won: the Clippers shot 55.3% from the field, dominated the paint 56-36, collected 41 rebounds, and produced 32 assists. Minnesota countered with excellent three-point shooting at 47.5% and a huge fourth quarter, but 18 turnovers and a difficult overtime period proved costly.
This article breaks down the major player performances, team statistics, quarter-by-quarter momentum, shooting numbers, rebounding battle, playmaking, turnovers, and the most important lessons from the game.
LA Clippers vs Timberwolves Match Player Stats
The most important individual numbers from the game were:
| Player | Team | Key performance |
|---|---|---|
| Keaton Wagler | LA Clippers | 26 points, 4 rebounds, 2 assists |
| Sean Pedulla | LA Clippers | 24 points, 5 rebounds, 11 assists, 6 steals |
| Norchad Omier | LA Clippers | 20 points, 15 rebounds |
| Nick Martinelli | LA Clippers | 18 points, 6 rebounds, 2 assists |
| Baba Miller | LA Clippers | 15 points, 4 rebounds, 6 assists |
| Jaylin Williams | Timberwolves | 21 points on 8-for-10 shooting |
| Zyon Pullin | Timberwolves | 18 points, 3 rebounds, 8 assists |
| Rocco Zikarsky | Timberwolves | 16 points, 7 rebounds, 5 assists, 2 blocks |
| Isaiah Evans | Timberwolves | 14 points, 2 rebounds, 3 assists |
The official recap confirms that Wagler led Los Angeles with 26 points, while Pedulla delivered 24 points and 11 assists. On Minnesota’s side, Williams scored 21 points, Pullin added 18 points and eight assists, and Zikarsky contributed 16 points, seven rebounds, five assists and two blocks.
One important distinction is worth making when reading the statistics: this was an NBA Summer League game rather than a regular-season NBA matchup. Summer League rotations, lineups, playing time and player roles can differ significantly from what fans would see during the regular season.
Game Overview: Clippers 128, Timberwolves 120
The Clippers entered the game with a 2-2 Summer League record, while Minnesota was also 2-2. After the result, Los Angeles moved to 3-2 and Minnesota dropped to 2-3. The game was part of the 2026 NBA Summer League consolation schedule.
Los Angeles controlled much of the opening three quarters.
The Clippers scored 20 points in the first quarter and then exploded for 38 in the second. They added 34 in the third to establish a substantial advantage.
Minnesota did not simply fade away.
Instead, the Timberwolves produced a 40-point fourth quarter and forced overtime. Minnesota erased a 27-point deficit late in the third quarter, making the comeback one of the defining features of the contest.
The final five minutes of regulation therefore do not tell the complete story. Los Angeles was the better team for much of the game, but Minnesota’s late offensive surge completely changed the pressure of the matchup.
In overtime, however, the Clippers responded.
Los Angeles scored 13 points in the extra period compared with five for Minnesota. Pedulla was particularly important, scoring nine of his 24 points during overtime.
That response ultimately separated the two teams.
Quarter-by-Quarter Breakdown
The official linescore lists the scoring as follows:
| Period | Timberwolves | Clippers |
|---|---|---|
| 1st | 19 | 20 |
| 2nd | 23 | 38 |
| 3rd | 33 | 34 |
| 4th | 40 | 23 |
| Overtime | 5 | 13 |
| Final | 120 | 128 |
First Quarter
The opening period was relatively even.
Minnesota scored 19 points while Los Angeles scored 20. Neither side established meaningful separation, and the one-point difference suggested the game could develop into a competitive contest.
For Minnesota, the first quarter was important because it kept the game within reach despite Los Angeles eventually finding another level offensively.
Second Quarter
The second quarter was the turning point.
Los Angeles scored 38 points while Minnesota managed 23. That produced a 15-point quarter advantage and gave the Clippers the foundation for their eventual lead.
The Clippers’ offensive efficiency was particularly significant because they were not relying exclusively on three-point shooting. Their ability to generate points inside became one of the clearest statistical differences between the teams.
Third Quarter
Los Angeles continued to score efficiently, producing 34 points.
Minnesota scored 33, so the Timberwolves were not being completely outplayed offensively. The problem was that they were still trying to recover from the damage created during the second quarter.
The Clippers’ advantage reached 27 points late in the third quarter.
Fourth Quarter
This was Minnesota’s best period of the game.
The Timberwolves scored 40 points while limiting Los Angeles to 23. That 17-point advantage was enough to erase the deficit and force overtime.
Jaylin Williams was a major contributor during Minnesota’s overall scoring effort. He finished with 21 points on 8-for-10 shooting.
The comeback also demonstrated Minnesota’s ability to generate efficient offense even after spending much of the game chasing a large deficit.
Overtime
Overtime completely reversed the momentum.
Minnesota managed only five points.
Los Angeles scored 13, including nine from Sean Pedulla. That made Pedulla one of the most important players in the entire game, not merely because of his final statistics but because of when his scoring occurred.
Keaton Wagler’s 26-Point Performance
Keaton Wagler was the Clippers’ leading scorer with 26 points.
He also recorded four rebounds and two assists.
The performance was notable because Wagler was the fifth overall pick in the 2026 NBA Draft. The game represented his highest-scoring performance of the Summer League.
Wagler’s scoring mattered in two different ways.
First, he helped Los Angeles create separation during the middle portion of the game.
Second, his scoring gave the Clippers another perimeter threat alongside Pedulla and their interior production.
His 26 points were the highest total by either team in the matchup, making him the leading scorer in the box score.
For readers evaluating Summer League performances, it is also important not to treat one game as a complete projection of a player’s NBA career. Summer League provides useful evidence about skills and tendencies, but roles, defensive schemes and competition can change considerably once regular-season rotations are established.
Sean Pedulla’s All-Around Impact
Sean Pedulla produced perhaps the most complete statistical performance for Los Angeles.
He finished with:
- 24 points
- 5 rebounds
- 11 assists
- 6 steals
His 11 assists were the most in the game.
His six steals were also the most in the game.
Then came the most important part: nine of his 24 points arrived in overtime.
That combination makes Pedulla’s performance particularly interesting.
A player can accumulate impressive statistics during a long game, but overtime production carries a different context because every possession becomes more important. Pedulla’s nine overtime points helped Los Angeles turn a tied game into an eight-point victory.
His 11 assists also show that his influence was not limited to scoring.
The Clippers finished with 32 assists as a team, and Pedulla was responsible for a substantial share of that playmaking.
Norchad Omier Controls the Glass
Norchad Omier provided one of the strongest interior performances.
He finished with 20 points and 15 rebounds, giving him a double-double.
His rebounding was particularly important because Los Angeles finished with 41 total rebounds compared with 31 for Minnesota.
That 10-rebound difference gave the Clippers additional possessions and helped compensate for Minnesota’s superior three-point percentage.
Omier also shot efficiently, with the official team game data listing him at 8-for-10 from the field, 2-for-2 from three-point range and 1-for-1 from the free-throw line.
That is an important detail because his contribution was not simply volume rebounding.
He combined interior work with highly efficient scoring.
Jaylin Williams Leads Minnesota’s Scoring
Jaylin Williams led Minnesota with 21 points.
He scored those 21 points on 8-for-10 shooting.
That shooting efficiency stands out immediately.
Williams did not need a large number of attempts to reach his team-high total. His efficient scoring helped Minnesota produce its fourth-quarter comeback and remained one of the clearest individual positives from the Timberwolves’ performance.
For a player evaluation, the combination of scoring volume and shooting efficiency is more informative than points alone.
Twenty-one points on 8-for-10 shooting indicates a very different offensive performance from 21 points on 8-for-20 shooting.
Zyon Pullin’s Playmaking
Zyon Pullin finished with 18 points, three rebounds and eight assists.
His eight assists were the most for Minnesota.
Pullin’s performance illustrates Minnesota’s balanced offensive approach.
He was not simply a scorer.
His eight assists show that he was also responsible for creating opportunities for teammates. That becomes particularly important when analyzing the Timberwolves’ 28 team assists.
Minnesota had enough playmaking to generate 120 points, but the team’s 18 turnovers reduced the value of some of those possessions.
That is one of the clearest statistical tensions in the game: Minnesota created plenty of offense but also gave away too many possessions.
Rocco Zikarsky’s Interior Contribution
Rocco Zikarsky finished with 16 points, seven rebounds, five assists and two blocks.
His line is notable because it covers several statistical categories.
Seven rebounds helped Minnesota compete on the glass.
Five assists showed that he contributed as a passer.
Two blocks added defensive value.
His overall production therefore went beyond scoring.
Zikarsky was also one of the players who helped Minnesota maintain pressure during the comeback. While the fourth quarter belonged to the Timberwolves collectively, performances such as Zikarsky’s helped keep the offense productive.
Team Shooting Comparison
The shooting numbers provide one of the clearest explanations for the final result.
| Statistic | Timberwolves | Clippers |
|---|---|---|
| Field goals | 37/73 | 47/85 |
| Field-goal percentage | 50.7% | 55.3% |
| Three-pointers | 19/40 | 13/32 |
| Three-point percentage | 47.5% | 40.6% |
| Free throws | 16/23 | 14/16 |
| Free-throw percentage | 69.6% | 87.5% |
Minnesota actually had the better three-point percentage.
The Timberwolves made 19 threes on 40 attempts, compared with 13 made threes on 32 attempts by Los Angeles.
That is a substantial perimeter advantage.
However, the Clippers made 10 more field goals overall.
That difference is critical.
Los Angeles attempted 85 field goals compared with Minnesota’s 73 and converted 47 of them. The Clippers also generated a major advantage in points in the paint.
The result was an important lesson in interpreting shooting statistics: a team can shoot a higher percentage from three and still lose because the opponent creates more efficient offense elsewhere.
The Paint Battle Was a Major Difference
The Clippers scored 56 points in the paint.
Minnesota scored 36.
That gave Los Angeles a 20-point advantage in an area that does not require exceptional three-point shooting to generate production.
The paint advantage also connects directly to the rebounding numbers.
Los Angeles collected 41 rebounds, while Minnesota recorded 31.
More rebounds can create more possessions.
More interior scoring can increase shooting efficiency.
Together, those advantages helped the Clippers build their lead even though Minnesota was more accurate from three-point range.
Rebounding Comparison
The rebounding statistics were:
- Clippers: 41 rebounds
- Timberwolves: 31 rebounds
- Difference: Clippers +10
Norchad Omier was the biggest individual factor, collecting 15 rebounds.
His rebounding performance was particularly significant because Minnesota had several players contributing on the glass, yet the team still finished 10 rebounds behind Los Angeles.
For Summer League games, where lineups can include young big men and developing players, rebounding is often one of the easiest statistics to connect directly to possession control.
Every additional offensive rebound can create another scoring opportunity.
Assists and Ball Movement
Los Angeles recorded 32 assists.
Minnesota recorded 28.
The difference was not enormous, but it favored the winning team.
Pedulla’s 11 assists accounted for a large part of Los Angeles’ playmaking.
Pullin’s eight assists led Minnesota.
Both teams therefore had primary creators capable of involving teammates.
The difference came partly from efficiency.
Los Angeles converted more of its overall field-goal attempts, which meant that its ball movement translated into a higher number of made shots.
Turnovers Changed the Possession Battle
Minnesota committed 18 turnovers.
Los Angeles committed 15.
That three-turnover difference might appear small, but it mattered because the game was ultimately decided by eight points after overtime.
The game data also lists 18 points off turnovers for Minnesota’s opponent and 25 points off turnovers for Los Angeles in the game statistics.
The broader lesson is that offensive efficiency cannot be separated from possession security.
Minnesota scored 120 points, so its offense was clearly capable of producing at a high level.
But losing possessions through turnovers limited how much of that scoring potential could translate into victory.
Defensive Activity
The Clippers finished with 10 steals compared with six for Minnesota.
Both teams recorded two blocks.
Pedulla’s six steals were especially important.
Six steals from one player is an unusually active defensive contribution in a single game, and those takeaways complemented his 24 points and 11 assists.
Minnesota’s two blocks were matched by Los Angeles, but the Clippers’ advantage in steals gave them another way to disrupt the Timberwolves’ offense.
Why Minnesota’s Comeback Worked
The fourth-quarter comeback was not random.
Several statistical elements supported it.
First, Minnesota scored 40 points in the fourth quarter.
Second, the Timberwolves were already shooting 47.5% from three for the game.
Third, Jaylin Williams was highly efficient from the field.
Fourth, Pullin provided consistent playmaking.
The combination created enough offensive pressure to overcome a large deficit.
The Timberwolves also took advantage of a sharp drop in Los Angeles’ fourth-quarter scoring. The Clippers scored only 23 points after putting up 34 in the third quarter.
That 11-point reduction in offensive production opened the door for Minnesota.
The comeback ultimately failed because the Clippers recovered in overtime.
Why the Clippers Won
The final result can be explained through several connected numbers rather than one statistic.
1. Superior overall shooting
Los Angeles shot 55.3% from the field.
Minnesota shot about 50.7%.
That gave the Clippers a substantial advantage on their two-point and overall field-goal production.
2. Rebounding advantage
The Clippers won the rebounding battle 41-31.
That created a 10-rebound possession advantage.
3. Interior scoring
Los Angeles scored 56 points in the paint compared with 36 for Minnesota.
That was a 20-point advantage.
4. Fewer turnovers
The Clippers committed 15 turnovers versus 18 for Minnesota.
5. Overtime execution
Los Angeles scored 13 points in overtime.
Minnesota scored five.
Pedulla scored nine of those 13 Clippers points.
When these factors are viewed together, the final score becomes much easier to understand.
Minnesota’s three-point shooting and fourth-quarter offense were excellent, but Los Angeles produced advantages across several other areas.
The Biggest Statistical Contrast
The most interesting contrast in this matchup was not simply scoring.
It was the difference between perimeter efficiency and overall possession efficiency.
Minnesota made 19 three-pointers.
Los Angeles made only 13.
That might suggest that Minnesota should have won the shooting battle.
But Los Angeles made 47 field goals compared with 37 for Minnesota.
The Clippers also collected 10 more rebounds and scored 20 more points in the paint.
This is why box-score analysis should never focus on one statistic.
A three-point percentage can explain part of a game.
It cannot explain the entire game.
Summer League Context Matters
This matchup took place during the 2026 NBA Summer League, so the statistics should be interpreted within that context.
Summer League is designed to give young players opportunities to compete, develop and demonstrate skills. Rotations are often different from regular-season basketball, and players can have much larger or smaller roles than they might receive later in their careers.
That makes the game useful for understanding individual performances without turning one box score into a definitive career projection.
For example, Wagler’s 26 points were important in this game, while Pedulla’s overtime scoring and playmaking were central to the victory. Those are meaningful observations, but they should be considered alongside a player’s wider Summer League sample and eventual NBA role.
A Note About the Date and Official Records
The game is commonly referenced as the July 18, 2026 matchup because that is the date shown in the official game information and recap.
The game page also identifies the matchup as a July 17 game in its scheduling header because the contest began at 8:00 PM Pacific Time on July 17 in Las Vegas and extended into the early hours of July 18 in some time zones. The official game information lists Saturday, July 18, 2026, at 3:00 AM in its game-information section.
For consistency, this article uses July 18, 2026 as the game date.
The official game record also confirms the venue as Thomas & Mack Center in Las Vegas and lists Matt Rafferty, Ashley Birch and Evan Singletary as the officials.
Where the Game Was Shown
The official game listing identifies ESPN as the television outlet for the matchup.
For anyone reviewing the game after the fact, the game recap and highlights also provide sequences from Wagler, Pedulla, Omier, Zikarsky and Williams.
What the Box Score Says About Each Team
Minnesota Timberwolves
Minnesota’s strongest statistical areas were three-point shooting and fourth-quarter offense.
The Timberwolves made 19 three-pointers and shot 47.5% from deep. They also scored 40 points in the fourth quarter, transforming what looked like a comfortable Clippers victory into an overtime game.
Their biggest problems were turnovers, rebounding and interior scoring.
Eighteen turnovers were three more than Los Angeles committed. Minnesota also lost the rebounding battle by 10 and was outscored by 20 points in the paint.
LA Clippers
Los Angeles’ profile was different.
The Clippers shot 55.3% overall, scored 56 points in the paint and collected 41 rebounds.
Wagler supplied the highest scoring total with 26 points.
Pedulla combined scoring and playmaking with 24 points, 11 assists and six steals.
Omier added 20 points and 15 rebounds.
That gave Los Angeles multiple ways to generate offense instead of relying on one player or one type of shot.
What Readers Should Take From These Player Stats
If you are using the game as a reference point for player evaluation, several numbers deserve particular attention.
Keaton Wagler: 26 points and four rebounds, showing his scoring impact in the Clippers’ victory.
Sean Pedulla: 24 points, 11 assists and six steals, with nine points coming in overtime.
Norchad Omier: 20 points and 15 rebounds, providing a major interior presence.
Jaylin Williams: 21 points on 8-for-10 shooting, making him Minnesota’s leading scorer.
Zyon Pullin: 18 points and eight assists, giving Minnesota an important combination of scoring and creation.
Rocco Zikarsky: 16 points, seven rebounds, five assists and two blocks, offering production across multiple categories.
These performances also show why player statistics should be viewed in context. A scorer’s points, a guard’s assists and a center’s rebounds are meaningful, but the surrounding team numbers help explain how those individual contributions affected the game.
Frequently Asked Questions
Who led the Clippers in scoring against the Timberwolves?
Keaton Wagler led the Clippers with 26 points. He also recorded four rebounds and two assists.
Who led the Timberwolves in scoring?
Jaylin Williams led Minnesota with 21 points. He shot 8-for-10 from the field.
Who had the most assists in the game?
Sean Pedulla led all players with 11 assists for the Clippers. Zyon Pullin led Minnesota with eight assists.
Who had the most rebounds?
Norchad Omier led the game with 15 rebounds for Los Angeles.
How did the Timberwolves force overtime?
Minnesota scored 40 points in the fourth quarter while holding Los Angeles to 23. The Timberwolves erased a large Clippers lead and forced overtime.
What was the final score?
The LA Clippers defeated the Minnesota Timberwolves 128-120 in overtime in the 2026 NBA Summer League consolation game.
Conclusion
The LA Clippers vs Timberwolves match player stats from this Summer League matchup reveal a game that was far more competitive than the final eight-point margin suggests.
Los Angeles won because it combined efficient overall shooting with strong interior scoring, superior rebounding and better overtime execution. The Clippers shot 55.3% from the field, scored 56 points in the paint and won the rebounding battle 41-31.
Minnesota’s biggest strengths were its three-point shooting and fourth-quarter response. The Timberwolves made 19 three-pointers and scored 40 points in the fourth quarter, enough to erase a substantial deficit and send the game to overtime.
Individually, Wagler’s 26 points led Los Angeles, while Pedulla produced one of the game’s most complete performances with 24 points, 11 assists and six steals. His nine overtime points were especially important. Omier’s 20 points and 15 rebounds gave the Clippers another major advantage inside.
For Minnesota, Williams’ 21 points on 8-for-10 shooting stood out, while Pullin’s eight assists and Zikarsky’s 16-point, seven-rebound, five-assist and two-block performance showed the team’s broader offensive contributions.
The most useful lesson from the box score is that three-point shooting alone did not determine the result. Minnesota was more accurate from deep, but Los Angeles compensated by shooting better overall, dominating the paint, winning the glass and taking better advantage of the extra period.
The official game record and recap are the primary references for the statistics discussed here.