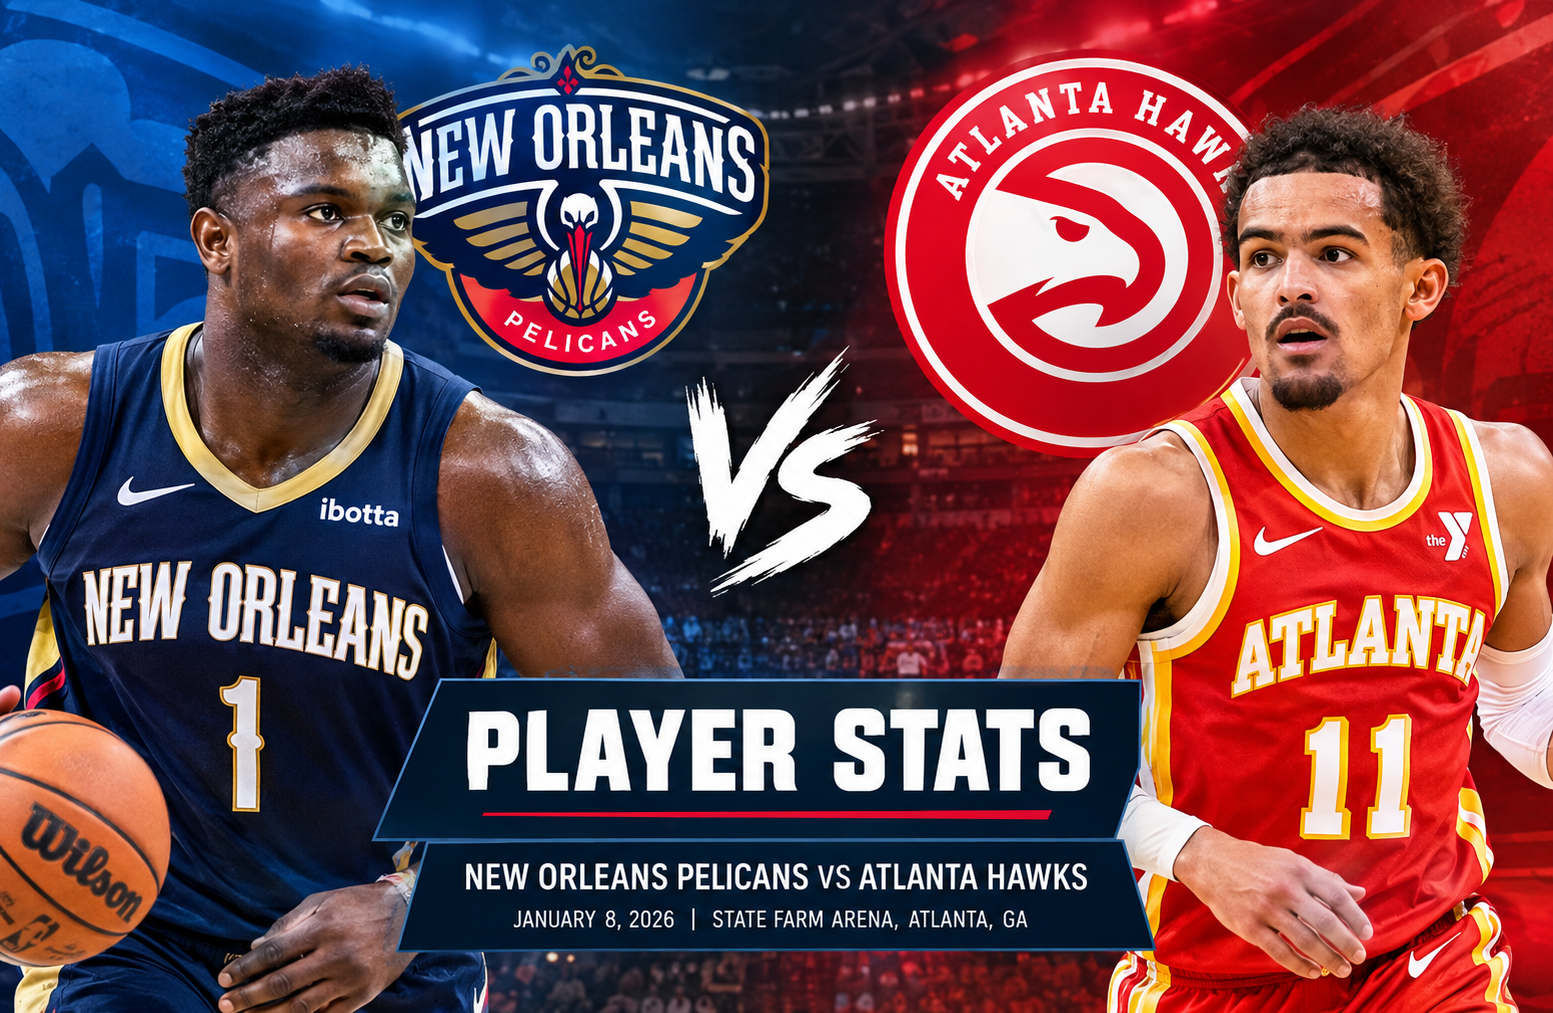
New Orleans Pelicans vs Atlanta Hawks Match Player Stats
The new orleans pelicans vs atlanta hawks match player stats from this matchup tell a clear story about how Atlanta controlled the game through three-point shooting, rebounding, ball movement, and a strong first half. The Hawks defeated the Pelicans 117-100 at State Farm Arena, with Zaccharie Risacher leading Atlanta with 25 points while Zion Williamson paced New Orleans with 22 points, 8 rebounds, and 6 assists. The official NBA game record lists the matchup around January 7 in Atlanta, with the game information timestamp extending into January 8. official NBA box score
The final score was not simply the result of one player having a big night. Atlanta created separation early, won the rebounding battle 49-40, made 18 three-pointers compared with New Orleans’ eight, and produced 30 assists. New Orleans had several productive individual performances, including 21 points from Jordan Poole and 20 from Bryce McGowens, but the Pelicans could not overcome Atlanta’s offensive balance.
This article breaks down the complete player production, team statistics, quarter-by-quarter flow, major individual performances, shooting differences, rebounding battle, defensive contributions, and the statistical reasons behind the 17-point margin.
New Orleans Pelicans vs Atlanta Hawks Match Player Stats
The most important numbers from the matchup provide an immediate picture of how the game developed.
| Category | New Orleans Pelicans | Atlanta Hawks |
| Final Score | 100 | 117 |
| Field Goals | 38-86 | 44-95 |
| Field Goal % | 44% | 46% |
| Three-Pointers | 8-28 | 18-47 |
| Three-Point % | 29% | 38% |
| Free Throws | 16-25 | 11-17 |
| Free Throw % | 64% | 65% |
| Rebounds | 40 | 49 |
| Assists | 26 | 30 |
| Turnovers | 19 | 19 |
| Steals | 13 | 13 |
| Blocks | 9 | 10 |
| Offensive Rebounds | 6 | 11 |
| Defensive Rebounds | 34 | 38 |
| Personal Fouls | 15 | 19 |
The table shows why the game cannot be explained by field goal percentage alone.
Atlanta shot only about two percentage points better overall, but the Hawks generated 10 more made three-pointers. That difference alone accounted for 30 additional points from beyond the arc.
The Hawks also collected nine more rebounds and five more offensive rebounds. Their 30 assists compared with New Orleans’ 26 further demonstrate how Atlanta created a more balanced offensive attack.
Both teams committed 19 turnovers, so turnovers were not the deciding statistical category. Instead, Atlanta gained its advantage through shot quality, three-point production, second-chance opportunities, and contributions from multiple players.
How the Game Unfolded
The quarter scores explain the final result better than the final score by itself.
| Quarter | Pelicans | Hawks |
| First | 26 | 37 |
| Second | 27 | 28 |
| Third | 13 | 24 |
| Fourth | 34 | 28 |
| Total | 100 | 117 |
Atlanta immediately established control by scoring 37 points in the opening quarter.
New Orleans responded with 27 points in the second quarter, but Atlanta still added 28. The Hawks therefore carried a 12-point advantage into halftime.
The third quarter was the most damaging period for New Orleans. The Pelicans managed only 13 points while Atlanta scored 24. That created an 18-point difference over the 12-minute period and pushed the Hawks into a commanding position.
New Orleans played much better offensively in the fourth quarter, scoring 34 points. However, Atlanta still scored 28 and never allowed the deficit to become a genuine threat to the result.
First Quarter: Atlanta Sets the Tone
Atlanta’s 37-point opening period immediately forced New Orleans to play from behind.
Zaccharie Risacher was particularly important to Atlanta’s early offense, while the Hawks also received production from Jalen Johnson, Mouhamed Gueye, Dyson Daniels, and Nickeil Alexander-Walker.
New Orleans had 26 points, which is normally a respectable quarter. The problem was that Atlanta’s offense was even more efficient and productive.
The early deficit also created a strategic challenge for the Pelicans. Once Atlanta established the lead, New Orleans needed to increase offensive pressure without giving away additional opportunities in transition or from three-point range.
Second Quarter: Pelicans Stay Competitive
The second quarter was much closer.
New Orleans scored 27 points while Atlanta scored 28. That meant the Pelicans did not lose additional ground during the period, but they also did not erase the first-quarter deficit.
At halftime, Atlanta held a 65-53 advantage.
This was an important point in the game because New Orleans was still within striking distance. A strong third quarter could have changed the momentum.
Instead, the opposite happened.
Third Quarter: The Decisive Stretch
The third quarter was arguably the most important statistical segment.
New Orleans scored just 13 points.
Atlanta scored 24.
That 11-point quarter advantage expanded the overall lead from 12 points at halftime to 23 points entering the fourth quarter.
The Pelicans eventually scored 34 in the final period, but a 23-point deficit entering the fourth made the comeback extremely difficult.
This is one of the most useful lessons when analyzing basketball box scores. A team’s final scoring total can sometimes hide when the game was actually decided. In this case, New Orleans finished with 100 points, but the 13-point third quarter was a major reason the offense could not keep pace.
Zion Williamson Leads New Orleans
Zion Williamson was the most productive Pelicans starter.
He finished with:
- 22 points
- 8 rebounds
- 6 assists
- 1 steal
- 10-of-15 field goals
- 66.7% field goal shooting
Williamson’s 10-of-15 shooting was one of the most efficient scoring performances in the game.
His six assists also show that his contribution went beyond scoring. When defenses reacted to his interior attacks, he was able to create opportunities for teammates.
However, the free throw line was less productive. He made 2 of 7 attempts, which limited his scoring efficiency compared with what his field goal percentage suggests.
The broader statistical picture is important. Williamson had an excellent individual shooting night, but basketball is a five-player game. Atlanta’s greater three-point production and team-wide balance outweighed New Orleans’ interior scoring.
Jordan Poole Provides Perimeter Scoring
Jordan Poole finished with 21 points, making him the Pelicans’ second-leading scorer.
His line included:
- 21 points
- 1 rebound
- 3 assists
- 3 steals
- 6-of-13 from three-point range
The six made three-pointers were especially significant.
Poole supplied a large portion of New Orleans’ perimeter offense, and his 6-of-13 performance from deep was considerably better than the team’s overall 8-of-28 three-point shooting.
That contrast highlights a major issue for New Orleans. If Poole made six threes and the entire team made only eight, the remaining Pelicans combined for just two made shots from beyond the arc.
Atlanta, by comparison, made 18 threes as a team.
Bryce McGowens Adds 20 Points
Bryce McGowens scored 20 points and was another important source of offense for New Orleans.
His scoring helped the Pelicans produce 34 points in the fourth quarter.
McGowens’ contribution was particularly useful because New Orleans needed additional scoring around Williamson and Poole. Without his 20 points, the final offensive output would have been considerably lower.
Still, individual scoring could not completely compensate for Atlanta’s advantage in three-point volume and rebounding.
Derik Queen’s All-Around Contribution
Derik Queen produced one of the more interesting statistical lines for New Orleans.
He finished with:
- 6 points
- 10 rebounds
- 2 assists
- 2 steals
- 2 blocks
Queen led the Pelicans in rebounds and steals while also contributing two blocks.
His 10 rebounds were particularly valuable because Atlanta won the overall rebounding battle. New Orleans needed more players to provide that type of production on the glass.
Queen’s defensive activity also helped the Pelicans generate possessions and protect the paint.
Micah Peavy Fills Multiple Roles
Micah Peavy recorded:
- 11 points
- 5 rebounds
- 6 assists
- 2 steals
- 2 blocks
The six assists were tied for the Pelicans’ highest individual total alongside Williamson.
Peavy’s production illustrates why a box score should not be reduced to scoring alone. Eleven points may not look dominant next to Williamson’s 22, but adding five rebounds, six assists, two steals, and two blocks creates a highly active all-around contribution.
His six assists were especially important on a team that finished with 26 total assists.
Jeremiah Fears Contributes on Both Ends
Jeremiah Fears finished with 11 points, 4 rebounds, 3 assists, 1 steal, and 1 block.
He provided a balanced contribution without dominating the ball.
For New Orleans, the challenge was not necessarily the absence of individual production. Several players reached double figures or contributed across multiple categories.
The larger issue was the difference between New Orleans’ collective production and Atlanta’s efficiency from three-point range.
Pelicans Bench Production
New Orleans received several useful contributions from its bench.
| Player | Points | Rebounds | Assists | Steals | Blocks |
| Bryce McGowens | 20 | 2 | 3 | 1 | 0 |
| Micah Peavy | 11 | 5 | 6 | 2 | 2 |
| Yves Missi | 5 | 4 | 2 | 1 | 0 |
| Kevon Looney | 2 | 2 | 0 | 1 | 0 |
| Jordan Hawkins | 0 | 0 | 0 | 0 | 3 |
The most notable bench performance was McGowens’ 20 points.
Peavy also provided a substantial all-around contribution. His six assists and two blocks gave New Orleans playmaking and defensive activity.
Jordan Hawkins did not score, but he recorded three blocks. That is a good example of why a player’s value cannot always be measured by points alone.
Atlanta’s Zaccharie Risacher Leads All Scorers
Zaccharie Risacher was the game’s leading scorer with 25 points.
His statistical line was:
- 25 points
- 8 rebounds
- 7-of-9 from three-point range
- 1 block
The three-point shooting was the standout number.
Risacher converted seven of his nine attempts from beyond the arc, an extraordinary 77.8% three-point rate for the game.
Atlanta made 18 threes as a team, meaning Risacher alone accounted for seven of those makes.
That type of shooting performance can dramatically alter a game because each successful three adds three points while also forcing the defense to respect a larger area of the floor.
Jalen Johnson Controls Multiple Areas
Jalen Johnson finished with:
- 19 points
- 8 rebounds
- 5 assists
He also contributed strong two-way activity throughout the game.
His eight rebounds helped Atlanta establish control on the glass, while five assists added to the Hawks’ 30 total assists.
Johnson’s performance was another example of Atlanta receiving meaningful production from several starters rather than relying on one scorer.
Mouhamed Gueye Produces a Complete Stat Line
Mouhamed Gueye had one of the most versatile performances of the night:
- 10 points
- 11 rebounds
- 6 assists
- 4 steals
- 2 blocks
The four steals were particularly notable.
Gueye was Atlanta’s rebounding leader with 11 and also tied for the team’s highest individual block total.
His six assists added another layer to the performance.
This kind of stat line helps explain why Atlanta’s offensive and defensive numbers were so balanced. Gueye was contributing in several different phases rather than only finishing plays.
Dyson Daniels Runs the Offense
Dyson Daniels recorded:
- 13 points
- 8 rebounds
- 8 assists
- 3 steals
- 1 block
His eight assists were the highest individual total for Atlanta.
Daniels was therefore central to the Hawks’ ball movement. Atlanta finished with 30 assists, four more than New Orleans.
His eight rebounds also helped the Hawks maintain their advantage on the glass.
Nickeil Alexander-Walker Adds Two-Way Production
Nickeil Alexander-Walker finished with:
- 17 points
- 6 rebounds
- 6 assists
- 3 steals
- 2 blocks
This was another broad statistical contribution.
His six assists helped Atlanta maintain its passing advantage, while three steals and two blocks showed significant defensive involvement.
Even though his three-point shooting was not especially efficient at 2-of-12, he still contributed 17 points through other parts of his offensive game.
That distinction matters when evaluating the Hawks. Atlanta did not require every player to shoot efficiently from outside because Risacher and other shooters provided enough perimeter production collectively.
Atlanta’s Bench Adds More Shooting
The Hawks’ reserves supplied important scoring.
| Player | Points | Rebounds | Assists | Steals | Blocks |
| Kristaps Porzingis | 13 | 3 | 2 | 1 | 1 |
| Luke Kennard | 13 | 0 | 1 | 1 | 1 |
| Vit Krejci | 5 | 4 | 1 | 1 | 1 |
| Asa Newell | 2 | 1 | 1 | 0 | 0 |
| Keaton Wallace | 0 | 0 | 0 | 0 | 0 |
Porzingis and Kennard each scored 13 points.
Kennard was particularly efficient from three-point range, making three of four attempts.
Porzingis also made four three-pointers.
These bench contributions made Atlanta’s offense difficult to contain because New Orleans could not focus exclusively on the starting lineup.
Three-Point Shooting Was the Biggest Statistical Difference
The clearest difference in the box score was perimeter shooting.
New Orleans:
8-of-28 from three
Atlanta:
18-of-47 from three
That is a difference of 10 made three-pointers.
Those 10 additional made threes represent 30 points.
The Pelicans shot 28.6% from three, while the Hawks shot 38.3%.
The difference becomes even more interesting when considering shot volume. Atlanta attempted 47 threes compared with 28 for New Orleans.
So Atlanta both attempted more three-pointers and made more of them.
This created a major scoring advantage that was difficult for New Orleans to erase.
Rebounding Gave Atlanta Extra Possessions
Atlanta collected 49 rebounds compared with 40 for New Orleans.
The offensive rebounding difference was also significant:
- Hawks: 11 offensive rebounds
- Pelicans: 6 offensive rebounds
Those five additional offensive rebounds created extra possessions.
Atlanta’s 38 defensive rebounds also helped limit second-chance opportunities for New Orleans.
New Orleans had 34 defensive rebounds, so the Pelicans were not completely dominated on the defensive glass. However, Atlanta’s overall rebounding edge was enough to matter.
Assists Show Atlanta’s Offensive Balance
The Hawks recorded 30 assists.
The Pelicans recorded 26.
The four-assist difference was not enormous, but it supports a broader pattern.
Atlanta had seven players in double figures according to the game recap and box score data, while New Orleans had several strong scorers but less consistent team shooting.
The Hawks’ scoring distribution included Risacher, Johnson, Alexander-Walker, Daniels, Porzingis, Kennard, and Gueye.
That made Atlanta harder to defend because scoring responsibility was spread across the lineup.
Turnovers Were Even
Both teams committed 19 turnovers.
That is an important detail because it means Atlanta did not win simply by taking better care of the ball.
The turnover battle was essentially even.
The Hawks instead created separation through:
- Three-point shooting
- Rebounding
- Offensive rebounding
- Balanced scoring
- Strong first and third quarters
This is a useful distinction for readers studying basketball statistics. When turnovers are equal, other possession and efficiency categories become even more important.
Defensive Activity Was High on Both Teams
Both teams recorded 13 steals.
The Hawks had 10 blocks compared with nine for the Pelicans.
That means defensive activity was relatively balanced in terms of the raw numbers.
New Orleans received two blocks each from Derik Queen, Jeremiah Fears, and Jordan Hawkins.
Atlanta received two blocks from Mouhamed Gueye and two from Nickeil Alexander-Walker, with Dyson Daniels adding one.
The difference was therefore not a lack of defensive effort by New Orleans.
Instead, Atlanta’s offensive execution created the separation.
Free Throw Shooting Was Similar
The Pelicans went 16-of-25 at the free throw line.
The Hawks went 11-of-17.
Both teams were close to 64% to 65%.
New Orleans actually attempted eight more free throws.
However, the Pelicans did not convert those opportunities at a high enough rate to offset Atlanta’s three-point advantage.
This is another reason the final score is best understood through multiple statistical categories rather than one number.
The Importance of Atlanta’s 18 Made Threes
Atlanta’s 18 made three-pointers deserve special attention.
To understand their effect, compare the scoring sources.
New Orleans scored 100 points.
Atlanta scored 117.
The Hawks’ 18 made threes generated 54 points from beyond the arc.
New Orleans’ eight made threes generated 24 points.
That creates a 30-point difference from three-point makes alone.
Other scoring areas narrowed that gap, but not enough to eliminate it.
This is arguably the central statistical explanation for the 117-100 result.
New Orleans Had Efficient Individual Shooting
One of the interesting aspects of the new orleans pelicans vs atlanta hawks match player stats is that New Orleans still had some highly efficient individual performances.
Williamson shot 10-of-15.
Poole made six three-pointers.
McGowens scored 20 points.
Queen collected 10 rebounds.
Peavy produced 11 points, five rebounds, six assists, two steals, and two blocks.
Yet the team still lost by 17.
This illustrates an important basketball principle: individual efficiency does not automatically translate into team success when the opponent creates more total value across shooting volume, rebounding, and lineup depth.
Why the Third Quarter Matters So Much
The third quarter deserves special emphasis because it transformed a manageable halftime deficit into a large gap.
Halftime score:
Hawks 65, Pelicans 53
Third-quarter score:
Hawks 24, Pelicans 13
After three quarters:
Hawks 89, Pelicans 66
New Orleans therefore entered the fourth quarter down 23 points.
The Pelicans scored 34 in the final period, which was their best quarter of the game.
However, Atlanta’s 28 points prevented the deficit from shrinking enough.
The fourth quarter therefore demonstrated that New Orleans could score against Atlanta, but the earlier damage was too large.
Team Records and Season Context
The supplied game data lists New Orleans at 8-31 overall and 2-14 on the road entering the matchup.
Atlanta was listed at 18-21 overall and 7-11 at home.
The result moved the matchup in Atlanta’s favor for the season series, with the Hawks winning 2-0.
These records provide context but should not replace analysis of the individual game.
The most useful information for understanding this particular matchup remains the shooting, rebounding, assists, turnovers, and quarter-by-quarter scoring.
Complete Pelicans Player Production
Here is a consolidated view of the available New Orleans player statistics.
| Player | PTS | REB | AST | STL | BLK |
| Zion Williamson | 22 | 8 | 6 | 1 | 0 |
| Jordan Poole | 21 | 1 | 3 | 3 | 0 |
| Bryce McGowens | 20 | 2 | 3 | 1 | 0 |
| Jeremiah Fears | 11 | 4 | 3 | 1 | 1 |
| Micah Peavy | 11 | 5 | 6 | 2 | 2 |
| Derik Queen | 6 | 10 | 2 | 2 | 2 |
| Yves Missi | 5 | 4 | 2 | 1 | 0 |
| Karlo Matkovic | 2 | 4 | 1 | 1 | 1 |
| Kevon Looney | 2 | 2 | 0 | 1 | 0 |
| Jordan Hawkins | 0 | 0 | 0 | 0 | 3 |
The distribution shows that New Orleans had three players at 20 or more points.
That is a meaningful offensive contribution.
The problem was that the team’s production was not enough to overcome Atlanta’s shooting advantage.
Complete Hawks Player Production
Atlanta’s major player numbers were equally spread out.
| Player | PTS | REB | AST | STL | BLK |
| Zaccharie Risacher | 25 | 8 | 0 | 0 | 1 |
| Jalen Johnson | 19 | 8 | 5 | 0 | 1 |
| Nickeil Alexander-Walker | 17 | 6 | 6 | 3 | 2 |
| Dyson Daniels | 13 | 8 | 8 | 3 | 1 |
| Kristaps Porzingis | 13 | 3 | 2 | 1 | 1 |
| Luke Kennard | 13 | 0 | 1 | 1 | 1 |
| Mouhamed Gueye | 10 | 11 | 6 | 4 | 2 |
| Vit Krejci | 5 | 4 | 1 | 1 | 1 |
| Asa Newell | 2 | 1 | 1 | 0 | 0 |
| Keaton Wallace | 0 | 0 | 0 | 0 | 0 |
Atlanta’s balance is immediately visible.
Seven players reached double figures.
That kind of distribution makes it difficult for an opposing defense to stop the offense by targeting one scorer.
What the Player Stats Say About the Matchup
The new orleans pelicans vs atlanta hawks match player stats reveal several important themes.
First, New Orleans had legitimate individual scoring production.
Williamson, Poole, and McGowens combined for 63 points.
Second, Atlanta had broader scoring distribution.
Risacher led the Hawks with 25, but Johnson, Alexander-Walker, Daniels, Porzingis, Kennard, and Gueye all contributed at least 10 points.
Third, Atlanta had a major advantage from three-point range.
Fourth, the Hawks won the rebounding battle.
Fifth, turnovers were equal.
These points together explain the final result much better than simply saying Atlanta scored more.
A Closer Look at the Shooting Efficiency
New Orleans shot 38-of-86 overall.
Atlanta shot 44-of-95.
The overall field goal percentages were relatively close:
- New Orleans: 44.2%
- Atlanta: 46.3%
That difference alone would not explain a 17-point win.
The three-point numbers do.
New Orleans made 8-of-28.
Atlanta made 18-of-47.
The Hawks therefore gained a significant scoring advantage without needing a huge difference in overall field goal percentage.
This is why modern basketball analysis often pays close attention to three-point volume and efficiency.
What Happened on the Glass
Atlanta’s nine-rebound advantage was another important factor.
The Hawks grabbed 49 total rebounds.
The Pelicans grabbed 40.
More importantly, Atlanta had 11 offensive rebounds.
New Orleans had six.
Offensive rebounds can extend possessions and create additional opportunities even when the initial shot misses.
A team that combines high three-point volume with strong offensive rebounding can create a difficult defensive workload because the opponent must repeatedly finish possessions successfully.
Atlanta achieved that combination in this game.
Individual Defensive Leaders
New Orleans had several players producing defensive statistics.
Derik Queen led the Pelicans with two steals and two blocks.
Jordan Poole recorded three steals.
Micah Peavy recorded two steals and two blocks.
Jordan Hawkins had three blocks despite scoring zero points.
For Atlanta, Mouhamed Gueye stood out with four steals and two blocks.
Nickeil Alexander-Walker had three steals and two blocks.
Dyson Daniels recorded three steals and one block.
The Hawks therefore received defensive contributions from multiple players across the rotation.
Attendance and Game Information
The matchup was played at State Farm Arena in Atlanta, Georgia.
Attendance was listed at 15,993.
The officials were James Williams, Marat Kogut, and Leon Wood.
The game ID provided for the matchup was 401810374.
The supplied data also identifies N’Faly Dante as unavailable because of illness, with additional unavailable-player information relating to a torn right ACL.
For historical game-stat articles, these details can be useful because they establish the exact event being analyzed and help distinguish the matchup from other meetings between the same teams.
What Readers Should Take Away From the Box Score
A useful way to interpret this game is to separate individual success from team success.
New Orleans had several strong individual performances.
Zion Williamson shot efficiently.
Jordan Poole provided three-point scoring.
Bryce McGowens added 20 points.
Derik Queen controlled the glass for the Pelicans.
Micah Peavy contributed across several categories.
But Atlanta’s team profile was stronger in the categories that most directly affected the final margin.
The Hawks:
- Made 10 more three-pointers
- Attempted 19 more three-pointers
- Grabbed nine more rebounds
- Collected five more offensive rebounds
- Recorded four more assists
- Made 44 field goals compared with 38
- Received double-digit scoring from seven players
Meanwhile, turnovers were identical at 19 each.
That combination explains why the Hawks won 117-100.
Why the Final 17-Point Margin Makes Sense
At first glance, a 17-point margin can look surprising because New Orleans had three players score at least 20 points.
But the team statistics provide the answer.
Atlanta’s 18 made three-pointers were worth 54 points.
New Orleans’ eight made threes were worth 24 points.
That is a 30-point difference in three-point scoring.
Atlanta also won the rebounding battle by nine and had five more offensive rebounds.
The Pelicans did enough offensively to score 100 points, but Atlanta consistently generated more efficient scoring opportunities.
The result was a large enough advantage that New Orleans’ fourth-quarter scoring could not erase the earlier deficit.
Frequently Asked Questions
Who was the leading scorer in the Pelicans vs Hawks game?
Zaccharie Risacher led all scorers with 25 points for Atlanta. Zion Williamson led New Orleans with 22 points.
What was Zion Williamson’s stat line?
Zion Williamson finished with 22 points, 8 rebounds, 6 assists, and 1 steal while shooting 10-of-15 from the field.
How many three-pointers did the Hawks make?
Atlanta made 18 three-pointers on 47 attempts, shooting 38.3% from beyond the arc.
How many rebounds did the Pelicans have?
New Orleans recorded 40 total rebounds, while Atlanta collected 49.
Who led the Hawks in assists?
Dyson Daniels led Atlanta with 8 assists. Mouhamed Gueye and Nickeil Alexander-Walker each added 6 assists.
Who led the Pelicans in rebounds?
Derik Queen led New Orleans with 10 rebounds. He also recorded 2 steals and 2 blocks.
Conclusion
The new orleans pelicans vs atlanta hawks match player stats show a game where Atlanta’s team-wide offensive structure ultimately outweighed several strong individual performances from New Orleans.
Zaccharie Risacher was the headline scorer with 25 points and seven made three-pointers. Jalen Johnson added 19 points, while Nickeil Alexander-Walker, Dyson Daniels, Kristaps Porzingis, Luke Kennard, and Mouhamed Gueye all reached double figures.
For New Orleans, Zion Williamson produced 22 points, 8 rebounds, and 6 assists while shooting 10-of-15 from the field. Jordan Poole added 21 points, including six three-pointers, and Bryce McGowens scored 20. Derik Queen’s 10 rebounds and Micah Peavy’s six assists also stood out.
The decisive numbers were Atlanta’s 18 made threes, 49 rebounds, 11 offensive rebounds, and 30 assists. New Orleans had 19 turnovers, but Atlanta also had 19, so turnovers did not determine the outcome.
The quarter-by-quarter numbers provide perhaps the clearest explanation. Atlanta scored 37 points in the first quarter and 24 in the third, while New Orleans managed only 13 points in the third. Although the Pelicans responded with 34 points in the fourth, the 23-point deficit entering the final period was too large to overcome.
For anyone studying this matchup, the biggest lesson is that individual scoring totals tell only part of the story. The complete box score shows how perimeter efficiency, rebounding, offensive balance, and quarter-by-quarter execution combined to produce Atlanta’s 117-100 victory.