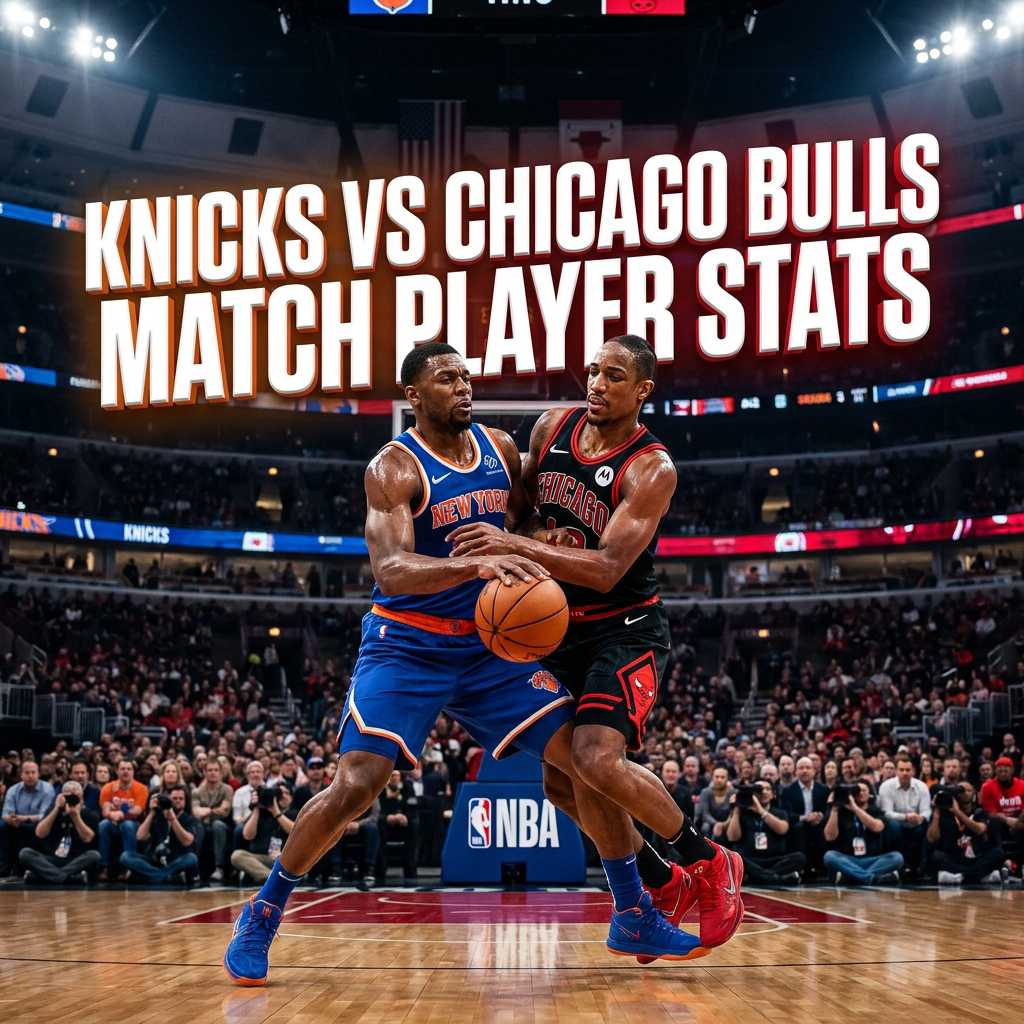
Knicks vs Chicago Bulls Match Player Stats
The knicks vs chicago bulls match player stats from November 1, 2025, tell a much richer story than the final score alone. Chicago defeated New York 135-125 at United Center in a high-scoring game where shooting efficiency, ball security, and free-throw production separated the teams. The Bulls entered the matchup unbeaten at 4-0 at home and improved to 5-0 overall, while the Knicks fell to 2-3 and remained winless on the road at 0-3.
This was not simply a case of one team scoring more points. Chicago converted its opportunities at a better rate, created more turnovers, assisted more baskets, and made 28 of 35 free throws. New York responded with 18 made three-pointers and a huge 38-point third quarter, but that offensive surge was not enough to erase Chicago’s early advantage.
The individual performances were equally important. Josh Giddey produced 32 points, 10 rebounds, and 9 assists for Chicago, while Nikola Vucevic added 26 points. For New York, Jalen Brunson led the way with 29 points and 7 assists, supported by OG Anunoby’s 26 points, Mikal Bridges’ 23 points and 6 assists, and Karl-Anthony Towns’ 22 points and 10 rebounds.
Game Overview
The November 1 matchup took place at United Center in Chicago, Illinois, in front of an announced attendance of 18,330. The game began at 5:00 AM according to the supplied game data and was listed for broadcast through CHSN, MSG, and NBA League Pass.
Chicago won 135-125, producing one of the more offensively productive games in the matchup.
Final Score
| Team | Q1 | Q2 | Q3 | Q4 | Final |
| New York Knicks | 27 | 26 | 38 | 34 | 125 |
| Chicago Bulls | 35 | 37 | 28 | 35 | 135 |
The most important feature of the scoring pattern was Chicago’s first-half dominance.
The Bulls scored 72 points before halftime, compared with 53 from New York. That created a 19-point cushion that the Knicks spent the rest of the game trying to overcome.
New York’s 38-point third quarter showed that the game was not decided by a lack of offensive ability. The problem was that Chicago had already established too much control.
Knicks vs Chicago Bulls Match Player Stats: Team Comparison
Looking beyond the scoreboard reveals why Chicago won.
| Statistical Category | Knicks | Bulls |
| Points | 125 | 135 |
| Field Goals | 45-91 | 45-84 |
| Field Goal % | 49% | 54% |
| Three-Pointers | 18-45 | 17-37 |
| Three-Point % | 40% | 46% |
| Free Throws | 17-23 | 28-35 |
| Free-Throw % | 74% | 80% |
| Rebounds | 39 | 41 |
| Assists | 27 | 31 |
| Turnovers | 12 | 7 |
| Steals | 3 | 8 |
| Blocks | 5 | 6 |
The shooting numbers immediately stand out.
Both teams made exactly 45 field goals. Chicago therefore did not win because it made more shots in total. Instead, the Bulls generated greater value from those made shots and supplemented them with superior free-throw production.
Chicago shot 54% from the field compared with New York’s 49%. The Bulls also shot 46% from three-point range, compared with 40% for the Knicks.
The free-throw difference was even more significant. Chicago made 28 free throws while New York made only 17. That is an 11-point advantage from the foul line.
Chicago also protected the ball much better. Seven turnovers compared with New York’s 12 gave the Bulls five fewer possessions that ended without a shot attempt or scoring opportunity.
How Chicago Built the Lead
The first half was the defining period of the game.
Chicago scored 35 points in the opening quarter and followed that with 37 in the second. New York scored 27 and 26 during those periods.
That produced this halftime comparison:
- Bulls: 72 points
- Knicks: 53 points
- Halftime advantage: 19 points
A 19-point halftime deficit is difficult to overcome against a team shooting 54% from the field.
New York did improve dramatically after halftime. The Knicks scored 38 points in the third quarter and another 34 in the fourth. However, Chicago continued to score efficiently enough to prevent the comeback.
The Bulls scored 28 points in the third and 35 in the fourth.
This is an important distinction when analyzing the game. New York did not collapse offensively after halftime. Instead, Chicago’s early efficiency created a margin that allowed the Bulls to absorb the Knicks’ second-half response.
Jalen Brunson’s Offensive Impact
Jalen Brunson was New York’s leading scorer with 29 points and also supplied 7 assists.
His production was especially important because the Knicks needed consistent half-court creation after falling behind early.
Brunson’s role can be understood through two basic responsibilities:
- Creating his own scoring opportunities.
- Creating shots for teammates.
His 29 points show that he handled the first responsibility effectively. His 7 assists demonstrate that he was also actively involved in creating offense for others.
However, individual production cannot always compensate for a team-level efficiency gap.
Chicago’s defense generated eight steals compared with New York’s three. That difference placed additional pressure on Brunson and the Knicks’ offense because Chicago was able to turn defensive plays into transition opportunities.
OG Anunoby Provides Secondary Scoring
OG Anunoby finished with 26 points, making him New York’s second-highest scorer.
His contribution was crucial because a heavy offensive burden cannot rest entirely on Brunson. Anunoby’s 26 points gave the Knicks another reliable scoring option and helped fuel the team’s 125-point total.
The broader lesson from the performance is that New York had enough individual scoring to remain competitive.
The issue was efficiency and game control.
When a team scores 125 points and still loses by 10, the underlying problem often lies in how those points were generated and what happened on the defensive end.
Chicago’s 54% field-goal shooting, 46% three-point shooting, eight steals, and seven turnovers provide a strong explanation.
Mikal Bridges’ All-Around Contribution
Mikal Bridges recorded 23 points and 6 assists.
His combination of scoring and playmaking was particularly useful during New York’s second-half response. The Knicks scored 72 points after halftime, and Bridges’ ability to contribute as both a scorer and facilitator helped maintain offensive flow.
A player producing 23 points while also recording six assists can influence a game without being the team’s highest scorer.
That is important when evaluating player performance through more than a single box-score category.
Karl-Anthony Towns Delivers a Double-Double
Karl-Anthony Towns finished with 22 points and 10 rebounds.
The double-double gave New York a strong interior contribution, particularly on the glass.
Towns’ 10 rebounds were part of a team rebounding effort that saw New York collect 39 boards. The Knicks were not overwhelmed on the boards, because Chicago finished with 41.
The two-rebound difference suggests that rebounding was not the primary reason for the outcome.
Instead, the decisive areas were shooting efficiency, free throws, turnovers, and defensive playmaking.
Mitchell Robinson’s Rebounding Role
Mitchell Robinson led the Knicks with 11 rebounds.
His rebounding work helped New York maintain a respectable total on the glass despite Chicago’s overall two-rebound advantage.
Robinson’s contribution is particularly relevant when assessing how the Knicks attempted to counter Chicago’s offensive efficiency. Defensive rebounds can prevent second chances, while offensive rebounds can extend possessions.
Although the supplied data does not provide an offensive-versus-defensive rebound breakdown, Robinson’s 11 total rebounds demonstrate his importance in the interior.
Josh Giddey Controls the Game for Chicago
Josh Giddey was the standout performer for the Bulls.
He finished with:
- 32 points
- 10 rebounds
- 9 assists
That stat line places him at the center of nearly every major offensive category.
Giddey led Chicago in scoring, rebounding, and assists. He also finished one assist short of a triple-double.
His 32 points were two more than the Knicks’ leading scorer, Brunson, while his 10 rebounds matched Towns’ total and his nine assists were two more than Brunson’s seven.
That combination of scoring, rebounding, and playmaking explains why Giddey’s performance had such a broad impact.
Nikola Vucevic Adds 26 Points
Nikola Vucevic scored 26 points for Chicago.
His scoring gave the Bulls another major offensive option alongside Giddey and helped prevent New York from concentrating entirely on one primary creator.
The Bulls ultimately had two players above 25 points:
- Josh Giddey: 32
- Nikola Vucevic: 26
Chicago’s offensive balance was one of the reasons the Knicks could not simply focus on stopping Giddey.
Kevin Huerter’s Playmaking Contribution
Kevin Huerter finished with 22 points and 9 assists.
The nine assists were particularly significant because they showed that Chicago’s offensive creation was not limited to Giddey.
Giddey recorded nine assists as well, meaning those two players combined for 18 assists.
Chicago finished with 31 total assists, compared with 27 for New York.
That four-assist advantage may look modest, but it fits into a larger pattern. The Bulls also shot a higher percentage from the field and committed five fewer turnovers.
Efficient passing combined with accurate shooting is much more valuable than raw assist totals alone.
Jalen Smith’s Interior Contribution
Jalen Smith added 10 points and 9 rebounds for Chicago.
Although he did not match the scoring totals of Giddey or Vucevic, his rebounding helped Chicago maintain a two-board team advantage over New York.
Smith’s nine rebounds were only one fewer than Giddey’s team-leading 10.
That kind of supporting production matters in high-scoring games because every additional possession can become valuable when both teams are operating at an offensive pace.
Why the Three-Point Numbers Matter
New York made 18 three-pointers from 45 attempts.
Chicago made 17 from 37 attempts.
At first glance, the Knicks actually made one more three-pointer.
Yet Chicago still won comfortably.
The reason is efficiency.
New York’s three-point percentage was 40%, while Chicago’s was 46%.
The Bulls therefore generated more value from fewer attempts.
This is a useful lesson when analyzing shooting statistics. The number of made threes tells only part of the story. Attempts and conversion rate need to be considered together.
New York’s 18 made threes were impressive, but Chicago’s 17 made threes came at a higher efficiency.
Free Throws Created a Major Difference
The free-throw numbers were arguably one of the clearest statistical explanations for the final score.
New York:
- 17 made
- 23 attempts
- 74%
Chicago:
- 28 made
- 35 attempts
- 80%
Chicago attempted 12 more free throws and made 11 more.
That means the Bulls gained an 11-point advantage from made free throws alone.
Considering Chicago won by exactly 10 points, the difference is striking.
This does not mean the game was decided exclusively at the foul line. Basketball outcomes are multi-factor results. However, the free-throw disparity clearly had a major influence on the final margin.
Ball Security Favored Chicago
Turnovers were another important separator.
New York committed 12 turnovers.
Chicago committed only 7.
That is a five-turnover advantage for the Bulls.
Chicago also recorded eight steals, compared with three for New York.
Those statistics point toward a meaningful difference in possession control.
In a high-scoring contest, wasted possessions become especially costly. When both teams can score efficiently, giving away extra opportunities can quickly create a gap.
Chicago’s ability to protect the ball while forcing turnovers gave the Bulls an additional edge.
Rebounding Was Surprisingly Close
Despite the difference in the final score, rebounding was not dramatically uneven.
Chicago collected 41 rebounds.
New York collected 39.
That is only a two-rebound difference.
This is important because it eliminates rebounding as the primary explanation for the outcome.
The Knicks had strong individual rebounding performances from Mitchell Robinson and Karl-Anthony Towns. Chicago responded with Giddey and Smith contributing heavily on the boards.
The teams were relatively close in this category.
The larger differences appeared in shooting efficiency, free throws, turnovers, and steals.
The Third Quarter Changed the Momentum
New York’s 38-point third quarter was the strongest offensive quarter of the game for either team.
The Knicks outscored Chicago 38-28 during the period.
That reduced some of the damage created in the first half.
However, Chicago’s 35-point fourth quarter prevented New York from completing the comeback.
The Bulls did not need to dominate every quarter. Their first-half advantage gave them enough room to withstand New York’s best offensive stretch.
This is one of the most useful ways to understand the game.
The final score was not produced by four equal quarters. It was shaped by Chicago’s explosive opening half and New York’s aggressive second-half response.
Knicks vs Chicago Bulls Match Player Stats and the Season Series
The supplied season-series data shows four meetings between the teams.
| Game | Result |
| Game 1 | Bulls 135, Knicks 125 |
| Game 2 | Bulls 128, Knicks 116 |
| Game 3 | Knicks 105, Bulls 99 |
| Game 4 | Bulls 136, Knicks 96 |
Chicago led the season series 1-0 at the time of the November 1 game.
The later results show that the matchup developed into a competitive but uneven series.
Chicago won Games 1, 2, and 4, while New York won Game 3.
The margins also varied considerably.
The November 1 meeting was decided by 10 points. The second meeting was a 12-point Chicago win. New York’s victory came by six points, while Chicago’s final listed win was a 40-point blowout.
That range demonstrates why a single game should not be treated as a complete representation of the teams.
Knicks Starting Lineup
The supplied starting lineup for New York was:
- OG Anunoby
- Karl-Anthony Towns
- Mitchell Robinson
- Mikal Bridges
- Jalen Brunson
This group combined perimeter scoring, interior size, rebounding, and playmaking.
Brunson served as the primary offensive creator, while Bridges and Anunoby supplied secondary scoring. Towns provided scoring and rebounding from the frontcourt, and Robinson added interior rebounding.
The lineup therefore had several ways to generate offense.
The challenge against Chicago was not a shortage of scoring options. Instead, the Knicks struggled to match Chicago’s efficiency and first-half production.
Bulls Starting Lineup
Chicago’s listed starters were:
- Isaac Okoro
- Matas Buzelis
- Nikola Vucevic
- Tre Jones
- Josh Giddey
This group produced a balanced offensive result.
Giddey was the central statistical performer, while Vucevic provided 26 points. Chicago’s overall 54% shooting indicates that the starting unit and supporting players collectively converted at a high level.
The Bulls also benefited from their ability to create defensive events, finishing with eight steals and six blocks.
Bench Depth
New York’s listed bench included Guerschon Yabusele, Jordan Clarkson, Josh Hart, Landry Shamet, Miles McBride, Tyler Kolek, Pacome Dadiet, Mohamed Diawara, and Ariel Hukporti.
Chicago’s listed bench included Jalen Smith, Patrick Williams, Julian Phillips, Kevin Huerter, Ayo Dosunmu, Noa Essengue, Jevon Carter, and Dalen Terry.
The available player list shows that both teams had multiple rotation options.
However, the supplied statistical data does not provide complete individual minutes, plus-minus figures, shooting splits, or bench scoring totals. Those figures should not be invented simply to make the analysis appear more detailed.
That distinction matters for trustworthy sports reporting.
What the Numbers Say About New York
New York’s biggest positive was offensive resilience.
The Knicks scored 125 points and produced 18 made three-pointers. They also scored 38 points in the third quarter and 34 in the fourth.
Several players contributed significantly:
- Brunson: 29 points, 7 assists
- Anunoby: 26 points
- Bridges: 23 points, 6 assists
- Towns: 22 points, 10 rebounds
- Robinson: 11 rebounds
That is a strong collection of individual performances.
The main weakness was efficiency relative to Chicago.
New York shot 49% overall and 40% from three. Those are respectable numbers, but Chicago was better in both categories.
The Knicks also surrendered advantages in free throws and turnovers.
What the Numbers Say About Chicago
Chicago’s biggest strength was efficiency combined with possession control.
The Bulls shot 54% from the field and 46% from three.
They made 28 free throws, committed only seven turnovers, recorded eight steals, and finished with 31 assists.
Giddey was the central figure, but the victory was not dependent on him alone.
Vucevic scored 26.
Huerter scored 22 and added nine assists.
Smith contributed 10 points and nine rebounds.
The overall profile was therefore balanced. Chicago combined star-level production with efficient supporting contributions.
A Practical Way to Read a Box Score
Readers often focus on the leading scorer first.
That is understandable, but it can produce an incomplete interpretation.
A better process is to examine five areas:
1. Scoring efficiency
Compare field-goal and three-point percentages rather than only total points.
2. Possession control
Look at turnovers and steals to understand which team protected the ball and created extra possessions.
3. Free throws
Free-throw attempts can reveal how often a team reached the line and converted pressure into points.
4. Rebounding
Check whether one team generated a meaningful possession advantage on the glass.
5. Playmaking
Assists help show whether scoring came through individual creation or coordinated offense.
Using this method, Chicago’s advantage becomes much clearer.
Key Statistical Takeaways
The most important numbers from the matchup were:
135-125: Chicago’s final margin of victory.
72-53: Chicago’s first-half scoring advantage.
54%-49%: Bulls’ edge in field-goal percentage.
46%-40%: Bulls’ advantage from three-point range.
28-17: Chicago’s advantage in made free throws.
7-12: Chicago’s advantage in turnovers.
31-27: Chicago’s assist advantage.
41-39: Chicago’s narrow rebounding advantage.
32-10-9: Josh Giddey’s points, rebounds, and assists.
29-7: Jalen Brunson’s points and assists.
These numbers provide a more complete explanation than the final score by itself.
Where to Verify Official Game Information
For readers who want to cross-check official schedules, box scores, and league information, the NBA official website is the most relevant primary source.
When publishing this article, the official league record should be treated as the preferred reference for any future correction involving game times, player availability, official statistics, or subsequent record changes.
Internal Linking Opportunities
A sports statistics website can strengthen this article with useful internal links rather than adding unrelated links.
Good internal-link destinations could include:
- A page covering the latest New York Knicks player statistics
- A Chicago Bulls team statistics page
- A Knicks season schedule and results article
- A Bulls season schedule and results article
- A broader NBA player statistics guide
- A previous Knicks versus Bulls game analysis
Each internal link should use descriptive anchor text that tells the reader exactly what they will find.
Suggested Original Data Presentation
For a published version, the strongest visual addition would be a simple custom table or chart built from the supplied numbers.
One useful chart could compare:
- Field-goal percentage
- Three-point percentage
- Free-throw percentage
- Rebounds
- Assists
- Turnovers
Another could display scoring by quarter.
These visuals would make the 19-point halftime difference immediately understandable without forcing readers to interpret several paragraphs of numbers.
If screenshots or graphics are used, they should be original or properly licensed rather than copied from another sports website.
Why This Game Matters for Statistical Analysis
The matchup provides a good example of why raw scoring totals can be misleading.
The Knicks scored 125 points, which would normally represent an excellent offensive output. Yet Chicago scored 135 because the Bulls converted their possessions more efficiently and created additional opportunities.
New York also made more three-pointers, but Chicago still won comfortably.
That tells us something important about modern basketball analysis: a team can win while making fewer three-pointers if it compensates through shooting efficiency, free throws, turnover control, and overall shot quality.
Chicago did exactly that in this matchup.
Frequently Asked Questions
Who led the Knicks in scoring against the Bulls?
Jalen Brunson led New York with 29 points. He also recorded 7 assists.
Who led the Bulls in scoring?
Josh Giddey led Chicago with 32 points. He also recorded 10 rebounds and 9 assists.
What was the final score?
The Chicago Bulls defeated the New York Knicks 135-125 on November 1, 2025, at United Center.
Which team shot better from three-point range?
Chicago shot 46% from three-point range, while New York shot 40%.
Who led the Knicks in rebounds?
Mitchell Robinson led New York with 11 rebounds. Karl-Anthony Towns also recorded a double-double with 22 points and 10 rebounds.
Why did Chicago win?
Chicago combined 54% field-goal shooting, 46% three-point shooting, 28 made free throws, seven turnovers, 31 assists, and eight steals. The Bulls also built a 19-point halftime advantage.
Conclusion
The November 1, 2025 matchup between New York and Chicago was a strong example of how several small statistical advantages can combine into a decisive result.
Chicago’s 135-125 victory was built primarily on its first-half scoring, superior shooting efficiency, free-throw advantage, and better ball security. The Bulls shot 54% from the field and 46% from three-point range while committing only seven turnovers.
Josh Giddey was the standout individual performer with 32 points, 10 rebounds, and 9 assists. Nikola Vucevic added 26 points, while Kevin Huerter contributed 22 points and 9 assists.
New York had plenty of offensive production of its own. Jalen Brunson scored 29 points and had 7 assists, OG Anunoby scored 26, Mikal Bridges added 23 points and 6 assists, and Karl-Anthony Towns posted 22 points and 10 rebounds. Mitchell Robinson led the Knicks with 11 rebounds.
The most revealing comparison is that both teams made 45 field goals, yet Chicago won by 10. That happened because the Bulls were more efficient, converted 11 more free throws, committed five fewer turnovers, and produced more assists and defensive plays.
For anyone studying knicks vs chicago bulls match player stats, the main lesson is that the box score needs to be read as a connected system. Individual scoring matters, but shooting efficiency, possession quality, free throws, rebounding, playmaking, and defensive activity often explain the final result more effectively than points alone.