Orlando Magic vs Knicks Match Player Stats
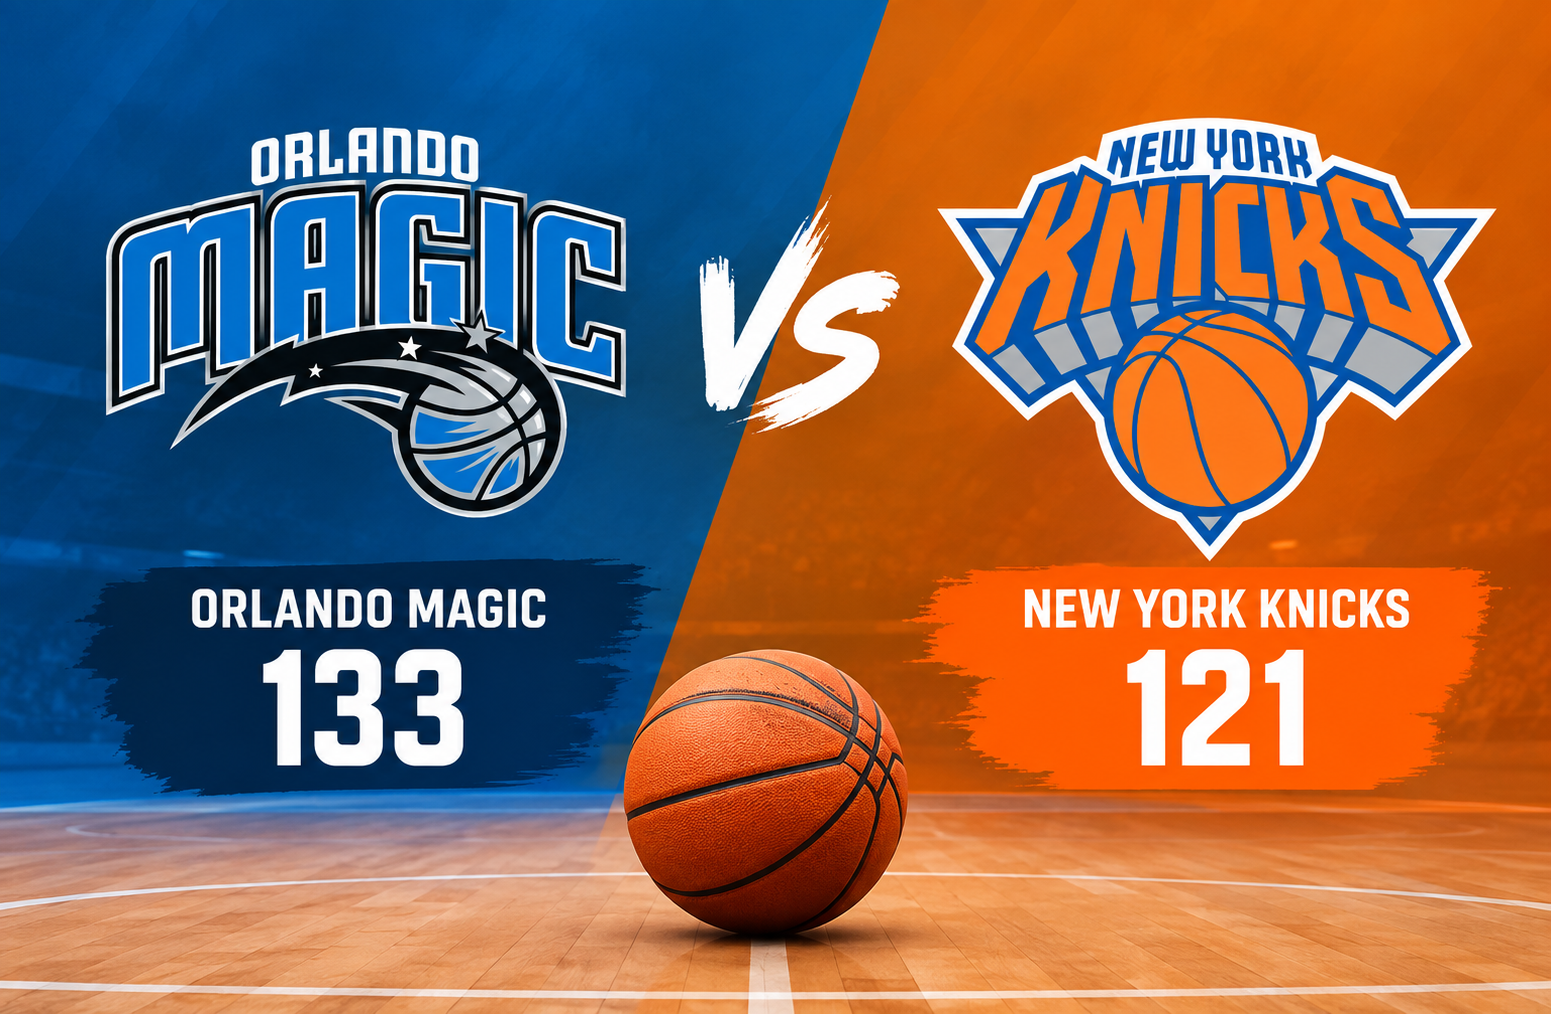
The orlando magic vs knicks match player stats from November 23, 2025, provide a detailed picture of how Orlando defeated New York 133-121 at Kia Center in Orlando. The Magic did not simply win because of one scoring burst. They built their advantage quarter by quarter, shooting 55% from the field, getting strong production from Franz Wagner, Desmond Bane, and Jalen Suggs, and limiting their turnovers compared with the Knicks.
The final score was Orlando Magic 133, New York Knicks 121, in front of 18,014 fans. Orlando entered the game with a 10-7 record and a 7-3 home record, while New York was 9-6 overall and 1-5 on the road. The result moved Orlando to a 2-0 advantage in the season series after this meeting.
For readers studying the box score, the most important story is not simply that Orlando scored 133 points. The Magic scored at least 31 points in every quarter, increasing their production from 31 in the first to 35 in the fourth. New York also shot efficiently at 54%, but its 17 turnovers and lower free throw conversion volume left the Knicks unable to keep pace.
Orlando Magic vs Knicks Match Player Stats: Game Overview
The game was played on November 23, 2025, at Kia Center in Orlando, Florida. Orlando finished with a 133-121 victory.
| Game Detail | Orlando Magic | New York Knicks |
| Final Score | 133 | 121 |
| Record Entering Game | 10-7 | 9-6 |
| Home/Away Record | 7-3 Home | 1-5 Away |
| Field Goals | 47-85 | 43-79 |
| Field Goal Percentage | 55% | 54% |
| Three-Pointers | 13-33 | 13-37 |
| Three-Point Percentage | 39% | 35% |
| Free Throws | 26-30 | 22-28 |
| Free Throw Percentage | 87% | 79% |
| Rebounds | 36 | 36 |
| Assists | 28 | 28 |
| Turnovers | 13 | 17 |
| Steals | 5 | 5 |
| Blocks | 2 | 4 |
| Offensive Rebounds | 11 | 9 |
| Defensive Rebounds | 25 | 27 |
| Personal Fouls | 26 | 28 |
The numbers show how close several statistical categories were. Both teams had 36 total rebounds and 28 assists. Both recorded five steals. The biggest team-level difference was ball security.
Orlando committed 13 turnovers compared with 17 for New York. That four-turnover difference is meaningful in a game that ended with a 12-point margin.
The Magic also made 26 of 30 free throw attempts, while the Knicks converted 22 of 28. Orlando therefore had both a higher free throw percentage and more made free throws.
How Orlando Built the 133-Point Performance
One of the clearest features of the game was Orlando’s consistency.
The Magic scored:
- 31 points in the first quarter
- 33 points in the second quarter
- 34 points in the third quarter
- 35 points in the fourth quarter
This means Orlando never had a quarter below 31 points. Instead of relying on a single explosive period, the Magic steadily increased their scoring.
New York’s quarter totals were:
- 29 points in the first quarter
- 37 points in the second quarter
- 27 points in the third quarter
- 28 points in the fourth quarter
The Knicks actually outscored Orlando 37-33 in the second quarter. That was not enough to change the overall direction of the game because Orlando responded with 34 points in the third quarter and 35 in the fourth.
This quarter-by-quarter pattern is important when evaluating the box score. A team can lose a game despite having a high-scoring quarter if its production becomes less consistent afterward. New York’s 27-point third quarter was particularly important because Orlando continued scoring at a high level.
Franz Wagner Leads Orlando
Franz Wagner was the leading scorer for Orlando with 37 points. His overall shooting line was one of the strongest individual performances in the game.
Wagner finished with:
- 37 points
- 6 rebounds
- 7 assists
- 13-of-19 field goals
- 4-of-6 three-pointers
- 7-of-7 free throws
His 13 made field goals came on only 19 attempts, giving him an excellent shooting night. He also converted all seven free throw attempts.
Wagner’s contribution was not limited to scoring. Seven assists show that he was also involved in creating opportunities for teammates. That combination of scoring and playmaking made his performance one of the central reasons Orlando was able to maintain its offensive output.
His three-point shooting was also efficient. Wagner made four of six attempts from outside the arc, adding 12 points from three-point range alone.
The most notable feature of his performance was efficiency. He reached 37 points without needing a large number of field goal attempts.
Desmond Bane Provides Efficient Scoring
Desmond Bane added 27 points for Orlando, giving the Magic another major scoring option alongside Wagner.
His line included:
- 27 points
- 3 rebounds
- 5 assists
- 8-of-16 field goals
- 3-of-7 three-pointers
- 8-of-8 free throws
- 1 steal
Bane’s free throw performance was perfect. He converted all eight attempts.
His three-point shooting also contributed directly to Orlando’s spacing. Three made three-pointers gave the Magic an important perimeter scoring source, while his five assists show that his role extended beyond simply taking shots.
When combined, Wagner and Bane accounted for 64 of Orlando’s 133 points. That is nearly half of the team’s total scoring.
Jalen Suggs Adds 26 Points
Jalen Suggs scored 26 points for Orlando, giving the Magic three players with at least 26 points.
Suggs finished with:
- 26 points
- 3 rebounds
- 1 assist
- 8-of-15 field goals
- 2-of-6 three-pointers
- 8-of-9 free throws
His 8-of-9 performance at the free throw line was another important source of efficient scoring.
The combined output from Wagner, Bane, and Suggs was 90 points. That means those three players produced more than two-thirds of Orlando’s 133 points.
This is one of the most important takeaways from the player statistics. Orlando did not need one player to carry the entire offense. It received major scoring contributions from three different players.
Other Orlando Contributors
The supporting cast also helped Orlando maintain balance.
Wendell Carter Jr.
Wendell Carter Jr. scored 11 points and was perfect from the field.
His line was:
- 11 points
- 4 rebounds
- 1 assist
- 4-of-4 field goals
- 2-of-2 three-pointers
A perfect 4-of-4 shooting performance gave Orlando additional efficiency from the frontcourt.
Anthony Black
Anthony Black contributed:
- 11 points
- 1 rebound
- 4 assists
- 3 steals
- 1 block
His defensive numbers stand out. Three steals and one block gave him four recorded defensive plays of those types.
Jonathan Isaac
Jonathan Isaac finished with:
- 6 points
- 7 rebounds
- 0 assists
His seven rebounds tied him for Orlando’s team lead in that category.
Goga Bitadze
Goga Bitadze also recorded seven rebounds.
His final line was:
- 6 points
- 7 rebounds
- 3 assists
- 1 steal
- 1 block
Bitadze’s three assists from the center position added another element to Orlando’s team offense.
Tristan da Silva
Tristan da Silva finished with four points, three rebounds, and four assists.
Although his scoring contribution was limited, the four assists were notable relative to his four points.
Jett Howard
Jett Howard scored five points.
Tyus Jones
Tyus Jones recorded three assists and one rebound.
Noah Penda and Jase Richardson
Noah Penda finished with one rebound, while Jase Richardson recorded zero points in the supplied box score.
Jalen Brunson Leads New York
Jalen Brunson was the Knicks’ leading scorer with 33 points and also led the team in assists with 11.
His statistical line was:
- 33 points
- 3 rebounds
- 11 assists
- 12-of-21 field goals
- 3-of-9 three-pointers
- 6-of-6 free throws
Brunson’s 33 points represented more than a quarter of New York’s total scoring.
His 11 assists were also significant. He was directly involved in creating a large portion of the Knicks’ offense, combining scoring responsibility with primary playmaking duties.
Brunson shot 12-of-21 from the field, which translated to approximately 57% shooting on his field goal attempts. He was also perfect from the free throw line.
The challenge for New York was that Brunson’s strong individual performance did not translate into enough overall offensive production to match Orlando’s balanced attack.
Karl-Anthony Towns Provides Inside Production
Karl-Anthony Towns scored 24 points and led New York in rebounds with eight.
His line included:
- 24 points
- 8 rebounds
- 3 assists
- 6-of-14 field goals
- 2-of-6 three-pointers
- 10-of-11 free throws
Towns was especially effective at the free throw line. His 10 made free throws were nearly half of his total scoring.
His eight rebounds also made him New York’s leading rebounder in the supplied statistics.
Together, Brunson and Towns scored 57 points, accounting for almost half of New York’s 121 points.
Mikal Bridges Adds Perimeter Efficiency
Mikal Bridges finished with 18 points, seven rebounds, and two assists.
He shot:
- 7-of-11 from the field
- 3-of-5 from three-point range
Bridges also recorded two steals.
His 3-of-5 three-point shooting was particularly efficient. Among New York’s key perimeter players, Bridges provided a strong shooting contribution while also adding seven rebounds.
Jordan Clarkson’s Bench Scoring
Jordan Clarkson scored 15 points for New York.
His line was:
- 15 points
- 2 rebounds
- 5 assists
- 6-of-10 field goals
- 3-of-5 three-pointers
- 1 block
Clarkson’s 60% field goal shooting and 60% three-point shooting gave the Knicks useful scoring efficiency.
His five assists also helped supplement Brunson’s playmaking.
Other Knicks Contributions
The remaining Knicks players added a mixture of scoring, rebounding, passing, and defensive production.
Josh Hart recorded 12 points, five rebounds, and two assists.
Tyler Kolek scored eight points, added one rebound and one assist, and recorded two steals.
Guerschon Yabusele scored four points and had one rebound.
Ariel Hukporti recorded one point and two rebounds.
Mohamed Diawara had four rebounds, two assists, and one steal without scoring.
Mitchell Robinson scored six points, collected three rebounds, and recorded two blocks. He shot 3-of-3 from the field.
Landry Shamet finished with two assists but did not score.
Pacome Dadiet recorded zero points, rebounds, or assists in the supplied statistics.
Team Shooting Comparison
The shooting numbers reveal a very close contest in basic field goal efficiency.
Orlando shot 47-of-85 from the field, or 55%.
New York shot 43-of-79, or 54%.
The one-percentage-point difference might appear small, but Orlando attempted six more field goals and made four more shots.
That produced:
- Orlando: 47 made field goals
- New York: 43 made field goals
The three-point numbers were also separated by efficiency rather than made shots.
Both teams made 13 three-pointers.
However:
- Orlando attempted 33 three-pointers
- New York attempted 37 three-pointers
Orlando therefore made the same number of threes on four fewer attempts.
The Magic shot 39% from three-point range, compared with 35% for New York.
That difference matters because the teams had identical three-point makes. Orlando generated the same perimeter scoring with fewer attempts.
Free Throw Efficiency Was Another Difference
Orlando made 26 of 30 free throws.
New York made 22 of 28.
That means Orlando scored four more points at the free throw line.
The percentages were also different:
- Orlando: 87%
- New York: 79%
The Magic’s 26 made free throws represented a significant part of their 133-point total.
Wagner went 7-of-7, Bane went 8-of-8, and Suggs went 8-of-9. Those three players alone combined for 23 made free throws.
For New York, Towns went 10-of-11 and Brunson went 6-of-6. Those two players accounted for 16 made free throws.
Turnovers Help Explain the Margin
The turnover category deserves special attention.
Orlando committed 13 turnovers.
New York committed 17.
Both teams had the same number of assists at 28, which makes the turnover difference even more interesting.
The Knicks had four more turnovers despite matching Orlando’s assist total.
This suggests that Orlando’s ball security helped it convert a similar level of playmaking into more usable possessions.
A four-turnover gap does not automatically explain a 12-point victory by itself, but it is an important component of the statistical story.
Rebounding Was Surprisingly Even
Both teams finished with 36 rebounds.
This means the game was not decided by an overwhelming rebounding advantage.
The distribution was slightly different.
Orlando had:
- 11 offensive rebounds
- 25 defensive rebounds
New York had:
- 9 offensive rebounds
- 27 defensive rebounds
The Knicks collected two more defensive rebounds, while Orlando collected two more offensive rebounds.
The total rebounding numbers were identical.
That makes the offensive rebounding difference more relevant. Orlando generated 11 second-chance opportunities through offensive rebounds compared with nine for New York.
It was not a massive difference, but it favored the team that ultimately won.
Assists Were Identical
Both teams recorded 28 assists.
That is another reason this box score is interesting.
Orlando did not win because it dramatically out-assisted New York. The two teams generated the same number of assists.
Instead, the difference came from what happened around those assists.
Orlando shot slightly better overall, shot better from three, converted more free throws, and committed fewer turnovers.
The result was a more efficient offensive profile despite identical assist totals.
Defensive Statistics
The Knicks recorded four blocks compared with two for Orlando.
Mitchell Robinson contributed two of New York’s blocks.
Orlando recorded five steals, while New York also recorded five.
Anthony Black led the Magic with three steals.
New York’s four blocks demonstrate that its interior defense did produce resistance at the rim. However, the defensive activity did not prevent Orlando from scoring 133 points.
This is an important distinction when reading defensive statistics. Blocks and steals are valuable individual statistics, but they do not always translate directly into lower team scoring if the opponent remains highly efficient.
Why the 133-121 Score Matters
The final margin was 12 points.
Orlando scored 133 points, while New York scored 121.
A 121-point performance would normally indicate a productive offensive game. The issue for the Knicks was that Orlando’s offense was even more effective.
The Magic’s 55% field goal shooting, 39% three-point shooting, and 87% free throw shooting created an efficient scoring profile.
New York also shot well at 54% from the field, but the Knicks were less efficient from three and the free throw line.
The 17 turnovers added another disadvantage.
This is why the final score should not be interpreted simply as a shooting mismatch. Both offenses were productive. Orlando won the statistical battle through a combination of efficiency, possession management, and sustained scoring.
Player Efficiency Beyond the Scoring Leaders
Looking beyond the top scorers provides additional insight.
Franz Wagner’s 37 points on 13-of-19 shooting is one of the clearest examples of efficient high-volume scoring in the game.
Wendell Carter Jr. was perfect from the field at 4-of-4.
Mikal Bridges shot 7-of-11 while making three of five from outside.
Jordan Clarkson shot 6-of-10 and 3-of-5 from three.
Mitchell Robinson also went 3-of-3 from the field.
These performances show that efficiency was not limited to one player.
At the same time, the game included players with lower scoring totals who contributed through assists, rebounds, steals, or defensive plays. Box score analysis becomes more useful when these contributions are considered alongside points.
A Closer Look at Orlando’s Scoring Distribution
Orlando’s leading three scorers combined for:
- Franz Wagner: 37
- Desmond Bane: 27
- Jalen Suggs: 26
Total: 90 points.
That leaves 43 points for the rest of the team.
Wendell Carter Jr. added 11 and Anthony Black added 11, giving Orlando 22 additional points from those two players alone.
This distribution demonstrates that Orlando had multiple reliable scoring options.
If one player was closely defended, the Magic could still receive major production from other offensive players.
A Closer Look at New York’s Scoring Distribution
New York’s top three scorers were:
- Jalen Brunson: 33
- Karl-Anthony Towns: 24
- Mikal Bridges: 18
Together they scored 75 points.
Jordan Clarkson added 15, and Josh Hart added 12.
That means five Knicks players accounted for 102 of the team’s 121 points.
The Knicks therefore also had several productive players, but Orlando’s top three produced 90 points compared with 75 from New York’s top three.
That 15-point difference among the three leading scorers is larger than the final 12-point margin.
What the Box Score Says About the Game
The statistical evidence points to several clear themes.
1. Orlando Maintained Offensive Pressure
The Magic scored at least 31 points in every quarter.
That consistency prevented New York from turning its strong second quarter into a sustained advantage.
2. Orlando Had Three Major Scoring Options
Wagner, Bane, and Suggs combined for 90 points.
This made Orlando’s offense difficult to reduce to a single scoring source.
3. Brunson Had a Major Individual Game
Brunson finished with 33 points and 11 assists while shooting 12-of-21.
His performance was one of the strongest individual statistical efforts for New York.
4. Towns Was Productive Inside and at the Line
Towns scored 24 points and grabbed eight rebounds while shooting 10-of-11 from the free throw line.
5. Ball Security Favored Orlando
The Magic committed 13 turnovers compared with 17 for the Knicks.
6. The Teams Were Even on Rebounds and Assists
Both teams had 36 rebounds and 28 assists.
That makes the efficiency and turnover differences more important when explaining the result.
Season Series Context
The supplied game data shows that Orlando led the season series 2-0 after this game.
That detail adds context beyond the single box score.
The Magic’s victory came despite New York scoring 37 points in the second quarter. Orlando’s ability to answer with 34 in the third and 35 in the fourth kept the game under control.
The season-series figure should be treated separately from the individual game statistics because it describes the broader matchup rather than this single performance.
What Readers Should Look For in Similar Box Scores
A useful way to analyze an NBA game is to avoid focusing only on the highest scorer.
Instead, examine several categories together:
- Field goal efficiency
- Three-point efficiency
- Free throw production
- Turnovers
- Offensive rebounds
- Assist totals
- Scoring distribution
- Individual shot volume
- Defensive events
- Quarter-by-quarter scoring
This approach can reveal why a game ended the way it did.
For this matchup, the basic framework immediately shows that rebounds and assists were even. The more meaningful differences were shooting efficiency, free throws, turnovers, and scoring concentration among the leading Orlando players.
Frequently Asked Questions
Who led the Orlando Magic in scoring against the Knicks?
Franz Wagner led Orlando with 37 points. He also recorded six rebounds and seven assists while shooting 13-of-19 from the field.
Who was the Knicks’ leading scorer?
Jalen Brunson led New York with 33 points. He also recorded 11 assists and shot 12-of-21 from the field.
What was the final score between Orlando and New York?
The Orlando Magic defeated the New York Knicks 133-121 on November 23, 2025, at Kia Center.
Which team shot better from three-point range?
Orlando shot 39% from three-point range, making 13 of 33 attempts. New York made the same 13 three-pointers but shot 35% on 37 attempts.
Who led the Knicks in rebounds?
Karl-Anthony Towns led New York with eight rebounds.
How many turnovers did each team have?
Orlando committed 13 turnovers, while New York committed 17 turnovers.
Conclusion
The orlando magic vs knicks match player stats show a game in which both teams produced strong offensive numbers, but Orlando maintained greater consistency and efficiency across four quarters.
Franz Wagner’s 37 points, seven assists, and efficient 13-of-19 shooting led the Magic. Desmond Bane added 27 points, while Jalen Suggs scored 26. Together, those three players supplied 90 points, giving Orlando a balanced scoring foundation.
New York had its own major performances. Jalen Brunson scored 33 points and delivered 11 assists, while Karl-Anthony Towns added 24 points and eight rebounds. Mikal Bridges contributed 18 points and seven rebounds, and Jordan Clarkson provided 15 points and five assists.
The team numbers explain the final margin more clearly. Both sides had 36 rebounds and 28 assists, and both made 13 three-pointers. Orlando separated itself through slightly better field goal efficiency, stronger three-point accuracy, better free throw conversion, fewer turnovers, and 11 offensive rebounds.
The quarter totals tell another important part of the story. Orlando scored 31, 33, 34, and 35 points across the four quarters. New York scored 29, 37, 27, and 28. The Knicks had a strong second quarter, but Orlando responded with consistent scoring after halftime.
For anyone analyzing this matchup, the most useful lesson is that the box score should be read as a collection of connected numbers rather than a list of individual achievements. Orlando’s 133 points came from efficient shooting, multiple high-level scoring performances, reliable free throw shooting, and better ball security. New York’s 121 points demonstrate that its offense was productive, but the Magic were able to generate even more from their possessions.