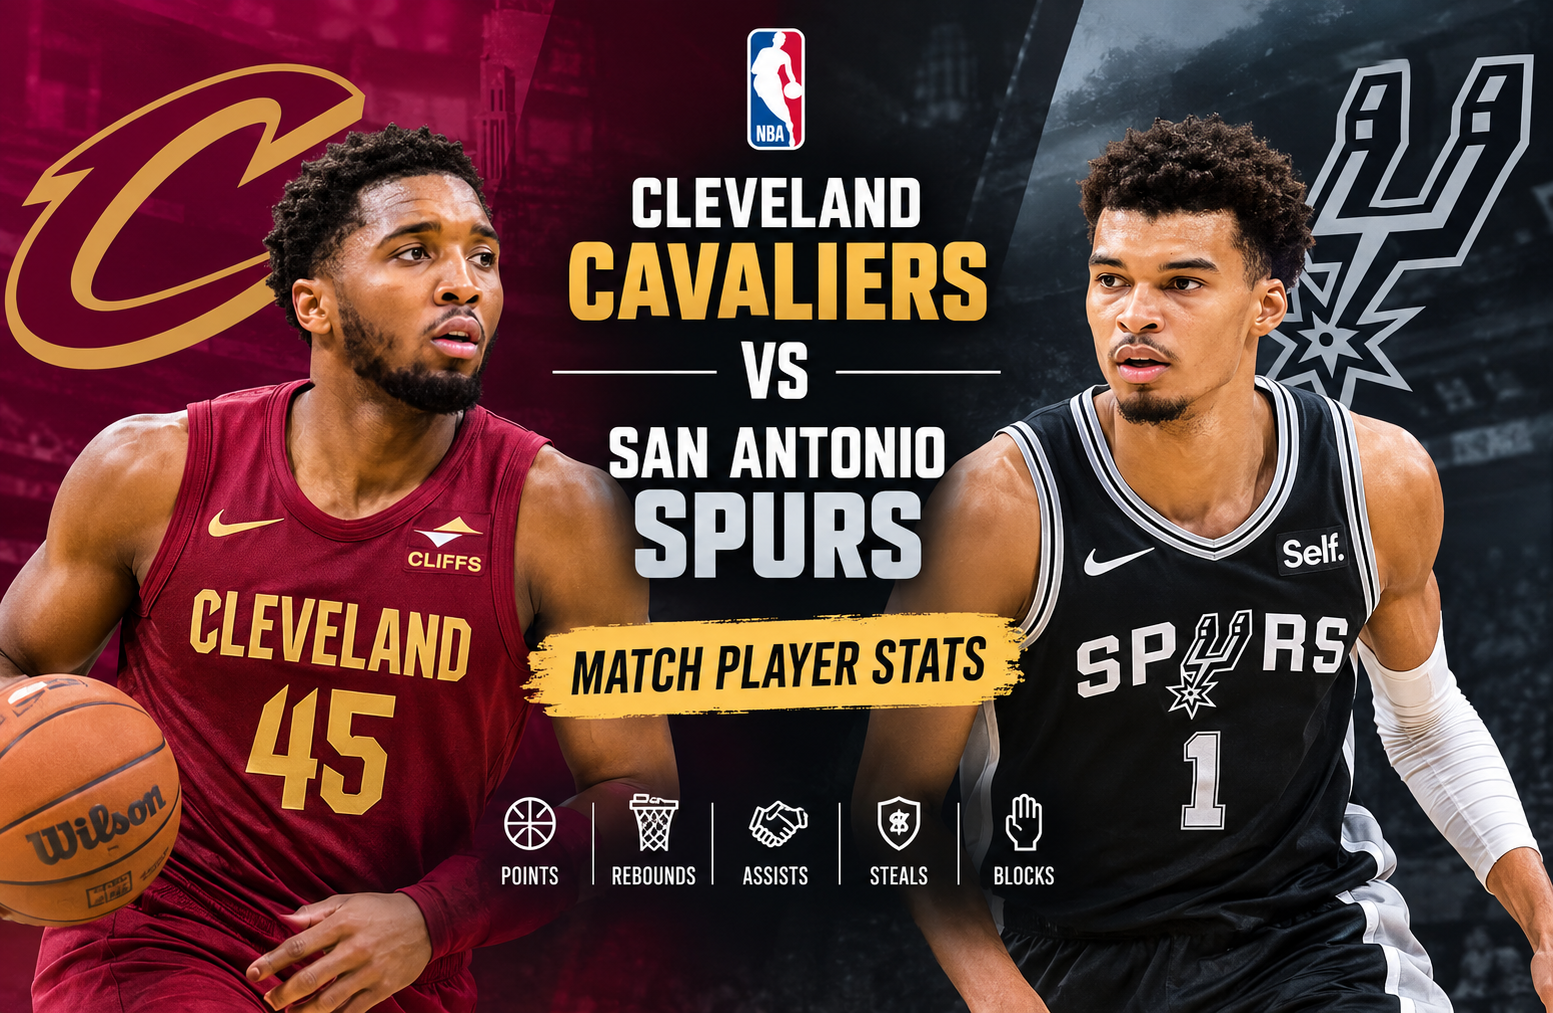
Cleveland Cavaliers vs San Antonio Spurs Match Player Stats
The cleveland cavaliers vs san antonio spurs match player stats from their December 30, 2025 meeting tell a much more detailed story than the final score alone. Cleveland defeated San Antonio 113-101 at Frost Bank Center, overcoming an early deficit and controlling the fourth quarter with a 37-point closing period. Jarrett Allen led the Cavaliers with 27 points and 10 rebounds, while Victor Wembanyama produced 26 points and 14 rebounds for the Spurs. (ESPN)
This game is particularly useful for anyone studying player production because the two teams reached their scoring totals in very different ways. Cleveland shot 43% from the field and 31% from three-point range, while San Antonio shot 39% overall and only 23% from deep. The Spurs actually collected more rebounds, 52 to 47, but Cleveland created advantages through ball movement, shooting efficiency at the free-throw line, defensive activity, and a much cleaner fourth quarter.
For consistency, this article uses December 30, 2025 as the game date supplied in the match record. ESPN’s U.S. listing displays the game under December 29 because the contest was played in San Antonio local time. The underlying score and player statistics match the supplied data. (ESPN Africa)
Cleveland Cavaliers vs San Antonio Spurs Match Player Stats: Game Summary
The Cavaliers finished the game with a 113-101 victory after trailing 55-49 at halftime. Cleveland’s scoring by quarter was 25, 24, 27, and 37 points. San Antonio scored 26, 29, 23, and 23.
That fourth-quarter difference was decisive.
| Category | Cleveland Cavaliers | San Antonio Spurs |
| Final Score | 113 | 101 |
| Field Goals | 41-96 | 32-83 |
| Field Goal % | 43% | 39% |
| 3-Pointers | 13-42 | 7-31 |
| 3PT % | 31% | 23% |
| Free Throws | 18-20 | 30-36 |
| FT % | 90% | 83% |
| Rebounds | 47 | 52 |
| Assists | 29 | 21 |
| Turnovers | 12 | 18 |
| Steals | 12 | 7 |
| Blocks | 4 | 2 |
The statistical profile immediately explains why the result was not simply about rebounding or free throws.
San Antonio attempted 36 free throws compared with Cleveland’s 20, giving the Spurs a substantial advantage at the foul line. However, Cleveland made up for that difference by converting 41 field goals to San Antonio’s 32 and making six more three-pointers.
Cleveland also committed six fewer turnovers. That matters because turnovers do more than appear in a box score. They can remove scoring opportunities from one team while creating transition opportunities for the opponent.
Quarter-by-Quarter Breakdown
The game developed in three distinct stages.
First Quarter: Spurs Establish a Narrow Edge
San Antonio led 26-25 after the opening period.
The one-point margin reflected a competitive start rather than a dominant performance from either side. Victor Wembanyama was already influencing the game as a scorer and rebounder, while Cleveland worked through Jarrett Allen and its perimeter creators.
The Spurs also benefited from their ability to get to the free-throw line. Their eventual 36 attempts from the stripe became one of the clearest statistical differences in the game.
Second Quarter: San Antonio Extends the Lead
The Spurs won the second quarter 29-24 and entered halftime ahead 55-49.
At this stage, San Antonio appeared to have several advantages. The team was winning the rebounding battle and had already built a six-point cushion.
Wembanyama’s interior presence was important because Cleveland had to account for his scoring, rebounding, and rim protection. Stephon Castle also helped organize the Spurs offense, eventually finishing with 15 points and eight assists.
Third Quarter: Cleveland Starts the Turnaround
Cleveland responded by winning the third quarter 27-23.
The four-point swing reduced San Antonio’s halftime advantage to two points entering the final period. This was an important turning point because the Cavaliers were no longer simply trying to stay close.
Their defensive pressure also became more noticeable in the overall statistics. Cleveland finished with 12 steals compared with seven for San Antonio.
Fourth Quarter: Cavaliers Take Control
The fourth quarter was the decisive statistical segment.
Cleveland scored 37 points while San Antonio managed only 23.
That 14-point difference transformed a two-point deficit entering the period into a 12-point victory.
ESPN’s game recap notes that Cleveland’s lead expanded after Jaylon Tyson hit consecutive three-pointers early in the fourth quarter. The Cavaliers eventually pushed the advantage to double digits and did not allow San Antonio to produce another sustained comeback. (ESPN)
This is one of the most important lessons from the cleveland cavaliers vs san antonio spurs match player stats. A team can trail for much of a game and still control the final outcome if it improves its shot quality, limits mistakes, and wins the closing minutes.
Cavaliers Player Stats
Cleveland’s starting lineup consisted of Dean Wade, Jarrett Allen, Evan Mobley, Donovan Mitchell, and Darius Garland.
The Cavaliers also received meaningful contributions from their bench, which helped spread the offensive workload.
Jarrett Allen
Jarrett Allen was the standout player for Cleveland.
He finished with:
- 27 points
- 10 rebounds
- 11-for-21 shooting
- 5-for-7 free throws
- 2 steals
- 2 turnovers
- Plus-9
Allen’s 27 points were the highest individual scoring total in the game.
His 10 rebounds also gave Cleveland a reliable interior presence against Wembanyama and the Spurs’ larger frontcourt.
The efficiency is especially important. Allen made 11 of his 21 field-goal attempts, producing a 52.4% field-goal rate from the floor based on the supplied shooting line.
He also scored 12 points during the first half, helping Cleveland stay within reach despite San Antonio taking control of the second quarter. ESPN’s recap specifically highlighted Allen’s offensive creativity around the basket, including difficult finishes during the first half. (ESPN)
Darius Garland
Darius Garland provided the game’s most notable passing performance for Cleveland.
He recorded:
- 15 points
- 5 rebounds
- 11 assists
- 3 steals
- 3 turnovers
- 5-for-13 shooting
The 11 assists were the highest total for either team.
Garland’s value was not limited to his own scoring. His playmaking helped Cleveland reach 29 team assists, eight more than San Antonio.
That difference matters when evaluating the cleveland cavaliers vs san antonio spurs match player stats because it shows how Cleveland distributed offensive responsibility.
Garland also helped create opportunities for Allen and other Cleveland shooters. His ability to organize possessions reduced the need for Cleveland’s offense to rely on isolation scoring on every trip.
Evan Mobley
Evan Mobley finished with:
- 16 points
- 7 rebounds
- 2 assists
- 3 blocks
- 7-for-13 shooting
- Plus-11
Mobley’s three blocks were tied for the highest individual block total on Cleveland.
His performance was important defensively because San Antonio’s attack centered heavily around Wembanyama’s interior presence.
Mobley did not need to match Wembanyama’s 26 points to influence the game. His defensive activity and efficient 7-for-13 shooting helped Cleveland maintain balance on both ends.
His plus-11 was also one of Cleveland’s stronger starting-player marks.
Donovan Mitchell
Donovan Mitchell finished with:
- 10 points
- 2 rebounds
- 7 assists
- 3 steals
- 3-for-12 shooting
- 2-for-9 from three-point range
- Plus-15
Mitchell’s scoring output was below the level normally associated with his primary offensive role, but his seven assists and three steals show why a box-score evaluation should not focus only on points.
His plus-15 was the best mark among Cleveland’s starters.
This is a useful example of why individual player impact cannot always be measured by scoring totals alone. Cleveland had seven players reach double figures, allowing Mitchell to contribute through creation and defense even when his own shooting was inefficient. ESPN also reported that seven Cavaliers scored in double figures. (ESPN)
Dean Wade
Dean Wade posted:
- 10 points
- 5 rebounds
- 2 three-pointers
- Plus-6
Wade’s shooting helped stretch the floor. He attempted seven field goals and made four.
His role was not about dominating possessions. Instead, he provided spacing, rebounding, and enough scoring to prevent the Spurs from concentrating entirely on Cleveland’s primary creators.
De’Andre Hunter
De’Andre Hunter delivered an important bench contribution:
- 11 points
- 9 rebounds
- 2 assists
- 2 steals
- Plus-14
His nine rebounds were especially valuable for a reserve player.
Hunter also helped Cleveland generate early momentum. ESPN’s recap notes that he produced a four-point play in the opening period after drawing a foul on a three-point attempt. (ESPN)
Jaylon Tyson and the Cleveland Bench
Jaylon Tyson finished with 11 points, three rebounds, two assists, and three steals.
His fourth-quarter three-pointers were particularly important because they helped Cleveland turn its narrow advantage into a more comfortable lead.
The broader point is that Cleveland’s bench did not need one massive scoring performance. Instead, several players provided useful contributions in different areas.
That collective production helped the Cavaliers finish with seven double-digit scorers.
Spurs Player Stats
San Antonio started Harrison Barnes, Victor Wembanyama, De’Aaron Fox, Devin Vassell, and Stephon Castle.
The Spurs had strong individual performances, but their overall shooting efficiency and fourth-quarter scoring fell short of Cleveland.
Victor Wembanyama
Victor Wembanyama was San Antonio’s leading scorer and rebounder.
He recorded:
- 26 points
- 14 rebounds
- 3 assists
- 2 turnovers
- 1 steal
- 1 block
- 7-for-16 shooting
- 10-for-12 free throws
- Minus-17
The 26-point, 14-rebound performance gave Wembanyama a double-double.
His 14 rebounds were the highest total by any player in the game.
He also generated a major portion of San Antonio’s scoring from the free-throw line, making 10 of 12 attempts.
However, Wembanyama’s minus-17 is an interesting part of the story. Plus-minus is a team-context statistic, so it should not be interpreted as a standalone measure of individual quality. In this game, it indicates that San Antonio was outscored by 17 points during his minutes.
Wembanyama still produced one of the strongest individual statistical performances on either side.
Stephon Castle
Stephon Castle finished with:
- 15 points
- 4 rebounds
- 8 assists
- 5 turnovers
- 1 steal
- 5-for-13 shooting
- Minus-17
Castle led the Spurs in assists.
His eight assists show that he was an important part of San Antonio’s offensive creation. However, the five turnovers were also significant.
That is one of the clearest contrasts between the teams. Castle generated opportunities, but Cleveland’s defensive pressure forced San Antonio into 18 turnovers overall.
De’Aaron Fox
De’Aaron Fox recorded:
- 14 points
- 2 rebounds
- 3 assists
- 2 turnovers
- 4-for-13 shooting
- 1-for-6 from three-point range
- Minus-13
Fox’s 14 points made him the third San Antonio player in double figures among the primary contributors listed in the supplied data.
However, his shooting efficiency was limited.
He made four of 13 field-goal attempts and one of six from three-point range. Against a Cleveland team that finished with 12 steals and forced 18 San Antonio turnovers, those missed opportunities became increasingly important.
Dylan Harper
Dylan Harper added:
- 11 points
- 4 rebounds
- 1 assist
- 4 turnovers
- 1 steal
- 5-for-11 shooting
- 1-for-2 from three
Harper’s 11 points gave San Antonio another double-digit scorer.
His shooting efficiency was respectable, but the four turnovers added to the Spurs’ overall ball-security problem.
Harrison Barnes
Harrison Barnes finished with:
- 3 points
- 4 rebounds
- 3 assists
- 1 turnover
- 1 steal
- 1-for-7 shooting
- 1-for-5 from three
Barnes struggled to convert his opportunities.
His three points represented the lowest scoring total among San Antonio’s starters.
That became more significant because San Antonio already had difficulty generating efficient perimeter offense. The Spurs finished only 7-for-31 from three-point range.
Devin Vassell
Devin Vassell finished with:
- 7 points
- 4 rebounds
- 1 turnover
- 3-for-10 shooting
- 1-for-6 from three
Vassell’s shooting was another reason San Antonio struggled to maintain offensive efficiency.
The Spurs made just 23% of their three-point attempts as a team. When several perimeter players are below their normal efficiency in the same game, it becomes much harder to compensate through half-court scoring.
Cleveland vs San Antonio Team Comparison
The overall numbers show that Cleveland won through a combination of shooting, passing, and ball security.
Shooting Efficiency
Cleveland:
- 41-for-96 from the field
- 43% field-goal shooting
- 13-for-42 from three
- 31% from three
San Antonio:
- 32-for-83 from the field
- 39% field-goal shooting
- 7-for-31 from three
- 23% from three
The biggest difference was three-point production.
Cleveland made six more three-pointers than San Antonio.
Those six additional made threes represent 18 points, which is a major contribution in a game decided by 12 points.
Free-Throw Advantage for San Antonio
The Spurs had the better free-throw volume.
San Antonio went 30-for-36, while Cleveland went 18-for-20.
The Spurs therefore made 12 more free throws.
That advantage kept San Antonio competitive even while its field-goal and three-point shooting lagged behind Cleveland.
Rebounding Advantage for San Antonio
San Antonio collected 52 rebounds to Cleveland’s 47.
This is important because the Spurs did not lose the game due to being dominated on the glass.
Wembanyama led the way with 14 rebounds, while San Antonio received additional work from its bench.
The Cavaliers nevertheless found ways to win despite losing the overall rebounding battle.
Passing Advantage for Cleveland
Cleveland recorded 29 assists.
San Antonio recorded 21.
The eight-assist difference is one of the clearest indicators of Cleveland’s offensive balance.
Garland’s 11 assists were especially important because he accounted for more than one-third of Cleveland’s total assists.
Turnover Advantage for Cleveland
Cleveland committed 12 turnovers.
San Antonio committed 18.
That six-turnover difference helped Cleveland compensate for San Antonio’s advantages in free throws and rebounds.
The Cavaliers also recorded 12 steals, compared with seven for San Antonio.
The combination of more steals and fewer turnovers suggests that Cleveland was able to create additional possessions through defensive activity while protecting its own possessions better.
Why Jarrett Allen’s Performance Was So Important
Jarrett Allen’s 27 points were not just the highest individual scoring total in the game. His performance also addressed a key tactical need.
San Antonio had Wembanyama protecting the interior and controlling the defensive glass.
Cleveland needed a reliable inside scorer who could punish the Spurs when opportunities appeared around the basket.
Allen delivered that production while also collecting 10 rebounds.
The contrast between the two centers is particularly interesting.
Wembanyama:
- 26 points
- 14 rebounds
- 3 assists
- 7-for-16 shooting
- 10-for-12 free throws
Allen:
- 27 points
- 10 rebounds
- 0 assists
- 11-for-21 shooting
- 5-for-7 free throws
Both centers produced double-doubles.
Wembanyama had the larger rebounding total and more assists, while Allen finished with one more point and a strong field-goal percentage.
This matchup was therefore much closer statistically than the final 12-point margin might suggest.
How Cleveland Won Despite Losing the Rebounding Battle
One of the most useful lessons from this game is that rebounding totals do not operate in isolation.
San Antonio had five more rebounds.
The Spurs also attempted 16 more free throws.
Yet Cleveland won comfortably.
The Cavaliers compensated in three major areas:
- Better field-goal efficiency: Cleveland shot 43% compared with 39%.
- Better three-point production: Cleveland made 13 threes compared with seven.
- Better ball security: Cleveland committed 12 turnovers compared with San Antonio’s 18.
Cleveland also had eight more assists and five more steals.
The result demonstrates why a complete player-stat analysis needs to connect individual numbers with team-level possession data.
The Fourth Quarter Changed the Game
The fourth quarter deserves special attention because it explains the final score better than the first three periods.
San Antonio entered the fourth quarter with a 78-76 lead.
Cleveland then scored 37 points.
San Antonio scored 23.
A 14-point quarter differential is enormous when the teams are separated by only two points entering the period.
The Cavaliers’ ability to increase their offensive output while holding San Antonio to 23 points produced the final 113-101 margin.
ESPN’s recap specifically identified Cleveland’s fourth-quarter run, including consecutive three-pointers from Jaylon Tyson, as a major part of the turnaround. (ESPN)
What the Player Stats Reveal About Team Style
The cleveland cavaliers vs san antonio spurs match player stats reveal two contrasting offensive profiles.
Cleveland relied heavily on distribution.
The Cavaliers produced 29 assists and had multiple players capable of scoring at least 10 points.
San Antonio leaned more heavily on individual scoring from Wembanyama and contributions from Castle, Fox, Harper, and others.
Neither approach is automatically better in every game. What mattered here was execution.
Cleveland’s balanced offense allowed the team to continue producing even when Mitchell struggled from the field.
Mitchell scored only 10 points on 3-for-12 shooting, but Garland created 11 assists, Allen scored 27, Mobley added 16, and several reserves provided double-digit production.
That is offensive resilience.
The Importance of Cleveland’s Defensive Activity
Cleveland finished with 12 steals.
That number is significant because it was five more than San Antonio’s seven.
Steals can create transition possessions, but their value also depends on what happens after the turnover.
In this game, Cleveland’s ability to generate turnovers combined with San Antonio’s 18 total turnovers gave the Cavaliers additional chances to score.
Mobley’s three blocks also added a layer of interior defensive resistance.
The Cavaliers therefore influenced the game in multiple defensive ways rather than relying on one type of stop.
The Spurs’ Main Statistical Problem
San Antonio’s biggest issue was shooting efficiency from the field and from three-point range.
The Spurs made 32 of 83 field-goal attempts.
That is 38.6%, which rounds to the listed 39%.
From three-point range, they made only seven of 31 attempts.
That is approximately 22.6%.
The Spurs made enough free throws to remain competitive, but free throws could not completely compensate for the difference in shot-making from the floor.
Their 18 turnovers also limited the number of possessions available for those shots.
Season Series Context
The Cavaliers completed a 2-0 season series sweep of the Spurs according to the supplied game data.
The previous meeting took place on December 6, 2025, when Cleveland defeated San Antonio 130-117.
The two games therefore produced two Cleveland victories, but the scoring patterns were different.
The December 6 game reached 130 points for Cleveland.
The December 30 meeting ended at 113 points for the Cavaliers.
That difference suggests the second matchup was more about defensive execution and late-game control than simply an offensive shootout.
Most Important Player Stats at a Glance
| Player | Team | Points | Rebounds | Assists | Key Stat |
| Jarrett Allen | Cavaliers | 27 | 10 | 0 | Led all scorers |
| Victor Wembanyama | Spurs | 26 | 14 | 3 | Led all rebounders |
| Evan Mobley | Cavaliers | 16 | 7 | 2 | 3 blocks |
| Stephon Castle | Spurs | 15 | 4 | 8 | Led Spurs in assists |
| Darius Garland | Cavaliers | 15 | 5 | 11 | Led all players in assists |
| De’Aaron Fox | Spurs | 14 | 2 | 3 | 14 points |
| De’Andre Hunter | Cavaliers | 11 | 9 | 2 | 9 rebounds off bench |
| Dylan Harper | Spurs | 11 | 4 | 1 | 11 points |
| Donovan Mitchell | Cavaliers | 10 | 2 | 7 | 3 steals |
| Dean Wade | Cavaliers | 10 | 5 | 0 | 2 three-pointers |
This table highlights the central story of the game: Cleveland received contributions across several statistical categories rather than depending on one player to carry the entire offense.
A Closer Look at Plus-Minus
Plus-minus can be useful, but it should be interpreted carefully.
For Cleveland, Donovan Mitchell posted the best starting-player plus-minus at +15, followed by Evan Mobley at +11, Jarrett Allen at +9, Dean Wade at -6, and Darius Garland at +3.
For San Antonio, Wembanyama and Castle both finished at -17, while several bench players had less negative or positive marks.
A player can post a strong individual box score while still having a negative plus-minus because the statistic measures team scoring margin during the player’s time on the court.
Wembanyama is the clearest example from this matchup. His 26 points and 14 rebounds were excellent individual numbers, yet San Antonio was outscored during his minutes.
That does not erase his performance. It simply shows why multiple statistics are necessary when analyzing player impact.
What Fantasy Basketball Readers Can Take From the Game
For fantasy basketball analysis, this matchup provides several useful lessons.
Wembanyama’s 26-point, 14-rebound double-double demonstrates his ability to contribute across several categories.
Allen’s 27 points and 10 rebounds show strong scoring and rebounding production.
Garland’s 11 assists make his performance particularly valuable in formats that reward playmaking.
Mobley’s 16 points, seven rebounds, two assists, and three blocks provide a strong example of multi-category production.
Castle’s 15 points and eight assists also show his value as a creator.
The key is not to treat one game’s statistics as a permanent projection of future performance. A single matchup is useful evidence, but it should be combined with larger samples when making fantasy decisions.
What the Game Means for Statistical Analysis
For readers studying NBA match data, this game demonstrates why the best analysis combines four layers.
Individual production
This includes points, rebounds, assists, steals, blocks, shooting percentage, and turnovers.
Team efficiency
This includes field-goal percentage, three-point percentage, free-throw percentage, and scoring by quarter.
Possession management
Turnovers, offensive rebounds, and assists provide additional context about how teams create and protect possessions.
Game flow
The timing of production matters.
Cleveland’s 37-point fourth quarter was more important to the final result than the fact that San Antonio had a six-point halftime lead.
That is why a simple list of player points cannot fully explain the game.
Final Assessment of the Match
The Cavaliers’ 113-101 victory was built on a balanced statistical foundation.
Jarrett Allen led Cleveland with 27 points and 10 rebounds.
Darius Garland controlled the passing game with 11 assists.
Evan Mobley provided 16 points and three blocks.
De’Andre Hunter added 11 points and nine rebounds from the bench.
Donovan Mitchell struggled as a scorer but contributed seven assists and three steals.
San Antonio received an excellent individual performance from Wembanyama, who posted 26 points and 14 rebounds.
Castle added 15 points and eight assists, while Fox scored 14.
However, the Spurs’ 39% field-goal shooting, 23% three-point shooting, and 18 turnovers limited their ability to turn their rebounding and free-throw advantages into a win.
The fourth quarter ultimately separated the teams.
Cleveland entered the final period trailing 78-76 and finished it with a 37-23 advantage.
That single quarter changed the direction of the game and produced the final 12-point margin.
FAQs
Who led the Cavaliers in the game?
Jarrett Allen led Cleveland with 27 points and 10 rebounds. He shot 11-for-21 from the field and also recorded two steals.
Who led the Spurs in scoring?
Victor Wembanyama led San Antonio with 26 points. He also collected 14 rebounds, three assists, one steal, and one block.
Who had the most assists in the game?
Darius Garland recorded the most assists with 11. Stephon Castle led San Antonio with eight assists.
Which team had more rebounds?
San Antonio had more rebounds, finishing with 52 compared with Cleveland’s 47.
Which team shot better from three-point range?
Cleveland shot better from three-point range at 31%. The Cavaliers made 13 of 42 attempts, while San Antonio made seven of 31 for 23%.
How did Cleveland win despite San Antonio having more rebounds?
Cleveland compensated through better field-goal and three-point shooting, fewer turnovers, more assists, and more steals. The Cavaliers also produced a decisive 37-point fourth quarter.
Conclusion
The cleveland cavaliers vs san antonio spurs match player stats show why a final score should always be examined alongside individual and team statistics.
Cleveland won 113-101 despite trailing at halftime and losing the overall rebounding battle. Jarrett Allen’s 27 points and 10 rebounds provided the scoring foundation, while Darius Garland’s 11 assists helped keep the offense organized. Evan Mobley contributed efficient scoring and three blocks, and Cleveland received important production from its bench.
San Antonio’s Victor Wembanyama delivered 26 points and 14 rebounds, while Stephon Castle and De’Aaron Fox also made meaningful contributions. The Spurs’ biggest statistical problems were their 39% field-goal shooting, 23% three-point shooting, and 18 turnovers.
The decisive difference came in the fourth quarter. Cleveland scored 37 points while San Antonio scored 23. Combined with the Cavaliers’ superior assist total, stronger three-point production, and lower turnover count, that late surge explains how Cleveland turned a two-point deficit entering the final period into a 12-point road victory.
For readers studying cleveland cavaliers vs san antonio spurs match player stats, the most useful takeaway is that the game was not decided by one statistic. It was the interaction between shooting efficiency, playmaking, turnovers, defensive activity, and late-game execution that ultimately determined the result.