Golden State Warriors vs Phoenix Suns Match Player Stats
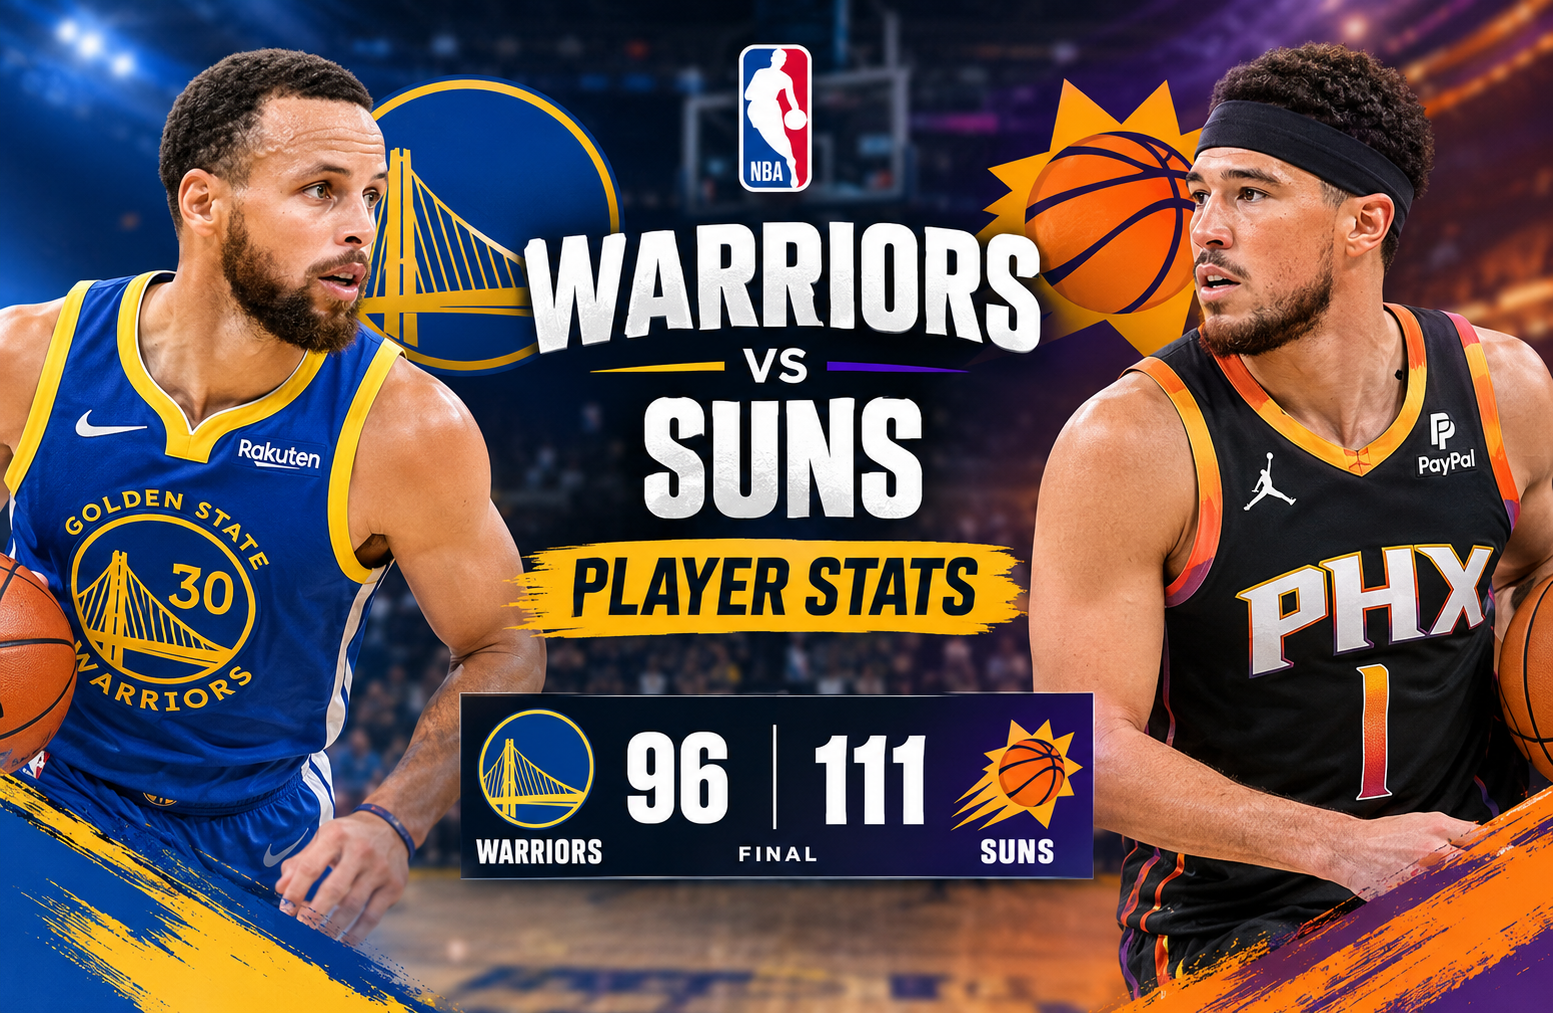
The golden state warriors vs phoenix suns match player stats from the April 18, 2026, NBA Play-In Tournament game reveal how Phoenix turned a strong opening quarter, accurate three-point shooting, and aggressive defense into a 111-96 victory. Jalen Green led all scorers with 36 points, while Devin Booker added 20 points and eight assists. For Golden State, Brandin Podziemski delivered a team-high 23 points and 10 rebounds, but the Warriors struggled to protect the basketball and keep pace with Phoenix’s offense.
The game took place at Mortgage Matchup Center in Phoenix, Arizona, with an attendance of 17,071. Phoenix won the Western Conference Play-In Tournament’s eighth-seed game by 15 points, strengthening its position in the postseason race. The final score tells only part of the story. A closer look at individual performances, shooting efficiency, turnovers, defensive pressure, and the quarter-by-quarter scoring explains why the Suns prevailed despite a competitive second quarter from Golden State.
This breakdown uses the supplied ESPN box-score data to explain the result, identify the leading players, and show which statistical differences mattered most. It also distinguishes individual production from overall team impact, helping readers understand more than just the final numbers.
Game Overview: Phoenix Suns vs Golden State Warriors
Winning team
Phoenix Suns
111
45-37 regular-season record
Final score
111-96
15-point margin
Golden State Warriors
96
37-45 regular-season record
Game date
April 18, 2026
Venue
Mortgage Matchup Center
Location
Phoenix, Arizona
Competition: Western Conference Play-In Tournament, eighth-seed game. Source: supplied ESPN box-score data.
Final Score by Quarter
| Quarter | Golden State | Phoenix |
| First | 15 | 33 |
| Second | 30 | 17 |
| Third | 24 | 28 |
| Fourth | 27 | 33 |
| Total | 96 | 111 |
The first quarter created Phoenix’s biggest early advantage. The Suns scored 33 points while holding Golden State to 15, producing an 18-point lead. The Warriors responded with a 30-point second quarter and outscored Phoenix by 13 during that period, reducing the deficit to five at halftime.
Phoenix regained control after the break, winning both the third and fourth quarters. Its 33-point fourth quarter helped prevent Golden State from completing a comeback.
The central lesson is that the Warriors showed they could generate offense after a slow start, but they could not sustain that response across all four quarters.
Golden State Warriors vs Phoenix Suns Match Player Stats: Top Performers
The individual numbers show two different paths to the final result. Phoenix received an outstanding scoring performance from Jalen Green, efficient playmaking from Devin Booker, and disruptive defense from Jordan Goodwin. Golden State depended heavily on Brandin Podziemski and needed more consistent offensive production from its other key players.
Leading Player Statistics
| Player | Team | Points | Rebounds | Assists | Steals | Blocks |
| Jalen Green | Suns | 36 | 6 | 4 | 2 | 3 |
| Brandin Podziemski | Warriors | 23 | 10 | 0 | 1 | 0 |
| Devin Booker | Suns | 20 | 6 | 8 | 1 | 0 |
| Jordan Goodwin | Suns | 19 | 9 | 2 | 6 | 0 |
| De’Anthony Melton | Warriors | 16 | 8 | 3 | 0 | 0 |
| Stephen Curry | Warriors | 17 | 4 | 4 | 2 | 0 |
| Dillon Brooks | Suns | 13 | 1 | 4 | 0 | 0 |
| Kristaps Porzingis | Warriors | 11 | 1 | 0 | 0 | 0 |
| Royce O’Neale | Suns | 11 | 2 | 1 | 0 | 0 |
| Oso Ighodaro | Suns | 10 | 6 | 1 | 1 | 1 |
These figures illustrate why the result was not simply a contest between the teams’ leading scorers. Green supplied the biggest individual scoring performance, Booker helped organize Phoenix’s offense, and Goodwin contributed across scoring, rebounding, and steals.
Golden State had several players reach double figures, but its overall production was less balanced in terms of playmaking and ball security.
Jalen Green: Phoenix’s Leading Scorer
Jalen Green
Phoenix Suns · Guard
36 points
14-of-20 FG · 8-of-14 3PT
6 rebounds · 4 assists · 3 blocks
Green’s 36 points made him the leading scorer on either team. He converted 14 of 20 field-goal attempts, an impressive 70% shooting rate, and made eight of his 14 three-point attempts.
His long-range shooting was especially important. Eight made three-pointers accounted for 24 of his 36 points. That means two-thirds of his scoring came from beyond the arc, giving Phoenix a substantial offensive boost without requiring him to rely on free throws.
Green also recorded six rebounds, four assists, two steals, and three blocks. Those defensive statistics added value beyond his scoring.
The most important detail is the combination of volume and accuracy. Green did not simply take many shots and accumulate points. He converted his attempts at a high rate while stretching Golden State’s defense beyond the three-point line.
For the Warriors, this created a difficult defensive choice. Giving Green additional space risked more perimeter scoring, while pressuring him could open passing opportunities or driving lanes for other Phoenix players.
Devin Booker: Scoring and Playmaking
Devin Booker
Phoenix Suns · Guard
20 points
5-of-12 FG · 10-of-10 FT
6 rebounds · 8 assists · 1 turnover
Booker’s performance was valuable because he contributed in two major offensive areas. He scored 20 points and recorded eight assists, the highest assist total among the players listed in the supplied box score.
His free-throw shooting was perfect. Booker converted all 10 attempts from the line, accounting for half of his total points. Although he missed all four of his three-point attempts, he still finished with an effective scoring contribution through two-point attempts and free throws.
His eight assists also demonstrate why scoring totals alone cannot fully explain a guard’s performance. A player can create valuable scoring chances for teammates even when his own perimeter shot is not falling.
Booker committed just one turnover. That figure stands out when compared with Golden State’s overall turnover total of 20. Phoenix benefited from a primary playmaker who could score, create opportunities, and generally avoid giving away possessions.
Jordan Goodwin: Defensive Pressure and Rebounding
Jordan Goodwin
Phoenix Suns · Guard
19 points
7-of-11 FG · 4-of-7 3PT
9 rebounds · 6 steals
Goodwin delivered one of the most complete performances of the game. He scored 19 points, grabbed nine rebounds, and recorded six steals.
His shooting was efficient, too. Goodwin made seven of 11 field-goal attempts and four of seven three-pointers. Those results gave Phoenix another reliable perimeter threat alongside Green.
The six steals were particularly significant. Steals can interrupt offensive possessions before the opposing team gets a chance to attempt a shot. They may also create transition opportunities, allowing the defensive team to attack before the opposition can establish its half-court defense.
Phoenix recorded 14 steals as a team, compared with five for Golden State. Goodwin’s six steals represented a substantial portion of that total.
His nine rebounds also helped Phoenix compete for possession despite finishing with three fewer total rebounds than the Warriors. The combination of rebounding, perimeter scoring, and defensive activity made his contribution broader than his points alone suggest.
Brandin Podziemski: Golden State’s Leading Performer
Brandin Podziemski
Golden State Warriors · Guard
23 points
9-of-17 FG · 3-of-5 3PT
10 rebounds · 4 turnovers
Podziemski led Golden State in scoring and rebounding, finishing with 23 points and 10 rebounds. He was one of the Warriors’ most productive players from the field, converting nine of 17 attempts.
He also made three of five three-pointers, a 60% success rate from long range. His ability to score efficiently gave Golden State a useful offensive foundation, particularly after the team’s poor opening quarter.
However, Podziemski recorded four turnovers and no assists in the supplied statistics. That does not erase his scoring and rebounding contribution, but it highlights the difference between individual production and overall possession management.
A double-double, achieved by reaching double figures in two statistical categories, is a meaningful accomplishment. In this case, Podziemski’s 23 points and 10 rebounds showed that he was active in both scoring and controlling the glass.
The Warriors still needed a stronger collective performance around him. His production was not enough to offset Phoenix’s scoring efficiency and defensive pressure.
Stephen Curry: A Difficult Shooting Night
Stephen Curry
Golden State Warriors · Guard
17 points
4-of-16 FG · 3-of-10 3PT
4 rebounds · 4 assists · 4 turnovers
Curry finished with 17 points, four rebounds, four assists, and two steals. He made six of six free throws but struggled to convert field-goal attempts.
His four makes on 16 attempts produced a field-goal percentage of 25%. From three-point range, he converted three of 10 attempts, or 30%.
These numbers do not mean that Curry’s presence had no offensive value. His shooting reputation can influence how opponents position defenders and how much attention they devote to him. However, the supplied box score shows that his own shooting efficiency was limited on this occasion.
The Warriors needed to generate more efficient offense elsewhere to compensate. Podziemski and Melton provided useful scoring, but Golden State’s overall shooting and turnover numbers remained inferior to Phoenix’s.
Curry also committed four turnovers. When a team is attempting to erase an early deficit, lost possessions can make a comeback more difficult because they reduce the number of opportunities to score.
De’Anthony Melton: An Important Supporting Contribution
Melton scored 16 points, grabbed eight rebounds, and recorded three assists. He made five of 10 field-goal attempts, including two of four three-pointers, and converted all four of his free throws.
His 16 points were the third-highest total for Golden State among the listed individual performances, behind Podziemski and Curry. His eight rebounds also gave the Warriors another useful contributor on the glass.
Melton’s shooting efficiency was stronger than Curry’s in this game. His ability to score from multiple areas offered Golden State another option when its main offensive threat was struggling.
Even so, individual efficiency cannot completely overcome a large team-level turnover disadvantage. Golden State needed more players to contribute efficiently while also protecting possession.
Other Notable Player Contributions
Several additional performances help explain the box score.
- Kristaps Porzingis: Scored 11 points, making three of five field-goal attempts and two of three three-pointers. He also recorded three turnovers and finished with a minus-22 plus/minus figure.
- Al Horford: Contributed nine points, five rebounds, and two assists. He made three of eight field-goal attempts and one of four three-pointers.
- Gui Santos: Finished with nine points, six rebounds, and four assists. His four assists tied Curry for the second-highest total among the Warriors’ listed players.
- Gary Payton II: Added four points, three rebounds, and three assists while committing no turnovers.
- Dillon Brooks: Scored 13 points and recorded four assists for Phoenix, although he made only four of 14 field-goal attempts.
- Oso Ighodaro: Added 10 points and six rebounds, converting four of six field-goal attempts.
- Royce O’Neale: Scored 11 points, including three three-pointers, to support Phoenix’s perimeter attack.
These contributions mattered because Phoenix did not need Green to produce every point. Booker, Goodwin, Brooks, Ighodaro, and O’Neale all reached double figures, giving the Suns several sources of offense.
Complete Golden State Warriors Player Stats
The following table consolidates the supplied individual box-score figures. Shooting is presented as field goals, three-pointers, and free throws made and attempted.
| Warriors player | PTS | REB | AST | STL | BLK | TO |
| Draymond Green | 5 | 2 | 6 | 1 | 0 | 5 |
| Gui Santos | 9 | 6 | 4 | 1 | 0 | 2 |
| Kristaps Porzingis | 11 | 1 | 0 | 0 | 0 | 3 |
| Stephen Curry | 17 | 4 | 4 | 2 | 0 | 4 |
| Brandin Podziemski | 23 | 10 | 0 | 1 | 0 | 4 |
| Al Horford | 9 | 5 | 2 | 0 | 0 | 1 |
| Charles Bassey | 0 | 0 | 0 | 0 | 0 | 0 |
| Seth Curry | 0 | 0 | 0 | 0 | 0 | 0 |
| Gary Payton II | 4 | 3 | 3 | 0 | 0 | 0 |
| De’Anthony Melton | 16 | 8 | 3 | 0 | 0 | 1 |
| Pat Spencer | 2 | 0 | 0 | 0 | 0 | Not specified |
| Will Richard | 0 | 0 | 0 | 0 | 0 | Not specified |
Statistical note: The supplied data lists zero points, rebounds, and assists for several players who attempted no shots. These figures should not be interpreted as evidence of poor play by themselves. Minutes played, role, and opportunity also matter. Turnover totals marked as not specified are not assumed to be zero.
What the Warriors’ Numbers Reveal
Three patterns stand out.
First, Podziemski led both the team in scoring and rebounding. His performance gave Golden State an important source of offense and second-chance opportunities.
Second, Golden State received 17 points from Curry and 16 from Melton. These contributions helped the team finish with 96 points, despite scoring only 15 in the opening quarter.
Third, the team recorded 20 turnovers. Draymond Green committed five, while Curry and Podziemski each committed four. Together, those three players accounted for 13 turnovers.
The team total is more important than any single player’s figure. Phoenix’s defense pressured Golden State across the lineup, and the Warriors did not consistently convert possessions into quality scoring opportunities.
Complete Phoenix Suns Player Stats
| Suns player | PTS | REB | AST | STL | BLK | TO |
| Dillon Brooks | 13 | 1 | 4 | 0 | 0 | 5 |
| Oso Ighodaro | 10 | 6 | 1 | 1 | 1 | 1 |
| Devin Booker | 20 | 6 | 8 | 1 | 0 | 1 |
| Jordan Goodwin | 19 | 9 | 2 | 6 | 0 | 1 |
| Jalen Green | 36 | 6 | 4 | 2 | 3 | 2 |
| Royce O’Neale | 11 | 2 | 1 | 0 | 0 | 1 |
| Haywood Highsmith | 0 | 1 | 1 | 2 | 0 | 0 |
| Ryan Dunn | 0 | 0 | 0 | 1 | 0 | 0 |
| Rasheer Fleming | 0 | 0 | 0 | 0 | 0 | Not specified |
| Khaman Maluach | 0 | 2 | 0 | 0 | 0 | Not specified |
| Amir Coffey | 0 | 0 | 0 | 0 | 0 | Not specified |
| Collin Gillespie | 2 | 2 | 2 | 1 | 0 | 1 |
| Jamaree Bouyea | 0 | 1 | 0 | 0 | 0 | Not specified |
| Grayson Allen | DNP | DNP | DNP | DNP | DNP | DNP |
DNP means did not play. The supplied data identifies Allen’s status as a coach’s decision. Turnover figures not explicitly supplied for some players are marked as not specified rather than inferred.
What the Suns’ Numbers Reveal
Phoenix’s player statistics show a more varied offensive attack.
Green led the scoring with 36 points, Booker added 20, and Goodwin finished with 19. Brooks, O’Neale, and Ighodaro each scored at least 10 points as well.
The Suns also recorded 23 assists, compared with 22 for Golden State. That narrow difference is worth noting: Phoenix did not win because it recorded dramatically more assists. Instead, its advantage came from making more shots, hitting more three-pointers, and committing fewer turnovers.
Goodwin’s six steals and Green’s three blocks also show how individual defense contributed to the team’s overall pressure.
Team Statistics Comparison: Warriors vs Suns
Individual performances are useful, but team statistics provide the clearest explanation of the final result. Phoenix made more field goals, converted more three-pointers, protected the ball better, and created more defensive disruptions.
| Team statistic | Warriors | Suns |
| Total points | 96 | 111 |
| Field goals made | 33 | 39 |
| Field goals attempted | 74 | 81 |
| Field-goal percentage | 45% | 48% |
| Three-pointers made | 11 | 18 |
| Three-pointers attempted | 33 | 49 |
| Three-point percentage | 33% | 37% |
| Free throws made | 19 | 15 |
| Free throws attempted | 23 | 15 |
| Free-throw percentage | 83% | 100% |
| Total rebounds | 39 | 36 |
| Offensive rebounds | 12 | 9 |
| Defensive rebounds | 27 | 27 |
| Assists | 22 | 23 |
| Turnovers | 20 | 12 |
| Steals | 5 | 14 |
| Blocks | 0 | 4 |
| Personal fouls | 19 | 23 |
The supplied ESPN figures show that Phoenix’s advantages were concentrated in shooting and ball security rather than rebounding or free-throw volume.
1. Field-Goal Efficiency Favored Phoenix
Phoenix made 39 of 81 field-goal attempts, while Golden State made 33 of 74.
Using the supplied shooting figures, the Suns converted approximately 48.1% of their attempts. The Warriors converted approximately 44.6%.
That difference may look modest, but it represents six additional made field goals for Phoenix. Across a game decided by 15 points, those extra baskets made a meaningful contribution.
The Warriors were not completely ineffective from the field. Their 45% listed shooting percentage was respectable, and they made more free throws than Phoenix. However, their overall shooting output was not enough to compensate for the Suns’ higher number of made baskets and three-pointers.
2. Three-Point Shooting Created a Major Scoring Gap
Phoenix made 18 three-pointers on 49 attempts. Golden State made 11 on 33 attempts.
The Suns therefore made seven more three-pointers. Since every successful three-pointer is worth three points, that difference represented 21 additional points from made threes before accounting for any differences in the rest of the scoring.
The comparison requires some context. Phoenix also attempted 16 more three-pointers, so its advantage came from both higher volume and a slightly better conversion rate.
| Three-point measure | Warriors | Suns |
| Made | 11 | 18 |
| Attempted | 33 | 49 |
| Percentage | 33.3% | 36.7% |
| Points from made threes | 33 | 54 |
The Suns scored 54 points from three-pointers, compared with 33 for the Warriors. That 21-point difference was larger than Phoenix’s 15-point winning margin.
This does not mean three-point shooting alone determined the outcome. Phoenix’s turnovers, defense, and opening-quarter performance also mattered. However, the long-range scoring gap was one of the clearest numerical differences between the teams.
Green’s eight made threes were especially important. Goodwin added four, while Brooks and O’Neale made three each. That spread gave Golden State several shooters to account for rather than a single perimeter threat.
3. Turnovers Were a Critical Difference
Golden State committed 20 turnovers, while Phoenix committed 12.
That created an eight-turnover disadvantage for the Warriors. In practical terms, a turnover ends an offensive possession without a shot being recorded, unless the turnover occurs during an unusual sequence involving a foul or another event.
The number of turnovers does not reveal exactly how many points were scored from those mistakes. A turnover can lead to a fast-break basket, a missed shot, or a defensive reset. The supplied figures do not include a verified points-off-turnovers total, so one should not invent one.
Nevertheless, the possession gap matters. Golden State had fewer chances to finish offensive sequences, while Phoenix was better at retaining the ball.
Draymond Green recorded five turnovers. Curry and Podziemski each had four, and Porzingis recorded three. Those figures show that the issue was not confined to one player.
Phoenix also committed mistakes, including five turnovers by Brooks. The difference was that the Suns limited their team total to 12 and created 14 steals on defense.
For the Warriors, reducing turnovers would have been a practical way to improve the outcome without requiring a dramatic increase in shooting percentage.
4. Rebounding Was Competitive
Golden State actually won the total rebounding battle, 39 to 36.
The Warriors recorded 12 offensive rebounds, compared with nine for Phoenix. Both teams collected 27 defensive rebounds.
These figures show that Golden State was not dominated on the glass. Its offensive rebounds also indicate that it generated some additional possessions after missed shots.
However, offensive rebounds do not automatically produce points. Teams must still convert the second-chance opportunities they create.
Podziemski led all players with 10 rebounds, while Melton added eight. For Phoenix, Goodwin grabbed nine rebounds, and Green, Booker, and Ighodaro recorded six apiece.
This comparison is important because it prevents an overly simple explanation of the result. Phoenix did not win every statistical category. The Warriors were competitive in rebounding but lost the game because other areas, particularly turnovers and perimeter scoring, favored the Suns.
5. Free-Throw Shooting Helped Both Teams in Different Ways
Golden State made 19 of 23 free throws, while Phoenix converted all 15 of its attempts.
The Warriors scored four more points at the free-throw line because they made four more free throws overall. Phoenix, however, achieved a perfect conversion rate.
This distinction matters when interpreting shooting efficiency. A team can score more points at the line by attempting more free throws, even if its percentage is lower.
Booker made all 10 of his free throws, accounting for a large part of his 20-point performance. The Warriors’ free-throw production was spread across their roster, with Curry making all six of his attempts.
Phoenix’s perfect team percentage also meant it wasted no opportunities at the line. Still, the larger game-level differences were the three-point gap and turnovers, rather than free-throw accuracy alone.
6. Defensive Disruption Favored Phoenix
The Suns recorded 14 steals and four blocks. Golden State had five steals and no blocks in the supplied team totals.
Steals and blocks measure different types of defensive events. A steal occurs when a defender gains possession or intercepts the ball, while a block records a defensive deflection of an attempted shot. Neither statistic captures every successful defensive possession.
Phoenix’s advantage was substantial in both categories. Goodwin recorded six steals, Green added two steals and three blocks, and several other Suns contributed to the team’s defensive totals.
Golden State’s five steals were led by Curry, who recorded two. The Warriors did not record a block in the team totals provided.
These numbers suggest that Phoenix disrupted Golden State’s offense more frequently. The Suns’ defensive activity aligned with their eight-turnover advantage and helped prevent the Warriors from building consistent offensive rhythm.
Why Phoenix Won the First Quarter
The opening quarter was one of the most influential periods of the game. Phoenix scored 33 points, while Golden State managed only 15.
An 18-point difference in a single quarter puts a team under immediate pressure. The trailing team must not only outscore its opponent but also make up the existing gap.
Golden State responded well in the second quarter, scoring 30 points and holding Phoenix to 17. The Warriors reduced the deficit to five by halftime.
That response demonstrated that the game was not beyond reach after the first 12 minutes. However, Phoenix scored 28 points in the third quarter and 33 in the fourth, preventing Golden State from completing the comeback.
How the Quarter-by-Quarter Margin Changed
| Game stage | Warriors points | Suns points | Cumulative margin |
| First quarter | 15 | 33 | Suns by 18 |
| Halftime | 45 | 50 | Suns by 5 |
| Third-quarter end | 69 | 78 | Suns by 9 |
| Final | 96 | 111 | Suns by 15 |
The halftime score is particularly revealing. Golden State had recovered 13 points of the original 18-point deficit, but Phoenix still held the lead.
The Suns then extended the margin in the second half. Their ability to respond after the Warriors’ strong second quarter was just as important as their early advantage.
A full game is made up of changing stretches of momentum. A team that wins one quarter convincingly still needs to maintain its execution across the remaining periods.
The Role of Plus/Minus in the Game
Plus/minus measures the difference between a team’s points scored and points allowed while a particular player is on the court. It is a useful descriptive statistic, but it should not be treated as a complete measure of individual ability.
The supplied player figures show the following notable results:
| Player | Team | Plus/minus |
| Devin Booker | Suns | +25 |
| Jalen Green | Suns | +22 |
| Dillon Brooks | Suns | +21 |
| Jordan Goodwin | Suns | +17 |
| Brandin Podziemski | Warriors | -5 |
| De’Anthony Melton | Warriors | -9 |
| Stephen Curry | Warriors | -13 |
| Draymond Green | Warriors | -13 |
| Kristaps Porzingis | Warriors | -22 |
Booker recorded the highest listed plus/minus at +25, while Porzingis recorded the lowest at -22.
These numbers align with Phoenix’s overall victory, but they do not establish that one player alone caused the result. Plus/minus depends on teammates, opponents, substitutions, and the timing of scoring runs.
For example, a player may post a positive figure because he shares the floor with an effective lineup, even if he does not lead the team in scoring. Likewise, a player can have a negative figure despite making valuable individual contributions.
Podziemski’s 23 points and 10 rebounds alongside a minus-five figure illustrate this distinction. His individual performance was productive, but the Warriors were outscored during his minutes on the court.
Tactical Lessons From the Match
The numbers offer several useful lessons for understanding basketball performance.
Phoenix benefited from multiple perimeter threats
Green’s eight three-pointers were the headline contribution, but Goodwin, Brooks, and O’Neale also made multiple threes. This distribution made Phoenix’s offense harder to defend by focusing on one player.
When multiple players can score from the perimeter, defenders must cover more space. That can create driving lanes, passing opportunities, and mismatches elsewhere.
Golden State needed more efficient possessions
The Warriors scored 96 points despite making 33 field goals and 19 free throws. Their 20 turnovers limited their ability to turn possessions into scoring chances.
A team trying to overcome an early deficit benefits from efficient possessions because every lost possession reduces the opportunities available to close the gap.
Golden State’s second-quarter comeback showed that it could score in volume. The challenge was sustaining that offensive output without giving Phoenix additional chances to respond.
Phoenix combined scoring with defensive activity
The Suns did not rely exclusively on offense. They recorded 14 steals, four blocks, and 23 assists.
Green’s 36 points received much of the attention, but Goodwin’s six steals and Booker’s eight assists were also important. One player created a high-volume scoring threat, another disrupted opposing possessions, and another helped organize the attack.
That combination helped Phoenix maintain its lead even after Golden State’s second-quarter surge.
Rebounding was not the deciding weakness
Golden State finished with more rebounds and more offensive rebounds than Phoenix. This means the Warriors did not need to completely rebuild their rebounding approach to address the statistical gap in this game.
The clearest areas for improvement were ball security, perimeter defense, and limiting high-efficiency scoring from Phoenix’s leading shooters.
A useful postgame analysis should prioritize the largest differences in performance rather than assuming that the losing team must have been worse in every category.
How to Read Basketball Player Stats Correctly
A box score becomes much more useful when each statistic is interpreted in context. The following definitions help explain the numbers in this matchup.
- Points (PTS): The total points a player scores through field goals and free throws.
- Rebounds (REB): The number of missed shots recovered by a player, including offensive and defensive rebounds.
- Assists (AST): Passes that directly lead to a made basket under the official statistical rules.
- Steals (STL): Defensive plays in which a player takes possession of or intercepts the ball.
- Blocks (BLK): Defensive deflections of attempted shots that meet the official scoring criteria.
- Turnovers (TO): Possessions lost through errors, violations, or defensive actions.
- Field-goal percentage (FG%): Field goals made divided by field goals attempted.
- Three-point percentage (3P%): Successful three-point shots divided by three-point attempts.
- Plus/minus: The team’s scoring margin while a player is on the court.
For example, Green’s 36 points and 70% field-goal shooting show both his scoring volume and accuracy. Goodwin’s six steals indicate defensive disruption, while Booker’s eight assists show his role in creating scoring opportunities for teammates.
These statistics are most useful when considered together. Points show offensive output, shooting percentages indicate efficiency, and turnovers reveal how well a team protects possessions.
Checking the Original Box Score
For readers who want to verify individual figures, the supplied data identifies ESPN as the source for the game’s box score. The ESPN box score is the relevant reference for reviewing the listed team and player statistics.
When checking any box score, it is worth distinguishing between confirmed figures, derived percentages, and interpretations. For example, the 21-point difference in points from three-pointers can be calculated directly from the 54 points Phoenix scored on made threes and the Warriors’ 33 points from that area. A claim about the exact number of points scored off turnovers, by contrast, requires a separate verified statistic.
This approach keeps analysis grounded in the available evidence rather than relying on assumptions about how individual plays unfolded.
What the Result Means for Both Teams
Phoenix’s 111-96 win reflected a combination of efficient perimeter shooting, disciplined possession management, and defensive pressure. Green’s 36-point performance was the headline, but the Suns also received 20 points and eight assists from Booker and 19 points with six steals from Goodwin.
Golden State had meaningful individual contributions of its own. Podziemski recorded 23 points and 10 rebounds, Curry scored 17, and Melton added 16 points and eight rebounds. The Warriors also finished ahead in total rebounds and made more free throws.
The difference was that Phoenix converted more field goals, made seven additional three-pointers, and committed eight fewer turnovers. Those advantages outweighed Golden State’s rebounding edge and helped the Suns maintain control after the Warriors’ second-quarter response.
For anyone studying basketball performance, this matchup demonstrates why player statistics are best understood as a connected set of measurements. A high scoring total can be impressive, but shooting efficiency, ball security, defense, and team context help explain whether that production translates into a winning result.
Frequently Asked Questions
1. Who won the Golden State Warriors vs Phoenix Suns game on April 18, 2026?
The Phoenix Suns defeated the Golden State Warriors 111-96 in the Western Conference Play-In Tournament’s eighth-seed game. Phoenix established an 18-point lead in the first quarter and maintained its advantage through the final period.
2. Who scored the most points in the game?
Jalen Green led all players with 36 points for Phoenix. He made 14 of 20 field-goal attempts, including eight of 14 three-pointers, and also recorded six rebounds, four assists, two steals, and three blocks.
3. How many points did Stephen Curry score against the Suns?
Stephen Curry scored 17 points. He made four of 16 field-goal attempts, three of 10 three-pointers, and all six of his free throws. He also recorded four rebounds, four assists, two steals, and four turnovers.
4. Which Warriors player recorded a double-double?
Brandin Podziemski recorded a double-double with 23 points and 10 rebounds. He led Golden State in both categories and made nine of 17 field-goal attempts, including three of five three-pointers.
5. Why did Phoenix beat Golden State?
Phoenix benefited from 18 made three-pointers, 14 steals, and only 12 turnovers. Golden State made 11 three-pointers and committed 20 turnovers. The Suns also shot a higher percentage from the field and made all 15 of their free throws.
6. How many assists did Devin Booker record?
Booker recorded eight assists, the highest total among the players in the supplied box score. He also scored 20 points, grabbed six rebounds, and committed just one turnover.
Conclusion
The April 18, 2026, matchup ended with Phoenix defeating Golden State 111-96. Jalen Green’s 36 points led the Suns, while Devin Booker contributed 20 points and eight assists and Jordan Goodwin added 19 points and six steals.
Brandin Podziemski led the Warriors with 23 points and 10 rebounds. Stephen Curry scored 17 points, and De’Anthony Melton provided another 16. Despite these contributions, Golden State struggled with 20 turnovers and made seven fewer three-pointers than Phoenix.
The decisive factors were Phoenix’s perimeter shooting, defensive pressure, and ability to protect possessions. Golden State’s strong second quarter and rebounding advantage were not enough to overcome the Suns’ more consistent performance across the game.
For readers examining basketball statistics, the most useful takeaway is that individual scoring totals must be considered alongside efficiency, turnovers, assists, and defense. Together, these measures provide a clearer explanation of how a game was won and which performances shaped the final result.