Phoenix Suns vs Sacramento Kings Match Player Stats
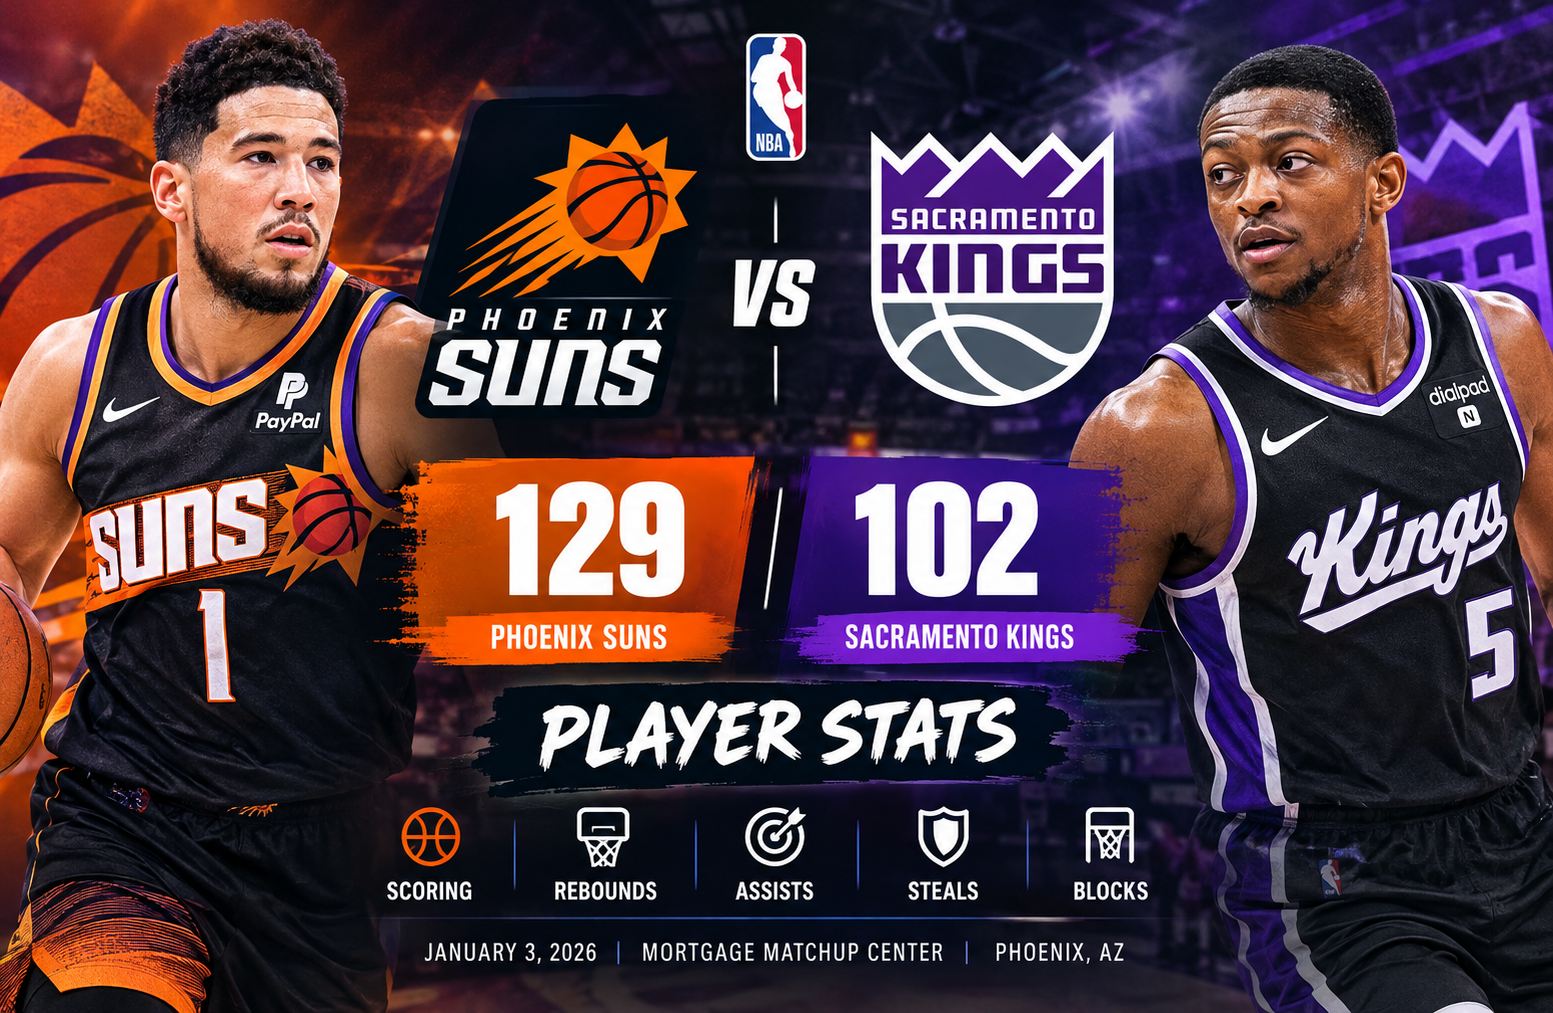
The phoenix suns vs sacramento kings match player stats from January 3, 2026, tell the story of a dominant Phoenix performance at Mortgage Matchup Center in Phoenix, Arizona. The Suns defeated the Kings 129-102, winning by 27 points behind Devin Booker’s 33-point scoring performance, efficient team shooting, and relentless defensive pressure. Phoenix shot 56% from the field, recorded 16 steals, and committed only 12 turnovers, while Sacramento struggled to maintain offensive consistency and gave the ball away 21 times.
This matchup provides a useful look at how shooting efficiency, ball security, defensive activity, and contributions from the supporting cast can shape an NBA game. Sacramento had individual scoring contributions from Keegan Murray and Russell Westbrook, but Phoenix received points from several players and controlled the contest across all four quarters. The final numbers reveal more than the score alone: they explain why the Suns were able to build their advantage and why the Kings could not close the gap.
Game Overview: Phoenix Suns vs Sacramento Kings
The January 3 contest featured two Western Conference teams entering the game with different records and very different outcomes. Phoenix protected its home court, while Sacramento struggled to turn its offensive possessions into enough points to keep pace.
| Game detail | Information |
| Matchup | Phoenix Suns vs Sacramento Kings |
| Date | January 3, 2026 |
| Venue | Mortgage Matchup Center |
| Location | Phoenix, Arizona |
| Attendance | 17,071 |
| Final score | Suns 129, Kings 102 |
| Winning margin | Phoenix by 27 points |
| Suns’ listed record | 20-14 |
| Kings’ listed record | 8-27 |
| Suns’ leading scorer | Devin Booker, 33 points |
| Kings’ leading scorer | Keegan Murray, 23 points |
Phoenix’s performance was built on several complementary strengths. The team converted its field-goal attempts at a high rate, forced Sacramento into mistakes, and received useful scoring contributions beyond its leading scorer. The Kings, meanwhile, struggled with turnovers and could not match Phoenix’s overall offensive efficiency.
The result was a convincing home victory in which Phoenix scored at least 30 points in every quarter. Sacramento managed 29 points in the opening period, but its offense never generated enough momentum to threaten the Suns consistently.
Quarter-by-Quarter Scoring Breakdown
The scoring progression shows how Phoenix gradually separated itself from Sacramento. The Suns did not rely on one explosive quarter. Instead, they maintained a productive offense throughout the game, scoring 32, 30, 35, and 32 points.
Sacramento started reasonably well but could not keep up with Phoenix’s scoring pace as the game progressed.
| Quarter | Phoenix Suns | Sacramento Kings | Suns’ lead at end of quarter |
| First | 32 | 29 | 3 |
| Second | 30 | 27 | 6 |
| Third | 35 | 27 | 14 |
| Fourth | 32 | 19 | 27 |
| Total | 129 | 102 | 27 |
First Quarter: Phoenix Establishes Early Control
Phoenix opened the game with 32 points, while Sacramento scored 29. The three-point difference was small, but it gave the Suns an early advantage and established the scoring pattern that continued throughout the contest.
Sacramento’s 29-point opening quarter showed that the Kings could generate offense. However, scoring at a reasonable rate was not enough when Phoenix was converting its opportunities more efficiently.
The Suns’ ability to score 32 points without needing an unusually high three-point percentage was an early indication of their offensive balance. Phoenix finished the game shooting 56% from the field, a figure that reflects its success on two-point attempts and other field-goal opportunities.
Second Quarter: The Suns Extend Their Advantage
Phoenix added 30 points in the second quarter, compared with Sacramento’s 27. The Suns increased their lead from three points to six by halftime.
A six-point halftime margin is not usually decisive in an NBA game. Sacramento remained close enough to make a comeback possible, but the Kings needed a more effective second-half performance to change the direction of the contest.
The difference between the teams was already visible in the overall statistics. Phoenix finished with 12 turnovers, compared with Sacramento’s 21. Although the final turnover totals cover the entire game, they help explain why the Kings had difficulty sustaining their offense.
Third Quarter: Phoenix Creates Separation
The third quarter was an important turning point. Phoenix scored 35 points and limited Sacramento to 27, increasing its advantage to 14 points.
An eight-point quarter advantage substantially changed the game’s situation. Sacramento now had to overcome a double-digit deficit against a team that was shooting efficiently and generating turnovers.
Phoenix’s defensive pressure was particularly important. The Suns recorded 16 steals over the game, disrupting Sacramento’s possession-by-possession rhythm. Steals can create transition opportunities before the opposing defense is organized, allowing a team to generate easier scoring chances.
The third-quarter scoring difference placed Phoenix in a strong position entering the final period.
Fourth Quarter: The Suns Complete the Victory
Phoenix scored another 32 points in the fourth quarter, while Sacramento managed only 19. The Suns added 13 points to their lead during the final period, turning a competitive first half into a 27-point victory.
The fourth-quarter numbers show that Phoenix did not simply protect its advantage. It continued to score while holding Sacramento to its lowest output of any quarter.
For the Kings, the late scoring decline made a comeback increasingly difficult. For Phoenix, the sustained offense and defensive pressure demonstrated the value of maintaining the same approach even after building a lead.
Phoenix Suns vs Sacramento Kings Match Player Stats
The individual scoring totals identify the players who made the biggest contributions to the result. Devin Booker led all listed scorers with 33 points, while Keegan Murray paced Sacramento with 23.
The following table presents the key player scoring figures available in the supplied ESPN box-score data. It does not assign unprovided rebounds, assists, shooting splits, or minutes to individual players.
| Phoenix Suns player | Points |
| Devin Booker | 33 |
| Dillon Brooks | 18 |
| Mark Williams | 15 |
| Collin Gillespie | 15 |
| Oso Ighodaro | 15 |
| Jamaree Bouyea | 12 |
| Sacramento Kings player | Points |
| Keegan Murray | 23 |
| Russell Westbrook | 17 |
| Malik Monk | 14 |
| DeMar DeRozan | 13 |
| Maxime Raynaud | 6 |
These totals highlight a meaningful difference between the teams. Phoenix had one player score 33 points, another reach 18, three players contribute 15 each, and a further player reach 12. Sacramento also had several contributors, but its leading scorer finished with 10 fewer points than Booker.
The available data supports an analysis of scoring distribution, team efficiency, and defensive performance. More detailed individual statistics should be taken directly from the official ESPN box score for the game.
Devin Booker: Phoenix’s Leading Scorer
Devin Booker scored 33 points to lead Phoenix. His scoring output was the largest individual total in the supplied game data and a central feature of the Suns’ offensive performance.
A 33-point game can influence a matchup in several ways. A leading scorer can punish defensive mismatches, convert difficult half-court possessions, and force opponents to devote additional attention to the perimeter. That attention may also create opportunities for teammates.
Booker’s scoring advantage over Sacramento’s leading scorer was particularly notable. His 33 points exceeded Murray’s 23 by 10, providing Phoenix with a clear advantage at the top of the scoring chart.
However, the team statistics are important context. Phoenix shot 56% from the field and recorded 23 assists. Those figures suggest that the offense was productive beyond the individual scoring total. The available information does not establish Booker’s individual shooting percentage, assist total, or exact shot distribution, so those details should not be assumed.
Dillon Brooks: A Valuable Secondary Scoring Option
Dillon Brooks contributed 18 points for Phoenix, the second-highest total among the Suns players listed in the supplied data.
His 18 points helped reduce the offensive burden on Booker. A team is more difficult to defend when it can generate substantial scoring from multiple players instead of depending on one primary option.
Brooks’ contribution was also part of a broader pattern. Phoenix had five additional players score at least 12 points, including three players who reached 15. That spread gave the Suns several ways to sustain their scoring pace.
The supplied data does not provide Brooks’ individual defensive statistics or shooting splits. His 18 points are therefore the clearest verified measure of his offensive contribution in this matchup.
Mark Williams: Contributing to a Balanced Attack
Mark Williams scored 15 points, tying him with two other Phoenix players for the third-highest scoring total among the listed Suns contributors.
His scoring was useful because Phoenix did not need Booker to produce every important basket. The distribution of points across different players allowed the Suns to maintain offensive output across all four quarters.
Williams’ 15 points should be interpreted as part of the overall team performance rather than as proof of a specific matchup advantage. The supplied figures do not include his rebounds, blocks, shooting percentage, or minutes played, so those individual categories cannot be evaluated accurately from the available information.
Collin Gillespie: Another 15-Point Contributor
Collin Gillespie also finished with 15 points. His contribution reinforced Phoenix’s scoring depth and helped the team maintain a high total without relying exclusively on its leading scorer.
The distinction between a balanced scoring performance and a concentrated one matters when assessing team offense. When multiple players reach double figures, defenses have more potential scoring threats to account for.
Phoenix’s overall 23 assists provide additional context for this distribution, although the available team totals do not establish how many assists Gillespie personally recorded.
Oso Ighodaro: Supporting Phoenix’s Scoring Depth
Oso Ighodaro added another 15 points for the Suns. His total matched those of Williams and Gillespie, giving Phoenix three players with identical 15-point contributions.
This was a meaningful part of the team’s overall scoring profile. Phoenix’s 129 points were not the result of Booker’s output alone. The supporting cast contributed enough scoring to keep the offense productive throughout the contest.
The supplied information does not identify Ighodaro’s field-goal attempts, rebounds, or other individual statistics. A reliable evaluation should distinguish his confirmed scoring contribution from any additional performance claims that would require a full individual box score.
Jamaree Bouyea: Providing 12 Points
Jamaree Bouyea scored 12 points, becoming the sixth Phoenix player in the supplied list to reach double figures.
That contribution added another scoring option to an offense that was already led by Booker and supported by Brooks. Phoenix’s scoring depth was particularly valuable as the team continued to produce 32 points in the fourth quarter.
Bouyea’s total also illustrates why a team-level analysis is useful. Looking only at the leading scorer would miss several contributions that helped Phoenix reach 129 points.
Sacramento Kings Player Performance Analysis
Sacramento had productive individual scoring performances, but the team’s offensive output was not enough to match Phoenix. The Kings scored 102 points, shot 41% from the field, and committed 21 turnovers.
Their leading scorers provided a foundation for the offense, yet the team struggled to turn those individual contributions into a competitive overall result.
Keegan Murray: Sacramento’s Leading Scorer
Keegan Murray led Sacramento with 23 points. His total was the highest among the listed Kings players and placed him second behind Booker among the two teams’ leading scorers.
Murray’s 23 points were a positive individual contribution in a game Sacramento lost by 27. However, scoring output needs to be considered alongside the final margin and the team’s overall performance.
Phoenix had a 56% field-goal percentage, compared with Sacramento’s 41%. That 15-percentage-point difference indicates that the Suns converted field-goal attempts much more successfully as a team.
The available data does not include Murray’s individual shooting percentage or attempts. It would therefore be inaccurate to claim that he was particularly efficient or inefficient based on the team figure alone.
Russell Westbrook: Adding 17 Points
Russell Westbrook contributed 17 points, the second-highest listed total for Sacramento.
His scoring helped the Kings maintain a group of contributors in double figures. Nevertheless, Sacramento needed more consistent production across its possessions to keep up with Phoenix’s 129-point output.
The 21 turnovers were a major team-level concern. Turnovers can eliminate scoring opportunities before a shot is attempted and may give the opposition a chance to score in transition.
The available figures do not establish how many of Sacramento’s turnovers were committed by Westbrook. His individual contribution should be judged using his complete box-score line rather than the team’s turnover total.
Malik Monk: Contributing 14 Points
Malik Monk scored 14 points for Sacramento. His total placed him among the team’s principal scoring contributors, alongside Murray, Westbrook, and DeMar DeRozan.
Monk’s points helped Sacramento reach 102 overall, but the Kings still finished well behind Phoenix. The challenge was not simply finding players who could score. It was maintaining enough efficiency and possession security to keep the total competitive.
Sacramento’s 41% shooting and 21 turnovers indicate two areas that limited the team’s ability to sustain offensive pressure.
DeMar DeRozan: Adding 13 Points
DeMar DeRozan finished with 13 points in the supplied scoring data. His contribution gave Sacramento another double-digit scorer, but it did not offset Phoenix’s stronger shooting performance and defensive disruption.
The Kings’ 20 assists show that the team recorded some successful passing sequences. However, the 21 turnovers were almost as numerous as the assists, an imbalance that helps explain the difficulty of maintaining productive possessions.
This comparison is a team-level indicator rather than an assessment of DeRozan’s individual playmaking. The supplied figures do not establish his personal assist or turnover totals.
Maxime Raynaud: Six Points
Maxime Raynaud scored six points in the supplied data. Although his total was lower than those of Sacramento’s leading contributors, individual scoring totals alone do not establish the full value of a player’s performance.
Rebounds, defense, screening, and other contributions may affect a player’s impact, but the necessary individual figures were not included in the supplied data. A factual review should not infer those contributions without supporting statistics.
Team Statistics Comparison
The team statistics reveal the clearest reasons for Phoenix’s 27-point win. The Suns were more accurate from the field, converted free throws at a higher rate, and recorded substantially more steals. Both teams finished with 42 rebounds, so rebounding volume alone does not explain the difference in the final score.
| Team statistic | Phoenix Suns | Sacramento Kings |
| Points | 129 | 102 |
| Field goals made | 49 | 35 |
| Field goals attempted | 87 | 85 |
| Field-goal percentage | 56% | 41% |
| Three-pointers made | 8 | 10 |
| Three-pointers attempted | 31 | 28 |
| Three-point percentage | 26% | 36% |
| Free throws made | 23 | 22 |
| Free throws attempted | 28 | 32 |
| Free-throw percentage | 82% | 69% |
| Total rebounds | 42 | 42 |
| Offensive rebounds | 7 | 14 |
| Defensive rebounds | 35 | 28 |
| Assists | 23 | 20 |
| Turnovers | 12 | 21 |
| Steals | 16 | 6 |
| Blocks | 9 | 3 |
| Personal fouls | 23 | 23 |
Field-Goal Efficiency: Phoenix’s Biggest Statistical Advantage
Phoenix made 49 of 87 field-goal attempts, while Sacramento converted 35 of 85.
That means the Suns made 14 more field goals despite attempting only two more shots. Their reported field-goal percentage was 56%, compared with 41% for the Kings.
The difference is substantial. A team that converts a greater share of its attempts can score more points without needing a much higher volume of shots. Phoenix’s field-goal efficiency helped it establish and extend its advantage.
The shooting percentages also explain why Sacramento’s three-point accuracy did not translate into a victory. Although the Kings made a higher percentage of their three-pointers, their overall field-goal conversion rate was considerably lower.
Three-Point Shooting: Sacramento Had the Higher Percentage
Sacramento made 10 of 28 three-point attempts, a reported success rate of 36%. Phoenix made eight of 31, shooting 26%.
The Kings therefore made two more three-pointers and had the better perimeter percentage. Yet they still lost by 27 points.
This is an important distinction when reading basketball statistics. Three-point shooting is only one component of offensive performance. Field goals inside the arc, free throws, turnovers, and the number of possessions also affect the final score.
Phoenix’s overall shooting advantage was strong enough to overcome Sacramento’s edge from beyond the arc. The Suns made 49 field goals in total, compared with 35 for the Kings, demonstrating how much their performance on other field-goal attempts mattered.
Free Throws: Phoenix Converted More Reliably
The Suns made 23 of 28 free throws, shooting 82%. Sacramento made 22 of 32, shooting 69%.
Phoenix attempted four fewer free throws but made one more. The difference in conversion rate gave the Suns a modest scoring advantage from the line.
Free throws are particularly valuable because they provide scoring opportunities without requiring a field-goal attempt. Consistent conversion also prevents teams from leaving points behind during otherwise productive offensive stretches.
The free-throw difference was not the main reason for the final margin, but it complemented Phoenix’s superior field-goal shooting.
Rebounding: Equal Totals, Different Distribution
Both teams collected 42 rebounds, but the distribution differed.
Sacramento recorded 14 offensive rebounds and 28 defensive rebounds. Phoenix recorded seven offensive rebounds and 35 defensive rebounds.
The Kings’ offensive-rebound total was twice Phoenix’s. That suggests Sacramento created more opportunities to recover its own missed shots, potentially extending possessions.
Phoenix, however, recorded seven more defensive rebounds. The Suns’ ability to secure defensive boards helped them finish possessions and limited Sacramento’s opportunities to score from additional attempts.
Equal total rebounds do not necessarily mean that two teams controlled the glass in the same way. Offensive and defensive rebounds serve different purposes, so separating them provides a more useful understanding of how possessions developed.
Assists: Phoenix Shared the Ball More Often
Phoenix recorded 23 assists, while Sacramento finished with 20.
The difference was not enormous, but it complemented the Suns’ superior field-goal percentage. Assists can reflect successful passing that creates scoring opportunities for teammates, although the total alone does not reveal the quality of every possession.
Phoenix’s combination of 23 assists and 49 made field goals indicates that the team generated a productive overall scoring performance. Sacramento’s 20 assists were a respectable total, but they came alongside a lower field-goal percentage and more turnovers.
Turnovers: Nine Extra Mistakes Hurt Sacramento
Turnovers were one of the most revealing statistics in the game. Phoenix committed 12, while Sacramento committed 21.
The nine-turnover difference represents nine additional possessions that Sacramento failed to complete with a shot attempt or a trip to the free-throw line, depending on the specific sequence. Some turnovers may also create immediate transition chances for the opposing team.
Phoenix recorded 16 steals, compared with Sacramento’s six. The combination of more steals and fewer turnovers points to a major advantage in ball security and defensive disruption.
It would be incorrect to assume that every Kings turnover resulted in a Suns basket. Nevertheless, the disparity shows that Sacramento had far more difficulty protecting the ball.
Steals and Blocks: Phoenix Disrupted Sacramento’s Offense
Phoenix recorded 16 steals and nine blocks. Sacramento registered six steals and three blocks.
The Suns therefore finished with 10 more steals and six more blocks. These differences reflect substantial defensive activity across the game.
Steals can interrupt offensive sets and create opportunities before defenders are positioned. Blocks can alter shot selection and prevent attempts from reaching the basket. Neither statistic captures every aspect of defense, but both help illustrate Phoenix’s activity around the ball and the rim.
Combined with Sacramento’s 21 turnovers, Phoenix’s defensive numbers support the conclusion that pressure on the Kings’ offense was a significant part of the victory.
Why the Phoenix Suns Won by 27 Points
Phoenix’s victory came from the combination of efficient shooting, defensive activity, and a broad scoring contribution. No single statistic explains the entire result, but several numbers reinforce one another.
1. The Suns Converted More Field-Goal Attempts
Phoenix made 49 field goals on 87 attempts, while Sacramento made 35 on 85 attempts. The Suns’ 14-field-goal advantage was the most direct statistical explanation for their scoring lead.
The difference is especially meaningful because the teams attempted nearly the same number of shots. Phoenix did not need a substantially higher volume of attempts to create its advantage. It converted a much greater proportion of the opportunities it received.
2. Phoenix Protected the Ball Better
The Suns committed 12 turnovers, nine fewer than Sacramento’s 21. Every additional turnover can remove an opportunity to score, and turnovers that lead to transition possessions may create favorable chances for the opposing team.
Sacramento’s turnover total was particularly damaging because the Kings were already shooting less efficiently. When a team struggles to convert shots and also loses possessions before attempting them, its ability to keep pace becomes much more difficult.
3. Defensive Pressure Created Problems for Sacramento
Phoenix’s 16 steals compared with Sacramento’s six indicate a clear difference in defensive disruption. The Suns also recorded nine blocks.
These numbers should not be treated as a complete measure of defensive quality, since positioning, communication, and contested shots are not fully captured by box-score statistics. Still, they provide strong evidence that Phoenix was active in disrupting Sacramento’s possessions.
4. Multiple Suns Contributed to the Scoring Total
Booker’s 33 points led the team, but Brooks scored 18, Williams, Gillespie, and Ighodaro each added 15, and Bouyea contributed 12.
That distribution made Phoenix’s offense less dependent on one player. Even with Booker leading the way, the supporting cast provided enough points to sustain the team’s scoring pace.
5. Phoenix Maintained Its Advantage in Every Quarter
The Suns outscored Sacramento in all four periods. Their largest quarter-to-quarter gains came in the third and fourth quarters, when they outscored the Kings by eight and 13 points, respectively.
A team that continues scoring after taking a lead can prevent an opponent from building momentum. Phoenix’s 32-point fourth quarter ensured that Sacramento had little opportunity to reduce the margin.
What Sacramento Could Have Done Differently
The final score points to several areas where Sacramento could have improved. These are conclusions drawn from the team statistics, not claims about specific coaching instructions or unreported plays.
Reduce Unforced Turnovers
Sacramento’s 21 turnovers were a significant problem. Improving passing decisions, maintaining spacing, and avoiding unnecessary risks would help preserve more possessions.
A useful way to evaluate progress would be to compare turnovers with total possessions over several games rather than focusing on one box score. That would show whether the problem was a one-game issue or part of a broader pattern.
Improve Overall Field-Goal Efficiency
The Kings shot 41% from the field, compared with Phoenix’s 56%. Although Sacramento shot 36% from three-point range, its overall shooting efficiency remained well below the Suns’ level.
The important lesson is that strong perimeter shooting cannot always compensate for lower conversion rates elsewhere. Teams need a balanced approach that creates good opportunities from different areas of the court.
Convert Free Throws More Consistently
Sacramento made 22 of 32 free throws, leaving 10 attempts unsuccessful. Phoenix made 23 of 28.
Improving free-throw accuracy would not necessarily have changed the outcome, given the 27-point final margin, but it would have allowed Sacramento to extract more value from the opportunities it earned.
Maintain Defensive Resistance Throughout the Game
Phoenix scored at least 30 points in every quarter. Sacramento’s defense was unable to keep the Suns below that threshold in any period.
Limiting efficient field-goal opportunities, communicating through screens, and contesting shots without giving away unnecessary fouls are common ways teams try to reduce an opponent’s scoring. The available statistics do not identify which defensive adjustment would have been most effective in this particular matchup, but Phoenix’s consistent scoring makes defensive efficiency an important area to examine.
Tactical Analysis: What the Numbers Tell Us
The box score offers a useful framework for understanding how the Suns controlled the game. Looking at several statistics together provides more insight than treating every number as an isolated achievement.
Shooting Efficiency and Possession Value
Phoenix’s 56% field-goal percentage was a major advantage, particularly because both teams attempted a similar number of shots. The Suns converted more attempts and finished with 129 points.
Sacramento’s higher three-point percentage is a reminder that individual categories can be misleading when viewed alone. The Kings were more accurate from long range, but their overall field-goal percentage was lower and their turnover total was much higher.
A sound statistical analysis should therefore consider shooting accuracy, shot volume, free throws, and turnovers together.
Defensive Activity and Offensive Opportunities
The difference between 16 Suns steals and six Kings steals deserves attention. Steals can create opportunities to attack before the defense is set, although the supplied data does not identify the exact number of transition points either team scored.
Phoenix’s nine blocks also suggest that the Suns affected Sacramento’s attempts near the basket. A complete defensive evaluation would require additional details, such as opponent shot locations and individual defensive assignments, but the available figures clearly favor Phoenix in steals and blocks.
Rebounding Was Not the Main Difference
Both teams collected 42 rebounds, so total rebounding volume cannot explain the 27-point margin on its own.
Sacramento had more offensive rebounds, 14 to seven. Phoenix had more defensive rebounds, 35 to 28. This difference suggests that the teams recovered different types of missed shots at different rates.
Offensive rebounds can generate second-chance opportunities, while defensive rebounds help end an opponent’s possession. The Kings’ offensive-rebound advantage did not overcome their shooting and turnover disadvantages.
Scoring Depth Reduced Phoenix’s Dependence on One Player
Booker’s 33 points were central to Phoenix’s offensive output, but five other listed Suns scored at least 12 points.
That depth gave Phoenix multiple sources of production. It also meant that the team could maintain a high scoring total without needing Booker to account for nearly every successful possession.
The Kings had four listed players in double figures, led by Murray’s 23 points. Their contributors produced useful individual totals, but the team’s collective efficiency was not strong enough to challenge Phoenix.
Season Series Context
The supplied game data lists Phoenix as leading the season series 3-0 following the January 3 matchup. The three listed results through that date were:
| Date | Phoenix Suns | Sacramento Kings |
| October 23 | 120 | 116 |
| November 27 | 112 | 100 |
| January 3 | 129 | 102 |
Phoenix won each of these three matchups, with the margin increasing to 27 points in the January contest.
The supplied data also lists a March 4 result of Phoenix 114, Sacramento 103. Because that game occurred after January 3, it should be treated separately when describing the season series as it stood on the date covered by this article.
The progression through January suggests that Phoenix had consistently found ways to defeat Sacramento in the listed meetings. However, three results alone do not establish that the teams would perform the same way in every future matchup. Rosters, player availability, tactics, and shooting performance can change from game to game.
How to Interpret These NBA Player Statistics
Readers often look at a box score to identify the leading scorer, compare players, or understand why one team won. The most useful approach is to combine individual scoring figures with team-level performance indicators.
Start With the Final Score and Quarter Totals
The final score establishes the outcome, while quarter totals show when the margin changed. In this game, Phoenix led by three after the first quarter, six at halftime, 14 after the third, and 27 at the end.
This progression shows that the Suns gradually extended their lead rather than relying on one isolated scoring burst.
Compare Individual Scoring With Team Efficiency
Booker’s 33 points and Murray’s 23 provide a quick comparison of the leading scorers. However, those totals do not explain how efficiently each team generated points.
Phoenix’s 56% field-goal percentage, compared with Sacramento’s 41%, adds important context. A full individual comparison would also require each player’s attempts, shooting percentages, rebounds, assists, turnovers, and minutes.
Look for Multiple Supporting Indicators
Turnovers, assists, rebounds, steals, blocks, and free throws help explain the final score. Phoenix’s 12 turnovers and 16 steals, compared with Sacramento’s 21 turnovers and six steals, are especially informative.
No single statistic should be used to judge a player’s entire performance. The strongest analysis connects the numbers to the outcome while being clear about what the available data does and does not establish.
Distinguish Confirmed Figures From Interpretation
The final score, team shooting totals, and listed player points are numerical facts from the supplied game data. Explanations about how turnovers may affect offensive opportunities are interpretations based on basketball principles.
Keeping those two categories separate makes a sports analysis more trustworthy. It prevents reasonable tactical observations from being presented as though they were verified play-by-play events.
Frequently Asked Questions
1. What was the final score of the Phoenix Suns vs Sacramento Kings game on January 3, 2026?
The Phoenix Suns defeated the Sacramento Kings 129-102 at Mortgage Matchup Center in Phoenix, Arizona. Phoenix won by 27 points.
2. Who scored the most points in the game?
Devin Booker led all listed scorers with 33 points for Phoenix. Keegan Murray was Sacramento’s leading scorer with 23 points.
3. Which team shot better from the field?
Phoenix shot 56% from the field, making 49 of 87 attempts. Sacramento shot 41%, making 35 of 85 attempts. The Suns held a substantial advantage in overall field-goal efficiency.
4. How many three-pointers did each team make?
Sacramento made 10 of 28 three-point attempts, shooting 36%. Phoenix made eight of 31 attempts, shooting 26%. Despite Sacramento’s advantage from three-point range, the Kings lost by 27 points.
5. Which team committed more turnovers?
Sacramento committed 21 turnovers, compared with Phoenix’s 12. The nine-turnover difference, combined with Phoenix’s 16 steals, highlights the Suns’ advantage in defensive disruption and ball security.
6. Which Phoenix players scored at least 15 points?
Devin Booker scored 33 points, Dillon Brooks added 18, and Mark Williams, Collin Gillespie, and Oso Ighodaro each scored 15. Jamaree Bouyea contributed another 12 points.
Conclusion
The phoenix suns vs sacramento kings match player stats show why Phoenix earned its 129-102 victory on January 3, 2026. Devin Booker led the Suns with 33 points, while Dillon Brooks, Mark Williams, Collin Gillespie, Oso Ighodaro, and Jamaree Bouyea provided valuable additional scoring.
The team’s 56% field-goal percentage, 16 steals, and 12 turnovers compared favorably with Sacramento’s 41% shooting, six steals, and 21 turnovers. Although the Kings made more three-pointers and collected more offensive rebounds, those advantages were not enough to offset Phoenix’s overall efficiency.
The quarter-by-quarter results also demonstrate how the margin developed. Phoenix led by three at the end of the first quarter, extended its advantage through the third, and outscored Sacramento 32-19 in the fourth. The result was a 27-point win supported by efficient shooting, defensive pressure, and contributions from multiple players.
For readers evaluating NBA performances, the central lesson is to look beyond the leading scorer. Individual points matter, but field-goal efficiency, turnovers, assists, defensive statistics, and quarter-by-quarter scoring provide a more complete explanation of a game’s outcome.