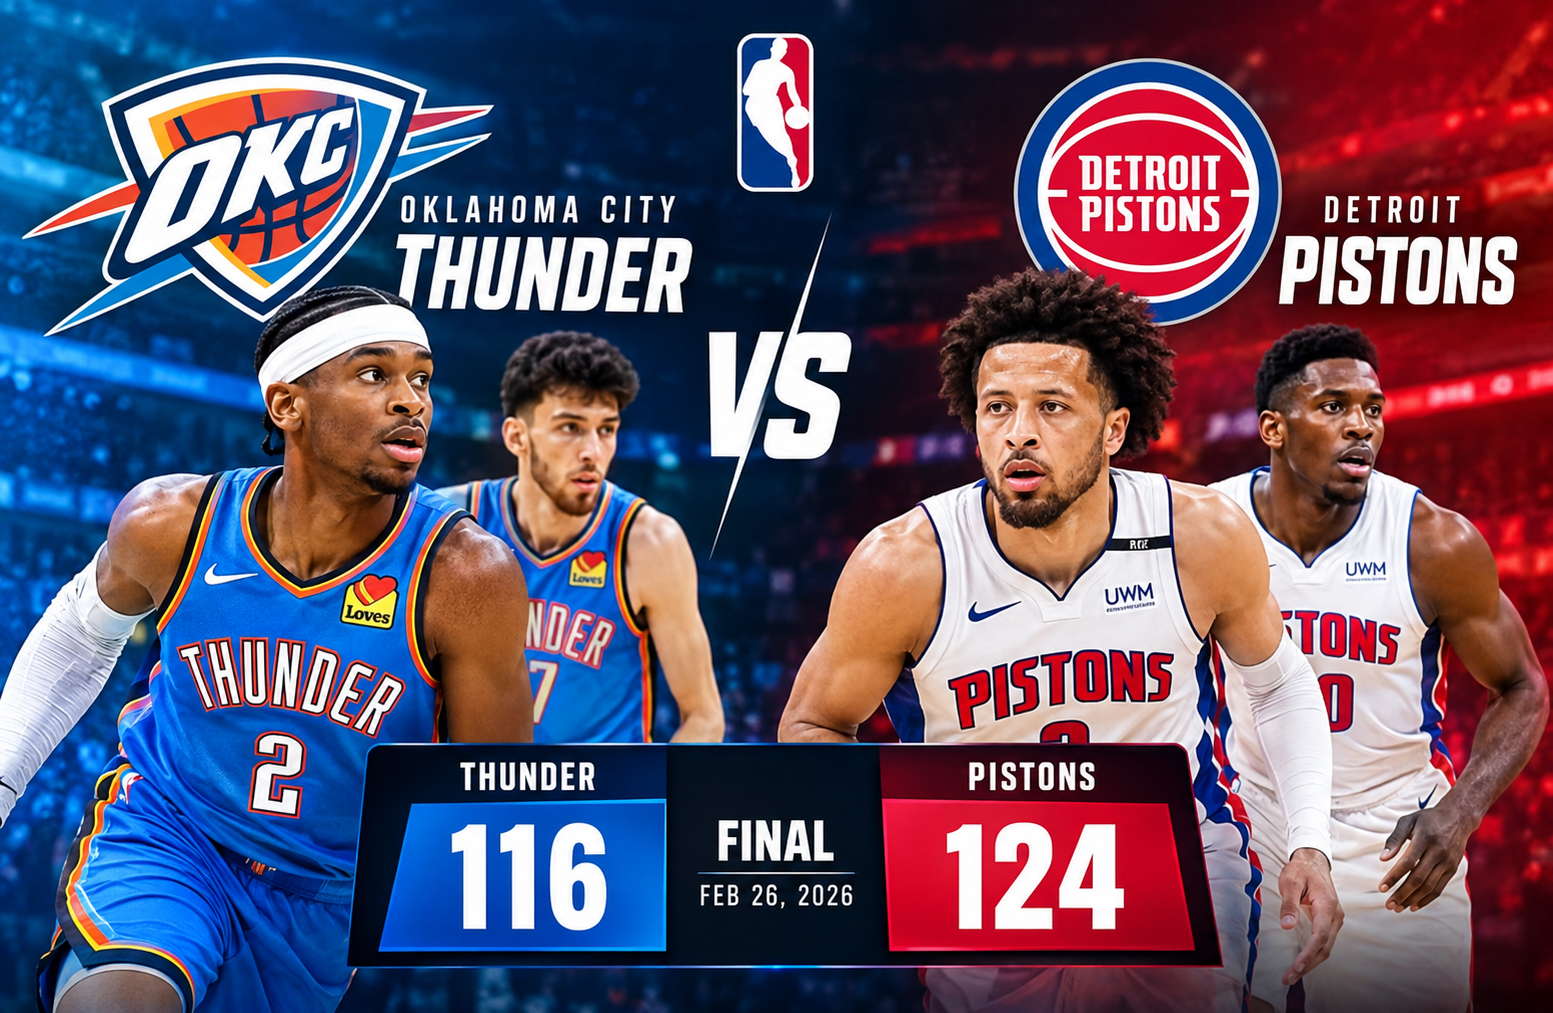
Oklahoma City Thunder vs Detroit Pistons Match Player Stats
The oklahoma city thunder vs detroit pistons match player stats from February 26, 2026, reveal how Detroit turned an early deficit into a 124-116 victory at Little Caesars Arena in Detroit, Michigan. Oklahoma City opened strongly, scoring 34 points in the first quarter, but the Pistons responded with a dominant second and third quarter to take control of the game. Jalen Duren and Cade Cunningham led Detroit with 29 points each, while Jaylin Williams paced the Thunder with 30 points. Detroit’s advantages in rebounding, interior defense, and overall shooting efficiency proved decisive in a contest between two of the NBA’s leading teams.
Match overview
| Match detail | Information |
| Game | Detroit Pistons vs. Oklahoma City Thunder |
| Date | February 26, 2026 |
| Final score | Detroit Pistons 124, Oklahoma City Thunder 116 |
| Venue | Little Caesars Arena |
| Location | Detroit, Michigan |
| Attendance | 20,062 |
| Game status | Final |
| Thunder record shown | 45-15 |
| Pistons record shown | 43-14 |
| Thunder leading scorer | Jaylin Williams, 30 points |
| Pistons leading scorers | Cade Cunningham and Jalen Duren, 29 points each |
| Biggest statistical advantage | Detroit’s 52-37 rebounding edge |
Game Summary: How Detroit Defeated Oklahoma City
Detroit’s 124-116 win was built on a powerful response after Oklahoma City controlled the opening quarter. The Thunder scored 34 points in the first period while holding Detroit to 22, creating a 12-point advantage. At that stage, Oklahoma City appeared to have established the pace it wanted.
The game changed in the second quarter. Detroit scored 36 points while limiting the Thunder to 18, completely erasing the early deficit. The Pistons carried that momentum into the third quarter, adding another 36 points while Oklahoma City scored 28. That stretch gave Detroit the separation it needed heading into the final period.
Oklahoma City scored 36 points in the fourth quarter and attempted to mount a late comeback. Detroit, however, answered with 30 points of its own and maintained its lead through the finish.
The final score tells only part of the story. Detroit shot 54% from the field, collected 15 more rebounds than Oklahoma City, and recorded four times as many blocks. Those advantages helped offset the Thunder’s better three-point percentage and exceptional free-throw accuracy.
Oklahoma City Thunder vs Detroit Pistons Match Player Stats: Quarter-by-Quarter Breakdown
The quarter-by-quarter scoring pattern explains why Detroit won despite Oklahoma City’s excellent start. The Pistons did not need to dominate every period. Instead, they responded when the game began to move away from them and built a lead through sustained offensive production.
| Quarter | Oklahoma City Thunder | Detroit Pistons | Quarter winner |
| First quarter | 34 | 22 | Oklahoma City |
| Second quarter | 18 | 36 | Detroit |
| Third quarter | 28 | 36 | Detroit |
| Fourth quarter | 36 | 30 | Oklahoma City |
| Final score | 116 | 124 | Detroit |
First Quarter: Oklahoma City Starts Strong
Oklahoma City scored 34 points in the opening quarter, compared with Detroit’s 22. The 12-point margin gave the visitors a promising start and demonstrated their ability to generate offense early.
The Thunder ultimately finished with 18 made three-pointers, and perimeter shooting was an important part of their scoring profile. Their opening-period advantage showed how dangerous they could be when they established an offensive rhythm.
Detroit, meanwhile, needed to improve its defensive execution and find more reliable scoring opportunities. The Pistons were not yet matching Oklahoma City’s output, but the deficit was manageable with three quarters remaining.
Second Quarter: Detroit Changes the Game
The second quarter was the decisive turning point. Detroit scored 36 points and restricted Oklahoma City to 18, producing a 18-point quarter differential in the Pistons’ favor.
That scoring swing erased the Thunder’s 12-point lead and left Detroit six points ahead at halftime.
The change illustrates an important lesson when evaluating basketball performances: an effective response matters more than a strong opening alone. Detroit increased its offensive production while making Oklahoma City’s scoring much more difficult.
The Pistons’ eventual 54% field-goal percentage and 52 total rebounds are consistent with the statistical profile of a team that found better opportunities and created additional possessions over the course of the game.
Third Quarter: Detroit Extends Its Advantage
Detroit continued its momentum after halftime, scoring 36 points for the second consecutive quarter. Oklahoma City scored 28, allowing the Pistons to extend their lead from six points to 14.
This period mattered because it prevented the Thunder from immediately recovering after their difficult second quarter. Detroit maintained offensive pressure while building on its advantages in rebounding and rim protection.
The Pistons finished with 12 blocks, compared with Oklahoma City’s three. Although the supplied box-score data does not assign every block to a specific quarter, that four-to-one difference highlights Detroit’s overall impact around the basket.
Fourth Quarter: Thunder Fight Back, Pistons Hold On
Oklahoma City scored 36 points in the final quarter, six more than Detroit. The Thunder improved their offensive output and narrowed the gap, but the comeback was not enough to reverse the result.
Detroit’s 14-point advantage entering the fourth quarter provided valuable breathing room. Even though the Thunder finished strongly, the Pistons continued to score and closed out the eight-point victory.
The final period also demonstrates why game analysis should consider the full scoring sequence. Oklahoma City’s late offensive improvement was real, but Detroit’s work in the second and third quarters had already established a difficult deficit to overcome.
Detroit Pistons Player Stats and Individual Performances
Detroit’s leading performers combined efficient scoring, rebounding, and playmaking. Cade Cunningham directed the offense, while Jalen Duren provided a productive interior presence. Their complementary contributions helped Detroit overcome its early deficit.
Cade Cunningham: 29 Points and 13 Assists
Cade Cunningham delivered one of the most complete performances of the game. He finished with 29 points and 13 assists, connecting individual scoring with the creation of opportunities for teammates.
His reported shooting numbers were especially efficient:
| Statistic | Cade Cunningham |
| Points | 29 |
| Field goals | 11/16 |
| Field-goal percentage | 68.8% |
| Three-pointers | 3/5 |
| Three-point percentage | 60.0% |
| Free throws | 4/4 |
| Free-throw percentage | 100% |
| Assists | 13 |
| Steals | 3 |
| Blocks | 3 |
Cunningham made 11 of 16 field-goal attempts, a rate of approximately 68.8%. He also converted three of five three-pointers and all four free throws.
His 13 assists were equally important. Assists reflect a player’s ability to create scoring opportunities for teammates rather than relying entirely on individual shot-making. Cunningham’s total indicates that he contributed significantly to Detroit’s offensive organization.
His three steals and three blocks also stand out in the supplied data. These numbers show defensive activity across multiple areas, although a box score alone cannot establish how much each play changed the outcome.
Why Cunningham’s performance mattered: Detroit needed a reliable offensive organizer after falling behind in the first quarter. Cunningham supplied efficient scoring and playmaking, helping the team sustain its attack through the middle periods.
Jalen Duren: 29 Points and 15 Rebounds
Jalen Duren matched Cunningham’s 29 points and led all players in the supplied statistics with 15 rebounds. His performance gave Detroit a major presence near the basket at both ends of the floor.
| Statistic | Jalen Duren |
| Points | 29 |
| Field goals | 12/17 |
| Field-goal percentage | 70.6% |
| Free throws | 5/7 |
| Free-throw percentage | 71.4% |
| Total rebounds | 15 |
| Offensive rebounds | 5 |
| Defensive rebounds | 10 |
Duren made 12 of 17 field-goal attempts, an excellent 70.6% conversion rate. His five offensive rebounds were particularly valuable because offensive boards can give a team another opportunity to score after a missed shot.
His 10 defensive rebounds helped Detroit finish defensive possessions and reduce Oklahoma City’s chances to recover missed attempts.
Duren’s 15 rebounds also contributed to the Pistons’ overall advantage on the glass. Detroit finished with 52 rebounds, while the Thunder collected 37.
That 15-rebound team difference is one of the clearest statistical explanations for the result. It suggests that Detroit consistently competed for the ball and created additional opportunities through its work on the boards.
Duncan Robinson: 16 Points
Duncan Robinson contributed 16 points to Detroit’s winning effort. His scoring provided valuable support behind Cunningham and Duren.
Robinson’s total was particularly useful because Detroit did not rely on its two leading scorers alone. Contributions from additional players can make an offense harder to defend by reducing the burden on its primary creators.
The supplied data does not include Robinson’s complete shooting breakdown, so his field-goal percentage and three-point conversion rate should not be inferred from his point total.
Ausar Thompson: 11 Points
Ausar Thompson finished with 11 points, giving Detroit another double-digit scorer. His contribution helped the Pistons spread their offensive production beyond the leading pair.
In a game where Detroit recorded 29 assists as a team, contributions from multiple scoring options helped translate offensive possessions into points.
The available figures do not provide Thompson’s full shooting line, rebounds, assists, or defensive statistics, so those details cannot be reliably stated here.
Caris LeVert: 9 Points
Caris LeVert scored nine points. While his total was below the team’s leading scorers, secondary scoring can still matter in a contest decided by a series of productive possessions.
Detroit’s ability to combine its leading scorers with contributions from supporting players helped produce 124 points overall.
Paul Reed: 8 Points
Paul Reed recorded eight points. His contribution added to Detroit’s offensive depth, although the supplied information does not include enough detail to evaluate his individual efficiency or defensive impact.
Ronald Holland II: 8 Points
Ronald Holland II also finished with eight points. His scoring helped Detroit draw contributions from several members of the rotation.
Javonte Green: 6 Points
Javonte Green contributed six points. His total formed part of Detroit’s broader scoring distribution rather than placing the entire offensive burden on two players.
Daniss Jenkins: 4 Points
Daniss Jenkins recorded four points in the supplied statistics. His contribution added to the team’s overall scoring total.
Tobias Harris: 4 Points
Tobias Harris finished with four points. That total was relatively modest compared with Detroit’s leading scorers, but individual points should be assessed within the wider team performance rather than treated as a complete measure of a player’s value.
Kevin Huerter: 0 Points
Kevin Huerter recorded zero points in the supplied data. A zero-point total does not necessarily establish that a player had no impact, but the available information does not provide enough evidence to quantify any other contribution in this matchup.
Detroit’s Starting Lineup
The supplied starting lineup for Detroit included:
- Tobias Harris
- Duncan Robinson
- Jalen Duren
- Cade Cunningham
- Ausar Thompson
Cunningham and Duren provided the largest individual scoring totals among the listed Pistons. Robinson added 16 points, and Thompson contributed 11.
The starting lineup information helps identify the players listed as starters, but the available data does not include complete minutes played or a full individual box score for every participant. Those figures should be checked against the official game record before making more detailed lineup comparisons.
Oklahoma City Thunder Player Stats and Individual Performances
Oklahoma City finished with 116 points despite losing the rebounding and rim-protection battles. Jaylin Williams led the Thunder with 30 points, while Cason Wallace and Aaron Wiggins provided additional scoring support.
The Thunder’s offense had several strengths, including 18 made three-pointers and 95% free-throw shooting. However, those advantages were not enough to offset Detroit’s superior field-goal percentage and interior production.
Jaylin Williams: 30 Points
Jaylin Williams led all Oklahoma City players in scoring with 30 points, one more than either of Detroit’s leading scorers.
His performance was a major reason the Thunder remained competitive after their second-quarter collapse. Reaching 30 points in a losing effort demonstrates substantial individual scoring production, but the team result shows that scoring alone did not solve Oklahoma City’s defensive and rebounding problems.
The supplied statistics do not provide Williams’s complete field-goal attempts, three-point makes, rebounds, or assists. It would therefore be misleading to calculate his shooting efficiency or describe the exact distribution of his scoring without a full individual box score.
Cason Wallace: 23 Points
Cason Wallace scored 23 points, making him Oklahoma City’s second-leading scorer in the supplied data.
Wallace’s contribution was important because it gave the Thunder another substantial scoring option alongside Williams. Teams generally benefit when more than one player can generate meaningful offense, particularly when an opponent is attempting to limit the primary scoring threat.
However, the available numbers do not establish Wallace’s shooting efficiency, defensive statistics, or individual turnover total. His 23 points are confirmed in the supplied game data, while more detailed assessments would require additional verified statistics.
Aaron Wiggins: 20 Points
Aaron Wiggins added 20 points, giving Oklahoma City three players with at least 20 points.
That distribution is a notable feature of the Thunder’s performance. Williams, Wallace, and Wiggins combined for 73 points, accounting for a substantial portion of Oklahoma City’s 116-point total.
The combined scoring indicates that the Thunder received meaningful production from multiple players. It also reinforces the central finding of this game: Oklahoma City had enough scoring to remain competitive, but Detroit was more effective at converting possessions and controlling the interior.
Oklahoma City’s Starting Lineup
The supplied starting lineup for Oklahoma City included:
- Jaylin Williams
- Isaiah Joe
- Luguentz Dort
- Aaron Wiggins
- Cason Wallace
Williams, Wiggins, and Wallace supplied the three leading scoring totals listed for the Thunder. Isaiah Joe and Luguentz Dort were also included among the starters, although their individual point totals are not specified in the supplied statistics.
The lineup data should be treated as the information recorded for this particular game, not as a statement about Oklahoma City’s regular starting lineup across the season.
Thunder Player Availability
The supplied game information mentions one Oklahoma City player listed as inactive because of a sprained left ankle. However, the player is not clearly identified in the available text.
Because the identity is uncertain, it would be inappropriate to name a player or claim that the injury directly caused the defeat. Injury analysis should distinguish confirmed availability information from speculation about its effect on the result.
Team Statistical Comparison: Thunder vs Pistons
The team statistics provide the clearest explanation for Detroit’s victory. Oklahoma City was more accurate from three-point range and at the free-throw line, but Detroit made more shots overall, dominated the boards, and protected the rim more effectively.
| Team statistic | Oklahoma City Thunder | Detroit Pistons |
| Points | 116 | 124 |
| Field goals made/attempted | 39/96 | 48/89 |
| Field-goal percentage | 41% | 54% |
| Three-pointers made/attempted | 18/49 | 9/27 |
| Three-point percentage | 37% | 33% |
| Free throws made/attempted | 20/21 | 19/26 |
| Free-throw percentage | 95% | 73% |
| Total rebounds | 37 | 52 |
| Offensive rebounds | 12 | 16 |
| Defensive rebounds | 25 | 36 |
| Assists | 28 | 29 |
| Turnovers | 13 | 15 |
| Steals | 7 | 9 |
| Blocks | 3 | 12 |
| Personal fouls | 20 | 21 |
Percentages are presented as supplied in the game data. Calculations below use the recorded made and attempted totals.
Field-Goal Efficiency: Detroit’s Biggest Offensive Advantage
Detroit made 48 of 89 field-goal attempts, while Oklahoma City made 39 of 96.
That represents nine more made field goals for Detroit despite seven fewer attempts. The difference in shooting efficiency was substantial: Detroit finished at approximately 54.0%, while the Thunder converted approximately 40.6% of their attempts.
This matters because field-goal efficiency measures how successfully a team converts its opportunities into points. A team can generate a large number of attempts and still lose if too many possessions end without a successful shot.
Detroit’s advantage was especially impressive because the Pistons did not need to make more three-pointers to win. Their stronger overall conversion rate allowed them to score consistently across their available field-goal opportunities.
For readers analyzing future games, comparing both attempts and makes is more informative than looking at the final point totals alone.
Three-Point Shooting: Oklahoma City Had the Edge
Oklahoma City made 18 of 49 three-point attempts, compared with Detroit’s nine makes on 27 attempts.
The Thunder therefore made nine more three-pointers, which is a meaningful offensive advantage. Their reported three-point percentage of 37% also exceeded Detroit’s 33%.
Three-pointers are worth three points, so a team can offset disadvantages in other areas by converting enough shots from beyond the arc. Oklahoma City demonstrated that potential in this game.
However, the Thunder’s volume also deserves attention. They attempted 49 three-pointers, compared with Detroit’s 27. The larger number of attempts created opportunities for high-value scoring but did not guarantee efficient offense across all shot types.
Detroit compensated by making nine more field goals overall. This is why three-point totals must be interpreted alongside two-point production, total field-goal efficiency, and possession outcomes.
Free-Throw Shooting: Oklahoma City Was More Accurate
The Thunder made 20 of 21 free throws, an outstanding conversion rate of approximately 95.2%. Detroit made 19 of 26, converting approximately 73.1%.
Oklahoma City was more accurate and missed only one free throw. Detroit missed seven.
Despite that difference, the Thunder gained only one additional point from free throws because Detroit attempted five more shots from the line. This is an important distinction between accuracy and total production.
The Thunder’s performance at the line was a clear strength, but it could not compensate for Detroit’s advantages in field goals and rebounds.
Rebounding: Detroit Controlled the Glass
Detroit collected 52 rebounds, compared with Oklahoma City’s 37. The 15-rebound difference was one of the game’s most important statistical gaps.
The breakdown shows that Detroit led in both major rebounding categories:
- Offensive rebounds: Detroit 16, Oklahoma City 12.
- Defensive rebounds: Detroit 36, Oklahoma City 25.
Offensive rebounds can create second-chance scoring opportunities. Defensive rebounds help end an opponent’s possession and prevent additional attempts after missed shots.
Detroit’s advantage in both categories suggests that the Pistons were more successful at controlling the ball after missed field goals. Duren’s 15 rebounds, including five offensive boards, were central to that overall team performance.
Rebounding does not automatically translate into a victory, but a difference this large can influence shot volume, possession control, and the opponent’s ability to build momentum.
Assists: Both Teams Shared the Ball
Detroit recorded 29 assists, while Oklahoma City finished with 28. The one-assist difference indicates that both teams generated a substantial amount of assisted scoring.
Cunningham’s 13 assists were especially notable. His individual playmaking represented a significant contribution to Detroit’s total and helped connect his scoring with the team’s wider offense.
The team totals alone cannot establish which side generated better-quality passes or more effective movement on every possession. However, they confirm that Detroit’s victory was not simply the product of individual scoring. The Pistons also produced slightly more assists overall.
Turnovers: Oklahoma City Took Better Care of the Ball
Oklahoma City committed 13 turnovers, two fewer than Detroit’s 15.
This was an area in which the Thunder held an advantage. Fewer turnovers generally mean fewer possessions ending without a shot, although the value of that difference depends on what happens on the remaining possessions.
Detroit still won despite committing two additional turnovers. That result highlights the strength of its advantages in field-goal conversion, rebounding, and blocks.
A full analysis of turnover impact would require details such as points off turnovers and live-ball turnovers. Those figures are not included in the supplied game data, so the exact scoring cost cannot be established here.
Steals and Blocks: Detroit’s Defensive Impact
Detroit recorded nine steals and 12 blocks. Oklahoma City had seven steals and three blocks.
The steal totals were relatively close, but the block difference was pronounced. Detroit registered nine more blocks, suggesting a much greater statistical impact on shots near the basket and other attempts that could be blocked.
Blocks can change an offensive possession immediately, while the threat of rim protection can also influence a player’s shot selection. Still, the box score cannot establish how many attempts were altered without being blocked or how each block affected the subsequent possession.
The figures do establish that Detroit recorded 12 blocks to Oklahoma City’s three. Combined with the rebounding advantage, that total supports the conclusion that the Pistons were more effective around the rim.
Fouls and Defensive Pressure
Oklahoma City committed 20 personal fouls, compared with Detroit’s 21. The one-foul difference was small.
The Thunder’s 20-of-21 free-throw performance shows that they capitalized on their trips to the line. Detroit’s 19-of-26 record was less accurate, but the Pistons still scored more points overall.
Foul totals should not be used in isolation to judge defensive discipline. The timing of fouls, whether they occurred during shooting attempts, and the resulting free throws all matter. Those details would be necessary for a deeper assessment of how fouling influenced the final result.
Five Key Reasons Detroit Won the Game
The statistical comparison points to five main factors behind the Pistons’ eight-point victory.
1. Detroit Responded After the First Quarter
The Thunder led 34-22 after the opening period. Detroit then outscored Oklahoma City 36-18 in the second quarter.
That turnaround transformed the game. Rather than allowing the early deficit to grow, Detroit produced its strongest response when it needed it most.
The second quarter also illustrates why a game should be assessed across all four periods. Oklahoma City’s opening success did not guarantee sustained control.
2. The Pistons Converted More Field-Goal Attempts
Detroit made 48 field goals on 89 attempts. Oklahoma City made 39 on 96 attempts.
The nine-field-goal advantage was significant because Detroit achieved it while taking fewer shots. This reflects the importance of shot conversion and overall efficiency.
Although Oklahoma City made more three-pointers, Detroit’s production across all field goals provided a more consistent source of scoring.
3. Jalen Duren Helped Control the Rebounds
Duren recorded 29 points and 15 rebounds. His rebounding performance supported Detroit’s overall 52-37 advantage.
His five offensive rebounds were especially relevant because they provided opportunities for the Pistons to recover the ball after missed shots.
The available data does not identify the result of every offensive rebound, but the team rebounding margin demonstrates Detroit’s success in this area.
4. Cade Cunningham Combined Scoring With Playmaking
Cunningham scored 29 points and recorded 13 assists. He also made 11 of 16 field goals and converted all four free throws.
This combination of scoring and playmaking gave Detroit an effective offensive leader. Rather than contributing solely through his own shots, Cunningham also created opportunities for teammates.
His three steals and three blocks added further statistical production on defense.
5. Detroit Protected the Rim More Effectively
Detroit finished with 12 blocks, four times Oklahoma City’s total of three.
That difference, alongside the 15-rebound advantage, indicates that Detroit had a much stronger statistical presence around the basket.
Oklahoma City’s 18 made three-pointers and 95% free-throw accuracy kept the Thunder competitive, but those strengths did not eliminate the Pistons’ advantages in interior defense and field-goal conversion.
What the Match Statistics Reveal About Both Teams
The game offers several useful lessons for readers who want to understand basketball beyond the final score.
Oklahoma City’s Scoring Was Not the Main Problem
The Thunder scored 116 points and had three players reach at least 20 points. Williams scored 30, Wallace added 23, and Wiggins contributed 20.
They also made 18 three-pointers and converted nearly all their free throws.
Those figures show that Oklahoma City generated substantial offensive production. The defeat was not simply a matter of the team failing to score.
Instead, the wider statistics point to the importance of shooting efficiency and defensive control. The Thunder attempted more field goals than Detroit but made nine fewer. They also collected 15 fewer rebounds and recorded nine fewer blocks.
The distinction matters because a high-scoring performance can still fall short when an opponent produces more efficient possessions.
Detroit Benefited From Complementary Contributions
Cunningham and Duren each scored 29 points, but their contributions differed. Cunningham’s 13 assists reflected playmaking, while Duren’s 15 rebounds highlighted interior control.
Robinson added 16 points, and Thompson scored 11. These supporting totals helped Detroit distribute the offensive workload.
This balance can be valuable over a long game because it creates more than one source of production. When a team receives scoring from several players and combines it with strong rebounding, it becomes less dependent on a single offensive route.
The available numbers support that interpretation, although they do not provide enough information to calculate individual plus-minus figures or on-court lineup efficiency.
Detroit’s Rebounding and Blocks Reinforced Each Other
Rebounding and rim protection are distinct statistics, but they can work together.
A blocked shot can prevent a basket and sometimes create a loose-ball situation. A defensive rebound can then end the possession. On offense, a recovered miss can produce another shot.
Detroit’s 12 blocks and 52 rebounds show strength in both areas. However, the statistics do not reveal how many of the rebounds followed blocks or how many second-chance points Detroit scored.
For that reason, the safest conclusion is that Detroit dominated two important areas of interior play, not that every block or rebound directly produced a scoring advantage.
The Final Quarter Shows Why Timing Matters
Oklahoma City won the fourth quarter 36-30, but Detroit still won the game.
The Thunder’s final-period performance demonstrated that they could recover some of their offensive rhythm. Yet their 14-point deficit at the beginning of the quarter was too large to erase.
This is a useful reminder when reviewing basketball statistics: quarter scores provide context for the final result. A team can finish strongly and still lose because its opponent performed better during an earlier stretch.
Historical Context and Season-Series Results
The supplied game data records Detroit’s 124-116 victory on February 26, 2026, as the first game of the season series, with Detroit leading 1-0 at that point.
The same data lists a second matchup on March 31, 2026, in which Oklahoma City defeated Detroit 114-110 in overtime.
These results should be kept separate when interpreting the February game. Detroit won the February contest, but Oklahoma City’s later victory changed the season-series picture.
The two results also show why a single head-to-head matchup should not be treated as a complete measure of which team was stronger across the season. Each game has its own circumstances, lineups, and statistical profile.
For historical verification, readers can consult the ESPN box score for the February 26, 2026, game. It is the relevant reference for checking the listed result and the recorded player and team statistics.
How to Read Player Stats Without Misinterpreting Them
A box score is a useful starting point, but it does not explain every detail of a basketball game. The most reliable analysis combines confirmed numbers with careful interpretation.
Start With the Final Score and Quarter Scores
The final score establishes the outcome, while quarter scores explain when the game changed direction.
For this matchup, Detroit’s second-quarter response was more decisive than Oklahoma City’s opening lead. The quarter breakdown provides that context immediately.
Compare Efficiency With Volume
A player or team may attempt many shots without converting them efficiently. Conversely, a smaller number of attempts can produce strong scoring when the conversion rate is high.
Detroit’s 48-for-89 field-goal performance compared with Oklahoma City’s 39-for-96 line is a clear example of why makes, attempts, and percentages should be considered together.
Separate Individual and Team Contributions
Cunningham’s 13 assists and Duren’s 15 rebounds identify different kinds of value. Neither statistic alone explains the full result, but each helps describe how the player contributed.
Team statistics provide another layer. Detroit’s 52 rebounds and 12 blocks show advantages that extend beyond any one player’s point total.
Distinguish Confirmed Facts From Missing Information
The supplied data does not include complete individual shooting lines for every player, all playing minutes, points off turnovers, or a full play-by-play account.
Those missing details should not be filled with estimates presented as facts. A trustworthy game report clearly identifies what is known and avoids inventing statistics to make the analysis appear more comprehensive.
This approach is especially important when publishing historical sports articles. Accurate figures and clear explanations are more valuable than unsupported claims about individual impact.
Frequently Asked Questions
1. Who won the Oklahoma City Thunder vs Detroit Pistons game on February 26, 2026?
The Detroit Pistons defeated the Oklahoma City Thunder 124-116 at Little Caesars Arena in Detroit, Michigan. Detroit overcame a 12-point first-quarter deficit by outscoring Oklahoma City 36-18 in the second quarter.
2. Who was the leading scorer in the game?
Jaylin Williams led Oklahoma City with 30 points. Cade Cunningham and Jalen Duren were Detroit’s leading scorers, finishing with 29 points each.
3. How many points and assists did Cade Cunningham record?
Cade Cunningham recorded 29 points and 13 assists. He made 11 of 16 field-goal attempts, three of five three-pointers, and all four free throws. He also recorded three steals and three blocks.
4. How many rebounds did Jalen Duren collect?
Jalen Duren recorded 15 rebounds, including five offensive rebounds and 10 defensive rebounds. He also scored 29 points, making 12 of 17 field-goal attempts.
5. Why did Detroit win despite Oklahoma City’s three-point advantage?
Detroit won because it shot more efficiently overall, collected more rebounds, and recorded significantly more blocks. The Pistons shot 54% from the field, grabbed 52 rebounds, and recorded 12 blocks. Oklahoma City made 18 three-pointers, but its overall field-goal percentage was approximately 41%.
6. What was the season-series result between Detroit and Oklahoma City?
Detroit won the February 26 matchup 124-116. The supplied records also list an Oklahoma City victory over Detroit, 114-110 in overtime, on March 31, 2026. The two results should be considered separately when reviewing the season series.
Conclusion
The oklahoma city thunder vs detroit pistons match player stats show how Detroit secured an eight-point victory through efficient shooting, strong rebounding, and effective rim protection. The Pistons recovered from a difficult opening quarter and used a dominant second period to take control of the game.
Cade Cunningham’s 29 points and 13 assists provided offensive leadership, while Jalen Duren contributed 29 points and 15 rebounds. Duncan Robinson added 16 points, giving Detroit valuable support beyond its two leading scorers. For Oklahoma City, Jaylin Williams scored 30 points, Cason Wallace added 23, and Aaron Wiggins finished with 20.
The team comparison reveals the biggest differences. Detroit made 48 field goals to Oklahoma City’s 39, won the rebounding battle 52-37, and recorded 12 blocks compared with three. Oklahoma City performed better from three-point range and at the free-throw line, but those strengths were not enough to overcome Detroit’s advantages elsewhere.
Ultimately, this matchup demonstrates why basketball analysis requires more than a glance at the final score. Scoring, efficiency, rebounding, playmaking, and defense must be considered together to understand how a team wins. Detroit’s performance on February 26 combined those elements effectively, while Oklahoma City’s late fourth-quarter push came too late to reverse the result.