New York Giants vs Buffalo Bills Match Player Stats
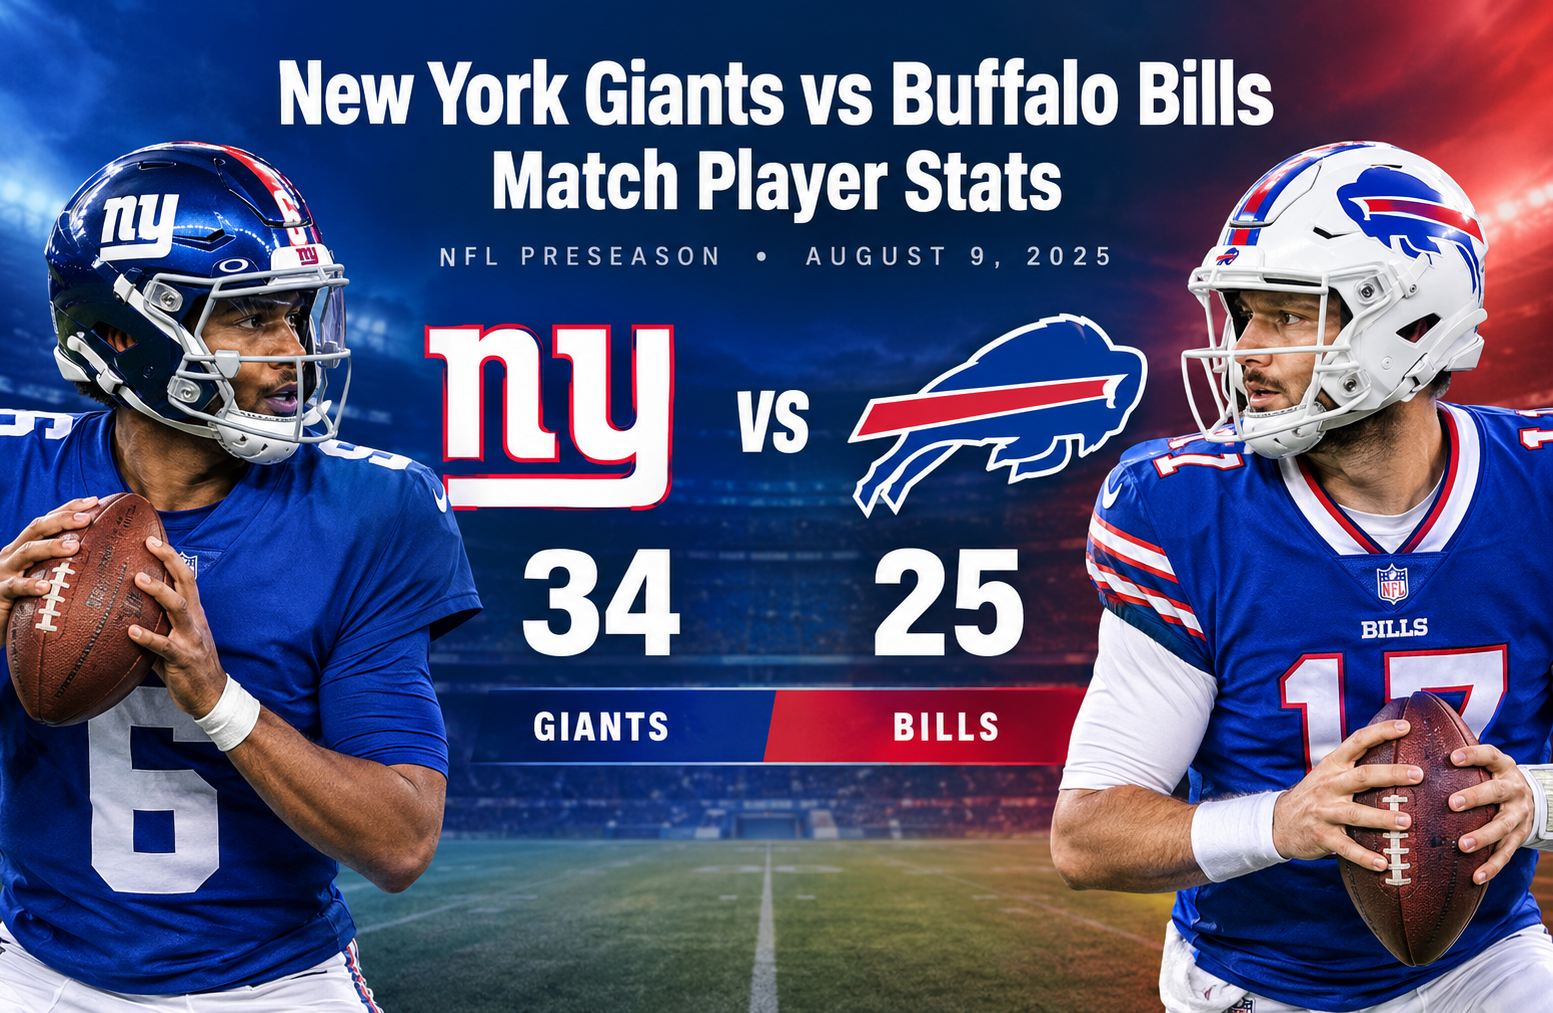
The New York Giants vs Buffalo Bills Match Player Stats from August 9, 2025, provide a detailed look at an entertaining NFL preseason contest in which the Giants defeated the Bills 34-25. New York combined three passing touchdowns, four successful field goals, and a productive receiving performance to secure a nine-point victory. Buffalo generated more passing and receiving yards, but the Giants finished with more points and benefited from a key turnover advantage.
The game offered useful opportunities to evaluate quarterbacks, running backs, wide receivers, special teams, and defensive units. Jaxson Dart, Tommy DeVito, Jameis Winston, and Russell Wilson all contributed at quarterback for New York. Buffalo used Mitchell Trubisky, Mike White, and Shane Buechele, with each passer helping produce an offense that moved the ball effectively through the air.
Because this was a preseason game, the statistics require context. Exhibition games involve multiple quarterback rotations, frequent substitutions, and opportunities for players competing for roster positions. The final numbers reveal which players produced during their opportunities, but they should not automatically be treated as predictions of regular-season performance.
New York Giants vs Buffalo Bills Match Player Stats: Game Overview
The Giants and Bills met on August 9, 2025, in an NFL preseason matchup. New York won 34-25, scoring in every quarter and maintaining its advantage through the final period.
Final Score and Quarter-by-Quarter Results
| Team | Q1 | Q2 | Q3 | Q4 | Final |
| New York Giants | 3 | 13 | 8 | 10 | 34 |
| Buffalo Bills | 0 | 10 | 7 | 8 | 25 |
The Giants opened with three points in the first quarter while keeping Buffalo off the scoreboard. The second quarter produced the largest scoring contribution from New York, which added 13 points. Buffalo responded with 10 points before halftime, but the Giants maintained control of the scoreboard.
Both teams scored in the third quarter, with New York adding eight points and Buffalo seven. The fourth quarter saw the Giants score 10 points while the Bills managed eight.
New York’s ability to score consistently across all four quarters was important. The Giants did not depend entirely on one explosive period, and their 34-point total reflected contributions from several offensive possessions.
Quick Game Facts
| Category | Result |
| Game date | August 9, 2025 |
| Competition | NFL preseason |
| Final score | Giants 34, Bills 25 |
| Winning team | New York Giants |
| Victory margin | 9 points |
| Giants passing yards | 317 |
| Bills passing yards | 331 |
| Giants rushing yards | 79 |
| Bills rushing yards | 58 |
| Giants passing touchdowns | 3 |
| Bills passing touchdowns | 3 |
| Interceptions | 0 by either team |
| Turnover comparison | Giants recovered a fumble; Bills lost one |
The most important statistical contrast is that Buffalo accumulated more passing yards, yet New York scored more points. Passing yardage measures how much ground an offense covers through the air. It does not independently measure how efficiently a team converts possessions into points.
The Giants also gained more rushing yards and finished with the advantage in the turnover column, two factors that help explain why the final score did not simply follow the passing-yardage comparison.
Quarterback Stats: Giants vs Bills
Quarterback performance is one of the most closely examined parts of any NFL box score. This matchup featured four Giants passers and three Bills passers, creating a broad comparison of completion rates, yardage, touchdown production, and ball security.
New York Giants Quarterback Statistics
| Quarterback | Comp/Att | Passing Yards | Yards per Attempt | TDs | INTs | Rating |
| Jaxson Dart | 12/19 | 154 | 8.1 | 1 | 0 | 106.0 |
| Tommy DeVito | 10/14 | 73 | 5.2 | 1 | 0 | 107.1 |
| Jameis Winston | 7/11 | 62 | 5.6 | 1 | 0 | 108.9 |
| Russell Wilson | 6/7 | 28 | 4.0 | 0 | 0 | 83.3 |
| Team total | 35/51 | 317 | 6.2 | 3 | 0 | 104.8 |
Comp/Att means completions and pass attempts. TDs are passing touchdowns, INTs are interceptions, and rating refers to passer rating.
Jaxson Dart: The Giants’ Leading Passer
Jaxson Dart completed 12 of 19 passes for 154 yards and one touchdown. He averaged 8.1 yards per attempt and recorded a passer rating of 106.0, without throwing an interception or taking a recorded sack.
Dart’s 154 passing yards represented the largest individual total among the Giants quarterbacks in this game. His average of 8.1 yards per attempt also indicates that his passing production was not limited to short completions.
He added three rushing attempts for 24 yards, averaging 8.0 yards per carry. His longest run covered 19 yards, giving the Giants another way to gain ground beyond his passing production.
These numbers demonstrate productive output during his preseason opportunity. However, one exhibition performance cannot establish how a quarterback will perform across a complete regular season. Opponent personnel, play selection, protection, and the circumstances of each possession all affect individual results.
Tommy DeVito: Efficient Completion Percentage
Tommy DeVito completed 10 of 14 passes for 73 yards and a touchdown. His completion rate was approximately 71.4%, and he finished with a 107.1 passer rating.
DeVito attempted fewer passes than Dart but completed a higher percentage of them. He also avoided interceptions and sacks. His two rushing attempts produced one yard, so his contribution in this game came primarily through the passing attack.
His numbers illustrate why completion percentage should be considered alongside passing yardage. Completing a high percentage of attempts can demonstrate accuracy, but the number of yards gained per attempt helps explain how productive those completions were.
Jameis Winston: A Touchdown Without a Turnover
Jameis Winston completed seven of 11 passes for 62 yards and one touchdown. He averaged 5.6 yards per attempt and posted a passer rating of 108.9.
Winston also recorded one rushing attempt for 12 yards. Like the other Giants passers listed above, he did not throw an interception or take a recorded sack.
His touchdown added to New York’s overall passing production. The lack of interceptions was another positive element of the team’s quarterback statistics, although avoiding turnovers in one game does not guarantee similar results in future contests.
Russell Wilson: A Small Sample of Attempts
Russell Wilson completed six of seven passes for 28 yards. He did not throw a touchdown or interception and finished with an 83.3 passer rating.
Wilson’s completion rate was approximately 85.7%, the highest among the Giants quarterbacks in this matchup. However, his seven attempts were the smallest passing sample among the four New York passers.
This distinction matters when comparing quarterbacks. A completion rate can be high even when total yardage is limited, particularly when attempts are concentrated on shorter throws. His figures should therefore be read as a description of his recorded opportunities rather than a complete evaluation of his overall ability.
Buffalo Bills Quarterback Statistics
| Quarterback | Comp/Att | Passing Yards | Yards per Attempt | TDs | INTs | Sacks Taken |
| Mitchell Trubisky | 9/13 | 138 | 10.6 | 1 | 0 | 0 |
| Mike White | 8/13 | 112 | 8.6 | 2 | 0 | 1 |
| Shane Buechele | 10/12 | 91 | 7.6 | 0 | 0 | 1 |
| Team total | 27/38 | 331 | 9.0 | 3 | 0 | 2 |
Mitchell Trubisky: Buffalo’s Most Productive Passer by Yardage
Mitchell Trubisky completed nine of 13 attempts for 138 yards and one touchdown. His 10.6 yards per attempt was the highest figure among the seven quarterbacks listed in the game statistics.
That average is particularly notable because it shows how much yardage Buffalo gained from a relatively small number of attempts. Trubisky completed approximately 69.2% of his passes while producing the team’s highest individual passing-yard total.
He did not throw an interception or take a recorded sack. His statistical contribution was an important part of Buffalo’s overall aerial production, even though the Bills ultimately lost.
Mike White: Two Passing Touchdowns
Mike White completed eight of 13 passes for 112 yards and two touchdowns. He averaged 8.6 yards per attempt and recorded a 128.8 passer rating.
White’s two touchdown passes gave him the highest individual passing-touchdown total in this game. He was also responsible for 112 passing yards, making him Buffalo’s second-leading passer by yardage.
He took one sack for eight yards. That loss is relevant when assessing the offense’s overall movement, although the sack should not overshadow his two touchdown passes.
Shane Buechele: Accurate Passing in Limited Attempts
Shane Buechele completed 10 of 12 passes for 91 yards. His completion rate was approximately 83.3%, and he averaged 7.6 yards per attempt.
He did not throw a touchdown or interception, and he took one sack for two yards. His completion percentage was strong, but his lack of a passing touchdown means the box score does not show the same direct scoring contribution as White’s performance.
Buechele’s statistics also demonstrate why accuracy, yardage, and touchdowns should be considered together rather than treating one category as the only measure of quarterback performance.
Comparing the Seven Quarterbacks
The quarterback comparison produces several useful observations:
- Most passing yards: Jaxson Dart led the Giants with 154, while Mitchell Trubisky led Buffalo with 138.
- Highest yards per attempt: Trubisky recorded 10.6, followed by White at 8.6 and Dart at 8.1.
- Most passing touchdowns by one quarterback: Mike White threw two.
- Highest completion percentage: Russell Wilson completed 85.7% of his seven attempts, although his sample was small.
- Team passing advantage: Buffalo gained 331 passing yards, compared with New York’s 317.
- Interceptions: None of the seven quarterbacks threw an interception.
The team-level result is important. Buffalo averaged 9.0 yards per passing attempt, compared with 6.2 for New York. The Bills therefore gained more yards per attempt and more total passing yards, but the Giants still won by nine points.
This is a reminder that passing efficiency alone does not determine a football game’s outcome. Rushing production, turnovers, kicking, defensive stops, and the timing of scoring plays all contribute to the final result.
Giants vs Bills Rushing Stats
The ground game provides another useful way to understand the matchup. New York ran the ball more frequently and gained more total rushing yards, while Buffalo produced a higher average per carry.
New York Giants Rushing Leaders
| Player | Carries | Rushing Yards | Yards per Carry | Longest Run |
| Jaxson Dart | 3 | 24 | 8.0 | 19 |
| Dante Miller | 10 | 22 | 2.2 | 10 |
| Jameis Winston | 1 | 12 | 12.0 | 12 |
| Tyrone Tracy Jr. | 3 | 9 | 3.0 | 5 |
| Jonathan Ward | 3 | 5 | 1.7 | 3 |
| Montrell Washington | 1 | 3 | 3.0 | 3 |
| Devin Singletary | 2 | 3 | 1.5 | 3 |
| Tommy DeVito | 2 | 1 | 0.5 | 1 |
| Team total | 25 | 79 | 3.2 | 19 |
Dante Miller Led New York in Rushing Attempts
Dante Miller carried the ball 10 times for 22 yards. His 2.2 yards per carry was modest, but his workload was the largest among the Giants players in the rushing table.
The difference between carries and production matters here. Miller received more opportunities than any other Giants runner, but those attempts did not generate the team’s highest rushing total or average.
His role can be assessed more accurately by considering rushing attempts, yardage, and the longest run together. The available figures do not provide enough information to judge every blocking assignment or the defensive fronts he faced.
Jaxson Dart Added a Running Threat
Dart gained 24 yards on three carries, making him New York’s leading rusher by total yardage. His 19-yard run was also the longest Giants rushing attempt in the supplied statistics.
Quarterback rushing can create additional offensive options because defenders must account for the possibility of the passer keeping the ball. Dart’s rushing numbers therefore complement his passing line, although they represent only three attempts.
Winston also gained 12 yards on one carry. His 12.0 yards per carry was higher than any other Giants player in the table, but that average came from a single rushing attempt and should not be treated as a stable measure of expected production.
Buffalo Bills Rushing Leaders
| Player | Carries | Rushing Yards | Yards per Carry | Longest Run |
| Ty Johnson | 3 | 26 | 8.7 | 14 |
| Frank Gore Jr. | 5 | 21 | 4.2 | 11 |
| Ray Davis | 4 | 7 | 1.8 | 4 |
| Darrynton Evans | 2 | 4 | 2.0 | 3 |
| Shane Buechele | 1 | 0 | 0.0 | 0 |
| Team total | 15 | 58 | 3.9 | 14 |
Ty Johnson Produced Buffalo’s Best Rushing Total
Ty Johnson gained 26 yards on three carries, averaging 8.7 yards per attempt. He led Buffalo in rushing yardage despite receiving fewer carries than Frank Gore Jr.
Johnson’s 14-yard longest run accounted for a substantial portion of his total production. His average was also higher than that of any Giants player with multiple rushing attempts, excluding the single-carry figures that require additional caution when interpreted.
Frank Gore Jr. Contributed on the Ground and Through the Air
Frank Gore Jr. recorded five carries for 21 rushing yards. He averaged 4.2 yards per carry and added five receptions for 50 yards in the passing game.
That combined contribution is useful when evaluating a running back’s role. Rushing statistics alone would account for 21 yards, while his receiving work added another 50 yards. Together, the supplied figures show 71 yards from scrimmage across his recorded rushing and receiving production.
His receiving line also shows that he contributed to Buffalo’s passing game rather than being limited to traditional handoffs.
Team Rushing Comparison
| Statistic | Giants | Bills |
| Rushing attempts | 25 | 15 |
| Rushing yards | 79 | 58 |
| Yards per carry | 3.2 | 3.9 |
| Longest run | 19 yards | 14 yards |
| Rushing touchdowns | 0 | 0 |
New York gained 21 more rushing yards than Buffalo and attempted 10 more runs. The Bills, however, averaged 3.9 yards per carry against the Giants’ 3.2.
This difference highlights two ways to evaluate a rushing attack. Total yardage measures overall production, while yards per carry provides a rough indication of efficiency. New York had more aggregate rushing output, but Buffalo gained more per attempt.
Neither team recorded a rushing touchdown in the supplied statistics. All six listed team passing touchdowns, three per side, came through the air.
Receiving Stats: Giants vs Bills
Receiving production was another defining feature of the contest. Both teams recorded three passing touchdowns, but Buffalo generated more total receiving yards and a higher average per reception.
New York Giants Receiving Leaders
| Receiver | Receptions | Receiving Yards | Yards per Catch | TDs | Longest Catch |
| Dante Miller | 7 | 80 | 11.4 | 0 | 18 |
| Montrell Washington | 3 | 60 | 20.0 | 0 | 29 |
| Lil’Jordan Humphrey | 2 | 36 | 18.0 | 1 | 28 |
| Jonathan Ward | 4 | 35 | 8.8 | 1 | 21 |
| Gunner Olszewski | 5 | 27 | 5.4 | 1 | 9 |
| Thomas Fidone II | 3 | 22 | 7.3 | 0 | 16 |
| Wan’Dale Robinson | 1 | 11 | 11.0 | 0 | 11 |
| Theo Johnson | 2 | 10 | 5.0 | 0 | 7 |
| Zach Pascal | 1 | 9 | 9.0 | 0 | 9 |
| Jordan Bly | 1 | 8 | 8.0 | 0 | 8 |
| Tyrone Tracy Jr. | 2 | 7 | 3.5 | 0 | 7 |
| Greg Dulcich | 2 | 7 | 3.5 | 0 | 7 |
| Ihmir Smith-Marsette | 1 | 5 | 5.0 | 0 | 5 |
| Daniel Bellinger | 1 | 0 | 0.0 | 0 | 0 |
TDs refers to receiving touchdowns. The table includes the principal receiving lines with recorded catches and yardage; players with no receptions are not included.
Dante Miller Led the Giants in Receiving
Dante Miller recorded seven receptions for 80 yards, making him New York’s leading receiver by both catches and receiving yardage. He averaged 11.4 yards per reception and was targeted seven times.
His receiving production is notable because he also led the Giants in rushing attempts. Combining his rushing and receiving totals gives him 102 yards from scrimmage: 22 rushing yards and 80 receiving yards.
This is a useful example of why position labels alone do not tell the entire story of an individual performance. A player listed among the running backs can still make a major contribution as a receiver.
Montrell Washington Provided Explosive Receiving Plays
Montrell Washington caught three passes for 60 yards, averaging 20.0 yards per reception. His longest catch covered 29 yards.
Washington’s average was higher than Miller’s, although Miller gained more total receiving yards because he caught more passes. Washington also contributed 25 yards on one kick return.
His receiving and return statistics show two different ways a player can affect field position. Receiving gains advance the offense during a possession, while kick returns can improve the starting position for a new drive.
Lil’Jordan Humphrey, Jonathan Ward, and Gunner Olszewski Scored
Three Giants players recorded receiving touchdowns in the supplied box score.
- Lil’Jordan Humphrey caught two passes for 36 yards and one touchdown.
- Jonathan Ward caught four passes for 35 yards and one touchdown.
- Gunner Olszewski caught five passes for 27 yards and one touchdown.
Humphrey averaged 18.0 yards per reception, while Ward contributed four catches and Olszewski recorded five. Their touchdown totals demonstrate that New York distributed its scoring production among multiple receiving options.
The numbers also illustrate the difference between volume and scoring impact. Olszewski recorded more catches than Humphrey, but Humphrey produced more receiving yards per catch. Each contributed a touchdown.
Buffalo Bills Receiving Leaders
| Receiver | Receptions | Receiving Yards | Yards per Catch | TDs | Longest Catch |
| Tyrell Shavers | 2 | 70 | 35.0 | 0 | 58 |
| Frank Gore Jr. | 5 | 50 | 10.0 | 0 | 19 |
| KJ Hamler | 1 | 39 | 39.0 | 1 | 39 |
| Stephen Gosnell | 4 | 30 | 7.5 | 0 | 9 |
| Joshua Palmer | 2 | 21 | 10.5 | 0 | 12 |
| Kristian Wilkerson | 1 | 20 | 20.0 | 0 | 20 |
| Reggie Gilliam | 1 | 19 | 19.0 | 0 | 19 |
| Deon Cain | 1 | 17 | 17.0 | 0 | 17 |
| Laviska Shenault Jr. | 1 | 17 | 17.0 | 0 | 17 |
| Darrynton Evans | 2 | 14 | 7.0 | 1 | 7 |
| Dawson Knox | 1 | 11 | 11.0 | 1 | 11 |
| Dalton Kincaid | 1 | 10 | 10.0 | 0 | 10 |
| Keleki Latu | 1 | 9 | 9.0 | 0 | 9 |
| Ray Davis | 1 | 7 | 7.0 | 0 | 7 |
| Zach Davidson | 1 | 5 | 5.0 | 0 | 5 |
| Matt Sokol | 1 | 2 | 2.0 | 0 | 2 |
| Keon Coleman | 1 | 0 | 0.0 | 0 | 0 |
Players without a recorded reception are omitted from this table.
Tyrell Shavers Recorded Buffalo’s Longest Catch
Tyrell Shavers caught two passes for 70 yards, averaging 35.0 yards per reception. His longest catch covered 58 yards, the longest reception listed for either team.
The low reception count and high yardage total show how a small number of explosive plays can influence a team’s receiving average. Shavers did not record a receiving touchdown in the supplied statistics, but his 70 yards represented Buffalo’s highest individual receiving total.
This is a useful distinction when reading football box scores. A receiver does not need a large number of catches to generate substantial yardage, particularly when one reception covers a significant distance.
KJ Hamler Delivered a Touchdown
KJ Hamler caught one pass for 39 yards and a touchdown. His 39.0 yards per reception was the highest average among the listed Buffalo receivers, but it came from a single catch.
Hamler’s touchdown was a direct scoring contribution, and his 39-yard reception added an explosive play to Buffalo’s offense. As with any one-catch performance, the average should be interpreted alongside the limited number of opportunities.
Frank Gore Jr. Added Reliable Receiving Volume
Gore caught five passes for 50 yards, averaging 10.0 yards per reception. He combined those catches with 21 rushing yards, giving him a productive dual-role statistical line.
His 50 receiving yards ranked second among Buffalo players in the supplied figures. The combination of rushing and receiving activity makes his overall contribution more substantial than the rushing table alone suggests.
Buffalo’s Receiving Touchdowns
The supplied statistics identify three Buffalo receiving touchdowns:
- KJ Hamler: one reception for 39 yards and a touchdown.
- Darrynton Evans: two receptions for 14 yards and a touchdown.
- Dawson Knox: one reception for 11 yards and a touchdown.
These scoring contributions align with Buffalo’s three team passing touchdowns. Mike White threw two touchdown passes, while Trubisky threw one. The provided summary does not identify which quarterback threw each individual scoring pass, so a player-to-quarterback touchdown attribution should not be inferred from these aggregate figures alone.
Team Receiving Comparison
| Statistic | Giants | Bills |
| Receptions | 35 | 27 |
| Receiving yards | 317 | 341 |
| Average yards per reception | 9.1 | 12.6 |
| Receiving touchdowns | 3 | 3 |
| Longest reception | 29 yards | 58 yards |
| Targets | 50 | 38 |
Buffalo gained 24 more receiving yards than New York despite recording eight fewer receptions. The Bills also averaged 12.6 yards per catch, compared with 9.1 for the Giants.
New York generated more receiving volume, while Buffalo produced more yardage per completed reception. That difference is consistent with Shavers’ 58-yard catch and other productive downfield plays.
The Giants’ higher reception total also indicates a more frequent completion count. However, receptions alone do not reveal how many first downs were gained, whether passes occurred on third down, or how much of the yardage came after the catch. Those questions require play-by-play or advanced tracking data.
Defensive Stats and Turnover Analysis
Offensive statistics explain much of the game’s yardage production, but defense and ball security also matter. The Giants won 34-25 despite allowing Buffalo to record more passing yards and more total receiving yards.
Team Defensive Comparison
| Defensive Statistic | Giants | Bills |
| Total tackles | 60 | 72 |
| Solo tackles | 36 | 59 |
| Sacks | 2 | 0 |
| Tackles for loss | 2 | 2 |
| Passes defended | 3 | 7 |
| Quarterback hits | 6 | 6 |
| Defensive touchdowns | 0 | 0 |
| Interceptions | 0 | 0 |
Giants Defense: Two Sacks and Six Quarterback Hits
New York recorded two sacks, two tackles for loss, three passes defended, and six quarterback hits. The sack total was an important difference between the two defenses because Buffalo did not record a sack in the supplied team defensive figures.
Sacks can end a passing attempt behind the line of scrimmage and reduce offensive yardage. They can also place an offense in a more difficult down-and-distance situation. However, the box score does not provide enough detail to assign both sacks to particular defenders or determine their precise influence on individual drives.
The Giants also recorded six quarterback hits. That figure indicates pressure reaching the quarterback, although quarterback hits and sacks are different measurements and should not be treated as interchangeable.
Bills Defense: More Tackles and Passes Defended
Buffalo recorded 72 total tackles, including 59 solo tackles, and defended seven passes. The Bills also registered two tackles for loss and six quarterback hits.
The higher tackle count does not automatically mean Buffalo defended better. Tackle totals depend partly on how frequently the opposing offense possesses the ball and how plays develop. A defense can record many tackles while still allowing substantial scoring.
Buffalo’s seven passes defended exceeded New York’s three, suggesting that Bills defenders disrupted more passing attempts according to that category. Nevertheless, the Bills did not record a sack or interception in the supplied statistics.
Turnovers: A Meaningful Difference
| Turnover Category | Giants | Bills |
| Team fumbles | 0 recorded as fumbles in the summary | 1 |
| Fumbles lost | 0 | 1 |
| Fumbles recovered | 1 | 0 |
| Interceptions thrown | 0 | 0 |
The Giants recorded one team fumble recovery, while Buffalo lost one fumble. Neither team recorded an interception.
This distinction helps explain why turnover analysis should not be limited to interceptions. Fumbles can change possession just as interceptions do, and a lost fumble can remove a scoring opportunity or give the opponent a shorter field.
The supplied summary lists Trace Ford as the Giants player associated with the recovery and Jacob Bayer as the Bills player associated with the lost fumble. New York’s turnover advantage was one of the meaningful differences between the teams.
Turnovers do not always determine the outcome on their own, but in a game decided by nine points, possession changes are an important part of the statistical story.
Special Teams: Kicking, Punting, and Returns
Special teams provided another area in which the Giants produced a strong statistical result. New York converted all four field-goal attempts, while Buffalo made its only field-goal attempt. The Giants also generated more punt-return yardage, whereas Buffalo gained more kick-return yardage.
Field-Goal and Extra-Point Statistics
| Kicker | Field Goals | Longest Field Goal | Extra Points | Total Points |
| Graham Gano, Giants | 3/3 | 53 yards | 1/1 | 10 |
| Jude McAtamney, Giants | 1/1 | 42 yards | 1/1 | 4 |
| Caden Davis, Bills | 1/1 | 24 yards | 1/1 | 4 |
| Ray Davis, Bills | 0/0 | None | 1/1 | 1 |
The Giants converted four of four field goals, producing 12 points from field goals, along with two extra points. Graham Gano made three field goals, including a long of 53 yards, while Jude McAtamney converted one from 42 yards.
Buffalo made one field goal through Caden Davis, with a longest successful kick of 24 yards. The supplied table also records one successful extra point for Ray Davis.
These figures show that New York’s kicking unit contributed consistently to the scoring total. The Giants earned points on field-goal opportunities without missing an attempt, while the Bills had fewer recorded field-goal conversions.
Punting Comparison
| Statistic | Giants | Bills |
| Punts | 4 | 6 |
| Total punt yards | 181 | 318 |
| Average punt | 45.3 yards | 53.0 yards |
| Longest punt | 57 yards | 61 yards |
| Punts inside the 20 | 1 | 3 |
| Touchbacks | 0 | 1 |
Buffalo’s Brad Robbins averaged 53.0 yards across six punts, while Giants punter Jamie Gillan averaged 45.3 yards across four. Buffalo also placed three punts inside the 20-yard line, compared with one for New York.
Punting averages need context. A long punt can improve field position, but placement, return distance, hang time, and the location of the original kick also influence its effectiveness. The table establishes that Buffalo recorded the higher average and more punts inside the 20, but it does not provide every detail needed to assess the full quality of each punt.
Kick Returns
| Team | Returns | Total Yards | Average | Longest Return |
| Giants | 4 | 91 | 22.8 | 40 yards |
| Bills | 6 | 159 | 26.5 | 32 yards |
Buffalo gained more total kick-return yardage and averaged 26.5 yards per return. Laviska Shenault Jr. recorded two returns for 62 yards, including a longest return of 32 yards.
For New York, Ihmir Smith-Marsette recorded two kick returns for 46 yards, including the Giants’ longest return of 40 yards.
The Bills’ higher average and total return yardage provided an advantage in this category. The Giants, however, still secured the victory, demonstrating that a team can lose individual special-teams comparisons and win through the combined performance of its offense, defense, and kicking unit.
Punt Returns
| Team | Returns | Total Yards | Average | Longest Return |
| Giants | 5 | 46 | 9.2 | 19 yards |
| Bills | 2 | 11 | 5.5 | 7 yards |
New York gained 46 punt-return yards on five returns, averaging 9.2 yards. Buffalo recorded two returns for 11 yards, averaging 5.5 yards.
The Giants’ advantage in punt returns was smaller than Buffalo’s advantage in kick returns, but both categories contributed to field-position management. These totals are useful supporting details when assessing the full game rather than focusing exclusively on passing and rushing statistics.
Why the Giants Won Despite Buffalo’s Passing Advantage
The final score is best understood by combining the major statistical categories rather than isolating one team’s passing production.
1. New York Scored More Consistently
The Giants scored in all four quarters, finishing with 34 points. Their second-quarter total of 13 points created a meaningful scoring contribution, and they added 18 more points across the final two quarters.
Buffalo also scored in three consecutive quarters after being held scoreless in the first, but the Bills did not match New York’s overall output.
2. The Giants Had More Rushing Yardage
New York gained 79 rushing yards on 25 attempts. Buffalo recorded 58 yards on 15 carries.
Although the Bills averaged more yards per carry, the Giants gained 21 additional rushing yards overall. Their higher rushing volume provided another source of offensive production alongside the passing game.
3. Buffalo Lost a Fumble
The Giants recovered a fumble, while Buffalo lost one. Neither team threw an interception, so the recorded fumble was the key turnover difference in the supplied summary.
A turnover can affect both possession and field position. Even without the full drive-by-drive context, the recorded loss is a relevant part of the outcome.
4. New York Converted Every Field Goal
The Giants went four for four on field goals, compared with Buffalo’s one successful field goal. New York’s kicking performance supplied points when the offense did not finish every possession with a touchdown.
The team made all recorded field-goal attempts and both extra points, giving it a dependable scoring contribution from the kicking unit.
5. Passing Yards Did Not Tell the Whole Story
Buffalo recorded 331 passing yards to New York’s 317. The Bills also had the higher passing average per attempt and more receiving yards.
Those advantages were not enough to win. The Giants’ greater rushing total, fumble recovery, and four successful field goals helped offset Buffalo’s aerial production.
The broader lesson is that total yardage is not the same as scoring efficiency. A team can gain more yards and still lose when it converts fewer opportunities into points or gives away possession.
How to Read Preseason Player Statistics Correctly
Preseason box scores are useful, but their meaning differs from regular-season statistics. The Giants-Bills game involved several quarterbacks and a broad selection of players, making context especially important.
Understand the Difference Between Volume and Efficiency
Volume statistics describe how much a player did. Examples include pass attempts, carries, receptions, and total yards.
Efficiency statistics measure production relative to opportunities. Examples include yards per attempt, yards per carry, yards per reception, and completion percentage.
Both are necessary. Dante Miller’s seven catches produced more receiving yards than any other Giants receiver, while Montrell Washington averaged more yards per catch. Each statistic answers a different question.
Account for Sample Size
A player who gains 39 yards on one reception averages 39 yards per catch. That is a correct calculation, but it does not establish that the player would maintain the same average over 10 or 20 receptions.
The same principle applies to quarterbacks with seven or 12 attempts and runners with only one carry. Small samples can produce high or low averages that change substantially with additional opportunities.
Separate Individual Output From Team Results
Dart’s 154 passing yards made him the Giants’ leading passer, but New York’s victory depended on the entire team. Receivers, runners, kickers, defenders, and returners all contributed to the final outcome.
Similarly, Trubisky’s 138 passing yards and White’s two touchdown passes were productive individual performances, but Buffalo’s aggregate offensive production did not translate into a victory.
Use Official Box Scores for Exact Numbers
When checking a game’s statistics, use an authoritative box score and confirm the date and competition. This matters because preseason and regular-season games have different contexts, and player names or statistics can be confused across separate matchups.
The official ESPN box score for the Giants-Bills preseason game provides the reference point for the figures discussed in this article.
For readers comparing individual performances, the most useful approach is to check the player line, team totals, scoring summary, and turnover information together. That reduces the risk of drawing conclusions from an isolated statistic.
Frequently Asked Questions
1. Who won the New York Giants vs Buffalo Bills game on August 9, 2025?
The New York Giants defeated the Buffalo Bills 34-25 in their NFL preseason matchup on August 9, 2025. New York won by nine points.
2. How many passing yards did Jaxson Dart record against the Bills?
Jaxson Dart completed 12 of 19 passes for 154 yards and one touchdown. He threw no interceptions and added 24 rushing yards on three carries.
3. Which Bills quarterback threw the most passing touchdowns?
Mike White recorded two passing touchdowns on eight completions from 13 attempts. He finished with 112 passing yards and no interceptions.
4. Which player recorded the most receiving yards in the game?
Tyrell Shavers led all listed receivers with 70 receiving yards on two catches for Buffalo. Dante Miller led the Giants with 80 yards on seven receptions.
5. Which team had more total passing yards?
The Buffalo Bills recorded 331 passing yards, compared with 317 for the Giants. Buffalo also averaged 9.0 yards per passing attempt, while New York averaged 6.2.
6. How did the Giants win despite Buffalo gaining more passing yards?
New York won 34-25 by combining three passing touchdowns, 79 rushing yards, four successful field goals, and a fumble recovery. Buffalo gained more passing yards but lost a fumble and finished with fewer points.
Conclusion
The August 9, 2025, preseason matchup between the New York Giants and Buffalo Bills ended with a 34-25 Giants victory. The statistics show two teams capable of producing passing yardage, with Buffalo gaining more through the air and New York generating more rushing yards.
Jaxson Dart led the Giants in passing, Dante Miller contributed as both a runner and receiver, and three New York players recorded receiving touchdowns. For Buffalo, Mitchell Trubisky led the team in passing yardage, Mike White threw two touchdown passes, and Tyrell Shavers produced the game’s longest recorded reception.
The defensive and special-teams numbers add further context. New York recorded two sacks, recovered a fumble, and converted all four field-goal attempts. Buffalo had more passing yards, more receiving yards, and more kick-return yardage, but those advantages did not produce enough points to overcome the Giants.
Taken together, the figures provide a fuller account of the game than the final score alone. They show why passing yardage, rushing efficiency, scoring conversions, turnovers, and special teams should be considered together when evaluating an NFL performance. Since this was a preseason contest, individual results are best understood as evidence of what happened on that day rather than definitive predictions about the regular season.