Lakers vs Orlando Magic Match Player Stats
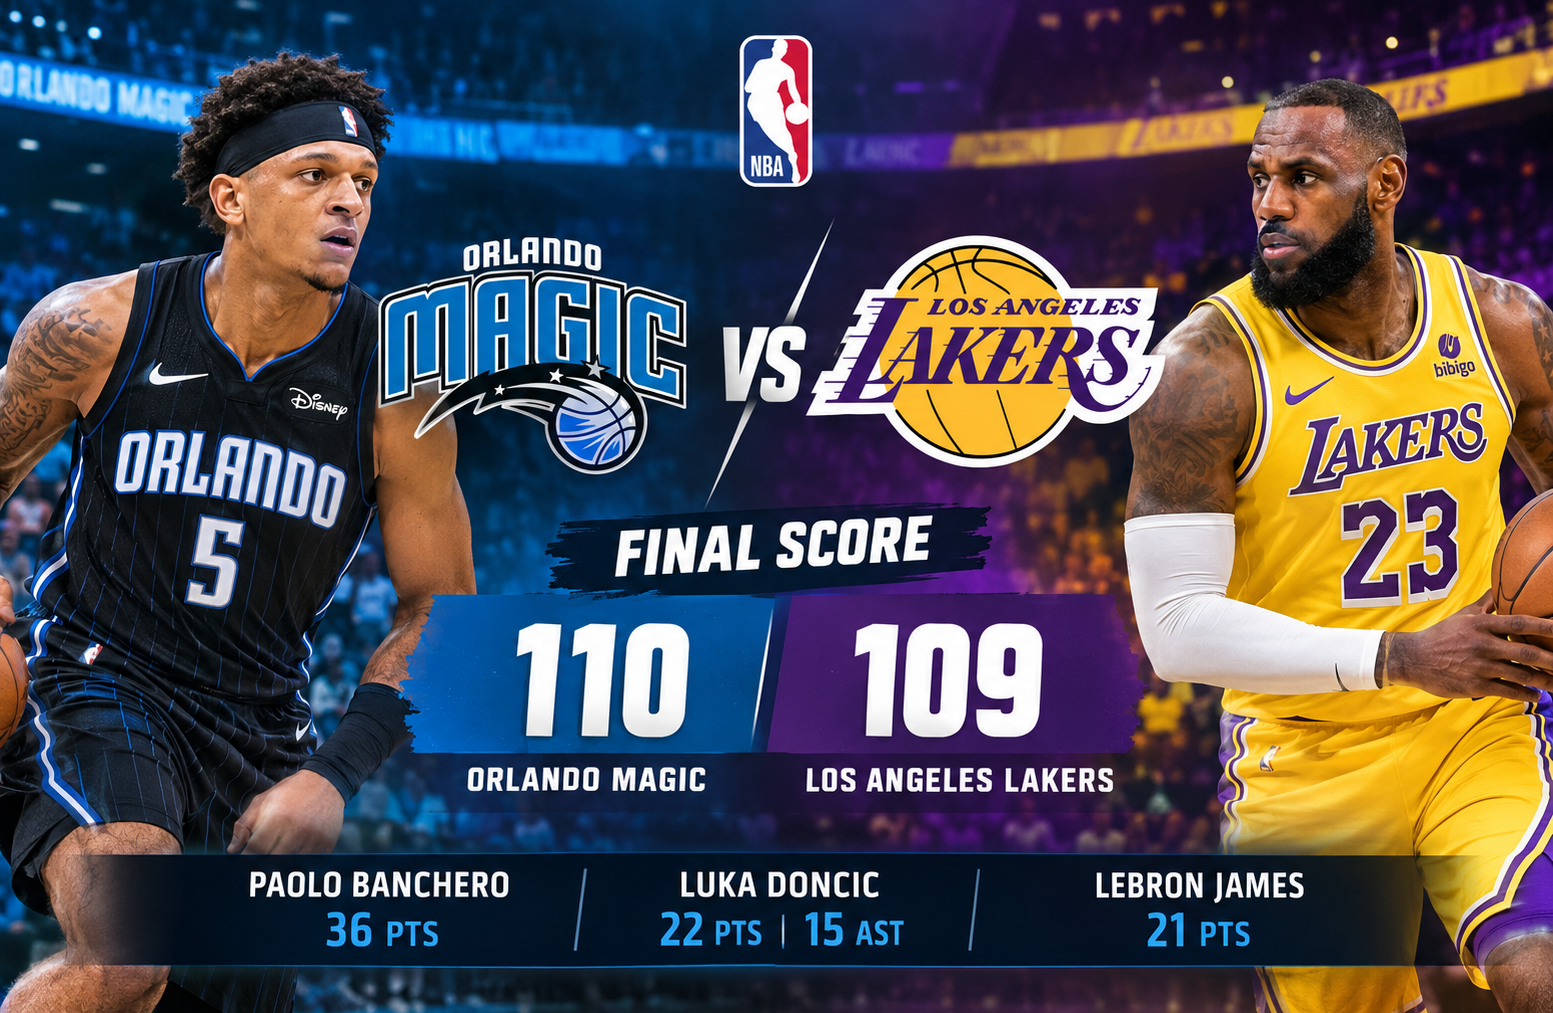
The lakers vs orlando magic match player stats from February 25, 2026, tell the story of a dramatic NBA contest decided by a single point. The Orlando Magic defeated the Los Angeles Lakers 110-109 at Crypto.com Arena in Los Angeles, California. Paolo Banchero led Orlando with 36 points, while Desmond Bane added 22 and Wendell Carter Jr. contributed 20 points and 11 rebounds. For Los Angeles, Luka Doncic recorded 22 points and 15 assists, LeBron James and Deandre Ayton scored 21 points apiece, and Austin Reaves finished with 18 points. Despite shooting a better percentage from the field, the Lakers could not protect their early lead. Orlando’s fourth-quarter scoring, rebounding advantage, and ability to capitalize on key possessions helped the visitors secure a narrow victory.
This game offers more than a final score. It provides a useful look at individual player production, team efficiency, offensive rebounding, playmaking, and the small statistical differences that can decide a close basketball game. By examining the supplied ESPN box-score data, readers can understand which players made the biggest contributions and why the Magic finished ahead.
Game Overview: Orlando Magic vs. Los Angeles Lakers
The matchup brought together two teams with different strengths. Los Angeles generated efficient shooting and relied heavily on Doncic’s playmaking, while Orlando combined balanced scoring from its leading players with a stronger presence on the offensive glass.
Match details
| Category | Details |
| Game date | February 25, 2026 |
| Venue | Crypto.com Arena |
| Location | Los Angeles, California |
| Final score | Orlando Magic 110, Los Angeles Lakers 109 |
| Winning team | Orlando Magic |
| Losing team | Los Angeles Lakers |
| Attendance | 18,997 |
| Orlando’s listed record | 31-26 |
| Lakers’ listed record | 34-23 |
| Orlando’s leading scorer | Paolo Banchero, 36 points |
| Lakers’ leading scorer | Luka Doncic, 22 points |
| Orlando’s leading rebounder | Wendell Carter Jr., 11 rebounds |
| Lakers’ leading rebounder | Deandre Ayton, 13 rebounds |
| Lakers’ leading playmaker | Luka Doncic, 15 assists |
The supplied game information identifies the contest as final and lists the official ESPN box score as the primary statistical reference. The result was especially notable because Orlando won on the road against a Lakers team that entered the game with the stronger overall record shown in the supplied data.
A one-point margin also means the final result should not be attributed to a single statistic without considering the whole game. Shooting, rebounds, turnovers, late-game execution, and defensive stops all contribute to the outcome.
Lakers vs Orlando Magic Match Player Stats: Complete Team Comparison
The team statistics reveal a close contest in which each side had a different advantage. Los Angeles shot more accurately overall, but Orlando collected more rebounds and committed fewer turnovers.
| Team statistic | Orlando Magic | Los Angeles Lakers |
| Points | 110 | 109 |
| Field goals | 43/94 | 40/83 |
| Field-goal percentage | 46% | 48% |
| Three-pointers | 7/29 | 9/29 |
| Three-point percentage | 24% | 31% |
| Free throws | 17/23 | 20/28 |
| Free-throw percentage | 74% | 71% |
| Total rebounds | 47 | 39 |
| Offensive rebounds | 12 | 7 |
| Defensive rebounds | 35 | 32 |
| Assists | 26 | 24 |
| Turnovers | 10 | 12 |
| Steals | 7 | 6 |
| Blocks | 5 | 8 |
| Personal fouls | 20 | 19 |
Several differences stand out.
First, the Lakers converted 48% of their field-goal attempts, compared with Orlando’s 46%. They also made two more three-pointers, shooting 9-for-29 from beyond the arc. Those numbers indicate that Los Angeles was more efficient in its overall shooting and perimeter accuracy.
Second, Orlando finished with eight more total rebounds. The Magic also collected five more offensive rebounds, creating additional opportunities to extend possessions after missed shots.
Third, Orlando committed two fewer turnovers. That difference mattered in a game decided by one point because each lost possession can remove an opportunity to score while potentially giving the opponent a chance to attack in transition.
The numbers do not prove that any single category directly caused the loss. They do, however, show how Orlando compensated for its lower shooting percentages by generating additional possessions and taking better care of the ball.
Quarter-by-Quarter Score Breakdown
The progression of the score helps explain how the game developed. Los Angeles started strongly, Orlando responded in the second quarter, and the Magic gradually took control of the closing period.
| Quarter | Orlando Magic | Los Angeles Lakers |
| First quarter | 25 | 33 |
| Second quarter | 28 | 23 |
| Third quarter | 26 | 24 |
| Fourth quarter | 31 | 29 |
| Total | 110 | 109 |
First quarter: Lakers establish an early lead
Los Angeles scored 33 points in the opening quarter, eight more than Orlando’s 25. The Lakers’ strong start gave them an early advantage and placed the Magic in a position where they needed to respond.
An eight-point opening-quarter margin can influence a team’s approach. A leading team may look to preserve its advantage, while the trailing side must find ways to score without allowing the deficit to grow.
Orlando’s eventual comeback demonstrated that the first quarter did not determine the final outcome.
Second quarter: Orlando changes the momentum
The Magic scored 28 points in the second quarter while limiting the Lakers to 23. That five-point advantage reduced the gap and helped Orlando recover from its slow start.
The quarter is important because it shows that Orlando did not depend exclusively on a strong finish. The visitors began making up ground before halftime, setting up a more competitive second half.
Third quarter: Orlando continues to close the gap
Orlando won the third quarter 26-24. The two-point advantage was smaller than its second-quarter margin, but it continued the Magic’s progress.
By this stage, the game had become a contest of consistency. Los Angeles needed another scoring run to rebuild its cushion, while Orlando needed to keep producing without giving away easy possessions.
Fourth quarter: Magic complete the comeback
Orlando scored 31 fourth-quarter points, compared with 29 for Los Angeles. That two-point advantage was enough to turn the game into a 110-109 victory.
The final quarter illustrates why full-game analysis is more useful than looking only at the opening score. Los Angeles had its best scoring quarter at the start, but Orlando outscored the Lakers across each of the next three quarters.
The Magic’s 31-point finish was particularly important because the game ended with only one point separating the teams. The supplied summary does not include the complete final-possession sequence, so the exact play that determined the result should not be inferred from the quarter totals alone.
Orlando Magic Player Stats and Individual Performances
Orlando’s victory was built around three major scoring contributions. Paolo Banchero led the attack, Desmond Bane supplied secondary scoring and playmaking, and Wendell Carter Jr. contributed both points and rebounds.
Paolo Banchero: 36 points
Banchero was Orlando’s leading scorer with 36 points. His total represented the highest individual scoring figure listed for either team in the supplied game data.
A performance of this size gives an offense a dependable scoring option when possessions become difficult. A leading scorer can help keep a team competitive through half-court possessions, defensive adjustments, and stretches when outside shots are not falling.
Banchero’s listed plus/minus was +6, meaning Orlando outscored Los Angeles by six points during the minutes he was on the floor. This supports the view that his contribution was valuable beyond his personal point total, although plus/minus also reflects the performance of teammates and opponents sharing those minutes.
He also recorded six assists, tying Bane for the team lead in that category. The combination of scoring and passing made Banchero central to Orlando’s offensive production.
Desmond Bane: 22 points and six assists
Bane finished with 22 points and six assists. His scoring gave Orlando a strong second option behind Banchero, reducing the pressure on one player to create every important basket.
His six assists also helped connect Orlando’s scoring attack. When a defense focuses on a high-volume scorer, secondary creators can take advantage of openings by making passes, attacking space, or finishing opportunities themselves.
Bane’s listed plus/minus was +5. Together, Banchero and Bane accounted for 58 points, providing more than half of Orlando’s 110-point total.
That combined output was a defining feature of the Magic’s offense. It also highlights why player statistics should be considered together rather than treating the leading scorer as the sole explanation for a win.
Wendell Carter Jr.: 20 points and 11 rebounds
Carter delivered one of Orlando’s most complete statistical performances. He scored 20 points and recorded 11 rebounds, giving him a double-double.
His rebounding was particularly relevant in a game where Orlando finished with an eight-rebound advantage over Los Angeles. Although the team total cannot be attributed to one player, Carter’s work on the glass was a major individual contribution.
He also provided scoring from the frontcourt, complementing Banchero’s and Bane’s production. A center who can score and secure rebounds gives an offense more ways to respond to defensive pressure.
Carter’s listed plus/minus was 0, meaning the overall score was even during his time on the floor. That figure does not diminish his individual performance. It simply indicates that the teams scored the same number of points during those minutes.
Anthony Black and Tristan da Silva
Anthony Black and Tristan da Silva were listed among Orlando’s starters. Black recorded a plus/minus of +2, while da Silva finished at -6.
Plus/minus should not be used as a complete player rating. It does not distinguish between an individual mistake, a teammate’s missed assignment, or a strong opposing possession. Without the full individual box-score lines and play-by-play details, it would be inaccurate to assign either player a specific offensive or defensive impact beyond the figures provided.
Their inclusion in the starting lineup nevertheless provides important context for Orlando’s rotation and the group that opened the contest.
Orlando’s bench and rotation
The supplied lineup lists Jonathan Isaac, Moritz Wagner, Jevon Carter, and Jett Howard among Orlando’s bench players. Jase Richardson, Jamal Cain, Noah Penda, and Goga Bitadze were listed as DNP, or did not play, by coach’s decision.
A player listed as DNP should not be treated as having contributed on-court statistics in this game. Likewise, a bench listing alone does not establish how many minutes a player received or what impact that player had.
For a complete assessment of Orlando’s rotation, minutes played and individual bench statistics would be necessary. The supplied data is sufficient to identify the listed roster and leading performers, but it does not justify inventing unprovided bench totals.
Los Angeles Lakers Player Stats and Individual Performances
The Lakers received strong contributions from Luka Doncic, LeBron James, Deandre Ayton, and Austin Reaves. Their combined production kept Los Angeles within one point of Orlando despite the Magic’s advantage in rebounds and turnovers.
Luka Doncic: 22 points and 15 assists
Doncic led Los Angeles with 22 points and 15 assists. His assist total was the highest listed for either team, making him the game’s most productive facilitator according to the supplied data.
Assists help show how a player creates scoring opportunities for teammates. Fifteen assists indicate that Doncic played a major role in generating Los Angeles’s offense rather than relying exclusively on his own scoring.
His combination of 22 points and 15 assists highlights two different responsibilities. He was expected to contribute as a scorer while also organizing possessions and creating opportunities for other Lakers.
Doncic’s listed plus/minus was +1. This means Los Angeles scored one more point than Orlando during his minutes on the floor. It does not mean every possession he played was successful, nor does it measure the full value of his playmaking.
The key takeaway is that his statistical contribution was substantial, but it was not enough to overcome Orlando’s overall possession advantage.
LeBron James: 21 points
James scored 21 points, matching Ayton’s total and finishing just one point behind Doncic. His contribution gave the Lakers another reliable scoring source alongside their primary playmaker.
Multiple high-scoring players can make an offense harder to defend because opponents cannot focus on a single option. James’s 21 points helped Los Angeles maintain its offensive production throughout the game.
His listed plus/minus was -1. That figure reflects a one-point scoring disadvantage during his minutes, but it should not be interpreted as proof that he personally caused the defeat.
A full evaluation would require additional information, including shooting attempts, rebounds, assists, turnovers, defensive matchups, and the timing of his contributions.
Deandre Ayton: 21 points and 13 rebounds
Ayton produced 21 points and 13 rebounds, making him Los Angeles’s leading rebounder. His 13 boards were two more than Carter’s 11, despite Orlando finishing with the stronger team rebounding total.
This distinction is important. An individual can lead both teams in a category while his team loses that statistical battle overall. Orlando’s other players collectively secured enough rebounds to establish an eight-board advantage.
Ayton’s scoring also made him one of the Lakers’ most productive offensive players. His 21 points, combined with James’s 21 and Doncic’s 22, gave Los Angeles three players with at least 21 points.
His listed plus/minus was -2. That small negative figure describes the score during his minutes, not the complete quality of his performance.
Austin Reaves: 18 points
Reaves scored 18 points, providing another significant contribution to the Lakers’ offense. His total placed him fourth among the team’s leading scorers in the supplied summary.
His scoring helped support the production of Doncic, James, and Ayton. However, the available information does not provide his complete shooting line, turnover total, or defensive statistics. A more detailed assessment of his efficiency would require those figures.
Reaves’s listed plus/minus was -4. This indicates that the Lakers were outscored by four points during his minutes, but the number alone cannot explain why.
Marcus Smart and the Lakers’ bench
Marcus Smart was listed as a Lakers starter and recorded a plus/minus of +8, the highest listed among the Lakers’ starting players. This is a useful team-context statistic, but it does not independently establish his defensive impact or overall effectiveness.
The supplied bench list includes Maxi Kleber, Rui Hachimura, Jarred Vanderbilt, Jake LaRavia, Luke Kennard, Drew Timme, Dalton Knecht, and Kobe Bufkin. Drew Timme, Dalton Knecht, and Kobe Bufkin were listed as DNP by coach’s decision.
Because individual bench scoring and playing time are not included in the supplied summary, it would be misleading to assign specific totals or claim that one reserve rotation determined the result.
Head-to-Head Player Comparison
Comparing the leading players from both teams makes it easier to understand where each side found its production.
| Category | Orlando Magic | Los Angeles Lakers |
| Leading scorer | Paolo Banchero, 36 | Luka Doncic, 22 |
| Second-leading scorer | Desmond Bane, 22 | LeBron James, 21 |
| Third-leading scorer | Wendell Carter Jr., 20 | Deandre Ayton, 21 |
| Leading rebounder | Wendell Carter Jr., 11 | Deandre Ayton, 13 |
| Leading playmaker | Banchero and Bane, 6 each | Doncic, 15 |
| Total team rebounds | 47 | 39 |
| Total team assists | 26 | 24 |
| Total team turnovers | 10 | 12 |
Scoring: Orlando’s leading scorer made the difference
Banchero’s 36 points exceeded Doncic’s 22 by 14 points. That comparison does not mean Banchero automatically had the better all-around performance, since Doncic contributed 15 assists. It does show that Orlando received a much larger scoring total from its top individual scorer.
The Magic also had three players score at least 20 points. The Lakers had three players score at least 21, but their leading total was lower than Banchero’s.
Playmaking: Doncic led the game
Doncic’s 15 assists were a major individual distinction. Orlando’s two leading assist totals were six apiece, meaning Doncic recorded three times as many assists as either Banchero or Bane individually.
However, Orlando finished with 26 team assists to Los Angeles’s 24. The team totals demonstrate why individual and collective statistics need to be separated. One player can lead an individual category while the opposing team finishes ahead overall.
Rebounding: Orlando won the team battle
Ayton’s 13 rebounds were the highest individual total listed, but Orlando’s 47 team rebounds exceeded the Lakers’ 39.
Carter’s 11 rebounds helped Orlando, and the Magic’s 12 offensive rebounds created extra opportunities. This team-wide advantage was one of the clearest statistical differences in the contest.
Turnovers: Orlando protected possessions better
Orlando committed 10 turnovers, compared with 12 for Los Angeles. The difference was modest, but in a one-point game, avoiding even a couple of lost possessions can be meaningful.
Turnover totals do not reveal the precise value of every possession. Some turnovers lead directly to fast-break points, while others result in a dead-ball reset. The supplied summary does not identify the exact scoring consequences of each turnover, so those details should not be assumed.
Shooting Efficiency and Offensive Production
Shooting percentages provide a useful starting point for comparing offensive execution, but they do not explain the full outcome.
Field-goal percentage
The Lakers made 40 of 83 field-goal attempts, while Orlando converted 43 of 94. The supplied percentages were 48% for Los Angeles and 46% for Orlando.
Los Angeles therefore shot more accurately from the field. Orlando, however, attempted 11 more field goals and made three more baskets overall.
That combination helps explain how a team with a lower field-goal percentage can still score more points. Efficiency matters, but the number of opportunities matters too.
Three-point shooting
The Lakers made nine of 29 three-point attempts, compared with seven of 29 for Orlando. Los Angeles converted approximately 31% of its attempts, while Orlando made approximately 24%.
The Lakers made two additional three-pointers, which contributed six points from beyond the arc relative to Orlando’s total. This was an advantage for Los Angeles, but it was not enough to create a winning margin.
Free throws
Los Angeles made 20 of 28 free throws, while Orlando made 17 of 23. The Lakers converted three more free throws and attempted five more.
The supplied percentages were 71% for the Lakers and 74% for the Magic. Although Orlando had the better percentage, Los Angeles gained more total points at the line because it made more free throws.
This is another example of why percentages and totals should be read together.
What the shooting numbers reveal
The shooting comparison presents a clear contrast:
- Los Angeles had the higher field-goal percentage.
- Los Angeles made more three-pointers.
- Los Angeles made more free throws.
- Orlando made more field goals overall.
- Orlando scored one more point in the final result.
The Magic’s victory therefore cannot be explained by superior shooting accuracy. Their higher field-goal attempt volume, stronger rebounding numbers, and lower turnover count offer additional context for the result.
Rebounding and Second-Chance Opportunities
Rebounding was one of the most significant team-level differences in the game.
Orlando collected 47 rebounds, eight more than Los Angeles’s 39. The Magic also recorded 12 offensive rebounds, compared with seven for the Lakers.
Why offensive rebounds matter
An offensive rebound gives a team another chance to score after a missed field goal or free throw, subject to the rules governing the possession. It can extend an attack and force the defense to continue working rather than immediately starting its own offense.
Orlando’s five-rebound advantage on the offensive glass suggests that the Magic created more opportunities to continue possessions. Those opportunities can be particularly valuable when a team is not shooting efficiently.
The numbers do not tell us exactly how many points Orlando scored after offensive rebounds. That would require play-by-play or possession-level data. Still, the difference in offensive rebounds is an important part of the statistical explanation for the result.
Defensive rebounds and possession control
Orlando also recorded 35 defensive rebounds, compared with Los Angeles’s 32. This difference was smaller than the overall rebounding gap, but it contributed to the Magic’s advantage in total boards.
Defensive rebounds usually end an opponent’s possession and allow the team to begin its own attack. Securing them consistently can limit second-chance scoring and help control the pace of a game.
The Lakers had individual success through Ayton’s 13 rebounds, but Orlando’s collective rebounding effort was stronger.
Assists, Turnovers, Steals, and Blocks
Beyond scoring and rebounding, the box score shows how both teams handled possession management and defensive activity.
Assists: efficient ball movement
Orlando recorded 26 assists, while Los Angeles finished with 24. The Magic’s total was slightly higher despite Doncic’s individual lead of 15 assists.
Assists can indicate how often scoring plays result from a teammate’s pass, although they do not capture every valuable action. Screens, cuts, spacing, and passes that lead to free throws can contribute to offensive success without appearing as assists.
Turnovers: a small but relevant difference
The Magic committed 10 turnovers, and the Lakers committed 12. Orlando’s lower total suggests that it gave away fewer possessions.
In a game separated by one point, this category deserves attention. However, a two-turnover difference should not be treated as the sole reason for the result. The value of each possession depends on when the turnover occurred and what followed.
Steals: Orlando records seven
Orlando collected seven steals, one more than Los Angeles’s six. Steals can end an opposing possession and sometimes create transition scoring opportunities.
The totals show a slight advantage for the Magic, but they do not reveal whether those steals produced fast-break baskets or other direct scoring benefits.
Blocks: Lakers protect the rim
Los Angeles recorded eight blocks, compared with Orlando’s five. The Lakers therefore had the advantage in this defensive category.
Blocks can disrupt attempts near the basket, but they are not a complete measure of rim protection. Defensive positioning, altered shots, contest quality, and rebounding after a missed attempt are also important.
The Lakers’ higher block total demonstrates that they made meaningful defensive plays, even though those plays did not translate into a victory.
Why the Orlando Magic Won by One Point
The Magic’s victory is best understood as the combined result of scoring leadership, rebounding, and possession management rather than a single decisive statistical category.
1. Banchero delivered the game’s biggest scoring performance
Banchero scored 36 points, 14 more than the Lakers’ leading scorer. His production gave Orlando a high-scoring focal point and helped the team remain competitive after its first-quarter deficit.
2. Orlando controlled the rebounding battle
The Magic finished with 47 rebounds to the Lakers’ 39. Their five-rebound advantage on the offensive glass created additional opportunities to extend possessions.
3. The Magic committed fewer turnovers
Orlando’s 10 turnovers were below Los Angeles’s 12. Fewer turnovers can help preserve scoring opportunities, especially in close contests where every possession carries added importance.
4. Orlando improved after the opening quarter
The Lakers won the first quarter by eight points. Orlando outscored them in each of the remaining three quarters, gradually recovering from that early disadvantage.
5. Los Angeles’s shooting advantage was not enough
The Lakers had better field-goal and three-point percentages, made more three-pointers, and converted more free throws. Yet Orlando attempted more field goals and finished with more total rebounds.
This contrast is the central lesson from the game: a team can shoot more accurately and still lose if the opponent creates more opportunities and maintains a slight edge in other parts of the game.
What cannot be concluded from the available data
The supplied summary does not include every player’s minutes, complete individual shooting lines, detailed play-by-play events, or the final possession sequence. As a result, it would be inaccurate to identify a particular missed shot, defensive mistake, or coaching decision as the definitive cause of the defeat.
The available statistics support a clear team-level explanation, but they do not justify inventing details about the final seconds.
Season Series: Lakers vs. Magic in 2026
The supplied game data also lists a second meeting between the teams on March 22, 2026.
| Game | Result |
| February 25, 2026 | Orlando Magic 110, Los Angeles Lakers 109 |
| March 22, 2026 | Los Angeles Lakers 105, Orlando Magic 104 |
According to the supplied results, Orlando won the February meeting by one point, while Los Angeles won the March game by one point.
That makes the two listed results an especially close pair. Each team won once, and the combined scores were 214 points for Orlando and 214 for Los Angeles across the two games.
The February matchup was defined by Banchero’s 36-point performance and Orlando’s rebounding advantage. The March result, as provided, shows that the Lakers later earned a narrow win of their own. The March player statistics were not included in the supplied data, so no further individual comparisons should be made without consulting that game’s box score.
For readers tracking a season series, it is important to distinguish between one game’s box score and the results of all meetings. A single game shows what happened on one night; the season series provides broader context.
How to Read NBA Match Player Statistics Correctly
A box score is most useful when its categories are interpreted together. Readers can avoid common mistakes by following a few simple principles.
Separate individual production from team results
A player may lead in points, rebounds, or assists while the team loses. Doncic’s 15 assists and Ayton’s 13 rebounds were strong individual figures, but Orlando won the overall rebounding battle and finished with more team assists.
Compare totals with percentages
Shooting percentage measures accuracy, while the total number of makes and attempts shows volume. The Lakers had the better shooting percentages, but Orlando attempted more field goals and scored one more point.
Treat plus/minus as context, not a verdict
Plus/minus measures the scoring margin during a player’s time on the court. It does not isolate that player’s contribution from teammates, opponents, lineups, or game circumstances.
Check whether the data is complete
The supplied statistics identify leading scorers, rebounders, assist leaders, team totals, and selected plus/minus values. They do not contain every individual player’s complete box score.
A trustworthy analysis should distinguish confirmed numbers from missing information rather than filling gaps with guesses.
Use official records for verification
For the complete box score, game details, and additional statistical context, consult the official ESPN game box score. Checking the original record is especially useful when verifying individual shooting totals, minutes, substitutions, or late-game events.
Frequently Asked Questions
1. Who won the Lakers vs Orlando Magic game on February 25, 2026?
The Orlando Magic defeated the Los Angeles Lakers 110-109 at Crypto.com Arena in Los Angeles, California. Orlando outscored Los Angeles 31-29 in the fourth quarter to finish one point ahead.
2. Who scored the most points in the game?
Paolo Banchero was the game’s leading scorer with 36 points for Orlando. Desmond Bane scored 22 points, and Wendell Carter Jr. added 20.
3. How many points and assists did Luka Doncic record?
Luka Doncic recorded 22 points and 15 assists for the Lakers. He was Los Angeles’s leading scorer and its leading assist provider in the supplied game statistics.
4. Which player had the most rebounds?
Deandre Ayton led the Lakers with 13 rebounds. Wendell Carter Jr. led Orlando with 11 rebounds and also scored 20 points.
5. Why did the Magic win despite shooting a lower percentage?
Orlando shot 46% from the field, compared with the Lakers’ 48%, but collected 47 rebounds to Los Angeles’s 39 and committed 10 turnovers compared with 12. The Magic also outscored the Lakers in the final three quarters.
6. What was the Lakers vs Magic season-series result in the supplied data?
The supplied results show Orlando winning 110-109 on February 25, 2026, and Los Angeles winning 105-104 on March 22, 2026. Each team therefore won one of the two listed games.
Conclusion
The Lakers vs Orlando Magic matchup on February 25, 2026, was a close contest that highlighted the importance of balanced team performance. Orlando secured a 110-109 road victory behind Paolo Banchero’s 36 points, Desmond Bane’s 22 points, and Wendell Carter Jr.’s 20 points and 11 rebounds.
Los Angeles received an impressive playmaking performance from Luka Doncic, who finished with 22 points and 15 assists. LeBron James and Deandre Ayton each scored 21 points, while Ayton collected a team-high 13 rebounds. The Lakers also held advantages in field-goal percentage, three-point shooting, free throws made, and blocks.
Orlando’s eight-rebound advantage, five additional offensive rebounds compared with Los Angeles, and two fewer turnovers helped explain how the Magic overcame their less accurate shooting. Their improvement after the first quarter was equally important, as they outscored the Lakers in each of the final three periods.
The most useful takeaway from the game is that individual excellence and team efficiency are not always the same thing. Doncic led the game in assists, Ayton led the Lakers in rebounds, and Banchero delivered the highest scoring total. Yet Orlando’s combined performance across scoring, rebounding, and ball security produced the winning result.
For readers reviewing NBA box scores, this matchup demonstrates why points, shooting percentages, rebounds, assists, turnovers, and quarter-by-quarter scoring should be considered together. Each statistic reveals a different part of the game, and their combined picture provides a more reliable explanation than the final score alone.