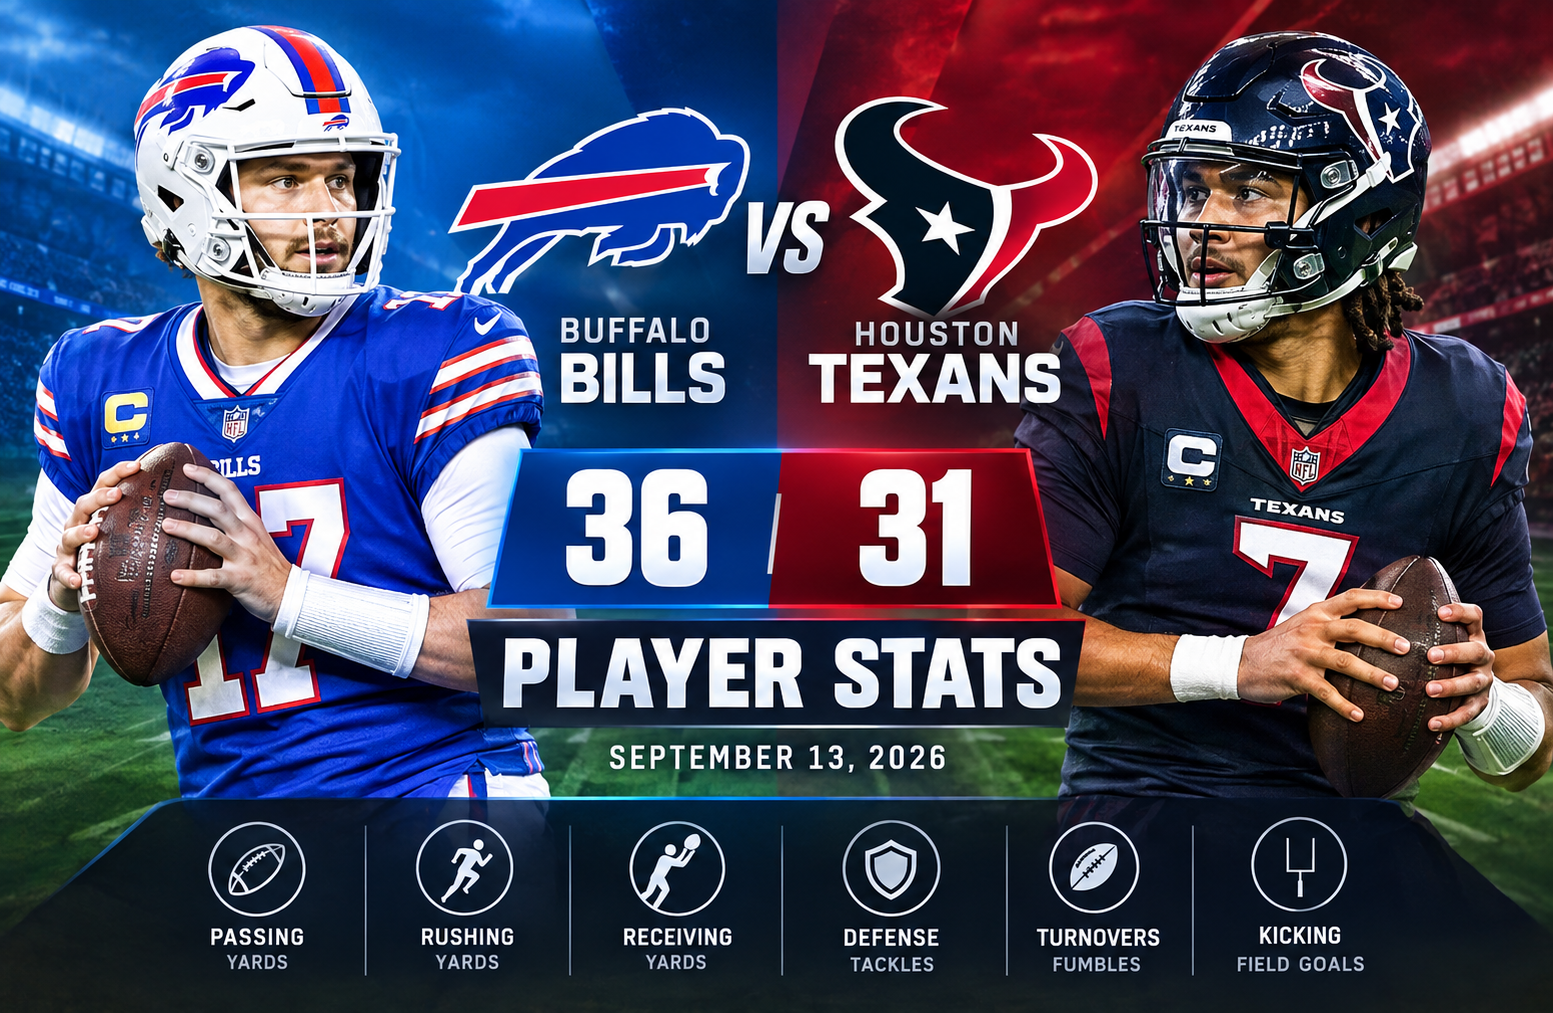
Buffalo Bills vs Texans Match Player Stats
The buffalo bills vs texans match player stats from the September 13, 2026 matchup tell the story of a high-scoring game decided by Buffalo’s explosive passing production, Josh Allen’s efficiency, and a defense that created pressure without allowing a single interception. The Bills defeated the Houston Texans 36-31 after overcoming a 7-3 first-quarter deficit and producing 21 points in the second quarter.
Buffalo Bills vs Texans Match Player Stats
The final score was Buffalo Bills 36, Houston Texans 31. Buffalo moved to 1-0 overall and 1-0 on the road, while Houston opened the season 0-1 at home.
| Team | Q1 | Q2 | Q3 | Q4 | Final |
| Buffalo Bills | 3 | 21 | 3 | 9 | 36 |
| Houston Texans | 7 | 14 | 0 | 10 | 31 |
The scoring pattern is important. Houston started faster, but Buffalo’s second-quarter surge changed the game. The Bills then held the Texans scoreless in the third quarter before Houston mounted a fourth-quarter response.
The five-point final margin also shows why the individual statistics matter. This was not a one-sided contest. Both offenses produced significant yardage, and both quarterbacks finished without an interception.
Josh Allen vs C.J. Stroud Passing Stats
The quarterback comparison is one of the clearest ways to understand the game.
Josh Allen
Josh Allen completed 20 of 29 passes for 334 yards, with two touchdowns and no interceptions. He was sacked twice and finished with a 130.5 passer rating.
His completion percentage was approximately 69.0%, while his average passing gain was about 16.7 yards per completion.
That combination of accuracy and downfield production was a major part of Buffalo’s offensive success.
Allen also contributed on the ground:
- 6 rushing attempts
- 23 rushing yards
- 2 rushing touchdowns
His rushing touchdowns were particularly valuable because they added another scoring dimension to an already productive passing performance.
C.J. Stroud
C.J. Stroud completed 26 of 38 attempts for 274 yards, producing two touchdowns and no interceptions.
He was sacked three times and recorded a 106.7 passer rating.
Stroud’s completion rate was approximately 68.4%, very close to Allen’s mark. The major statistical difference came through explosive passing efficiency. Allen averaged considerably more yards per completed pass.
Stroud still produced a strong statistical line, particularly considering that Houston had to respond after Buffalo’s second-quarter scoring burst.
Quarterback comparison
| Statistic | Josh Allen | C.J. Stroud |
| Completions | 20 | 26 |
| Attempts | 29 | 38 |
| Completion % | 69.0% | 68.4% |
| Passing yards | 334 | 274 |
| TD passes | 2 | 2 |
| INT | 0 | 0 |
| Sacks | 2 | 3 |
| Passer rating | 130.5 | 106.7 |
| Rushing TDs | 2 | 0 |
The numbers show two different offensive approaches. Houston completed more passes, but Buffalo generated more yardage with fewer attempts.
Buffalo Bills Receiving Statistics
Buffalo’s receiving production was led by Dalton Kincaid, DJ Moore, Khalil Shakir, and Joshua Palmer.
Dalton Kincaid
Dalton Kincaid produced one of the biggest individual receiving performances in the game.
He recorded:
- 5 receptions
- 130 receiving yards
- 26.0 yards per reception
A 26.0-yard average is especially significant because it indicates that Kincaid was not simply used for short, possession-oriented routes. His production included substantial chunk plays.
DJ Moore
DJ Moore finished with:
- 5 receptions
- 100 yards
- 1 touchdown
His 100-yard performance gave Buffalo another major receiving option alongside Kincaid.
Khalil Shakir
Shakir recorded:
- 4 receptions
- 50 yards
His production complemented the larger performances from Kincaid and Moore.
Joshua Palmer
Joshua Palmer had one reception for 34 yards and a touchdown.
That means Buffalo’s four highlighted receiving contributors accounted for 314 receiving yards and two touchdowns based on the supplied box-score figures.
Houston Texans Receiving Statistics
Houston’s passing attack was led by Nico Collins.
Nico Collins
Collins finished with:
- 7 receptions
- 75 yards
- 1 touchdown
He was a central part of Stroud’s passing production and supplied one of Houston’s two receiving touchdowns.
Jaylin Noel
Jaylin Noel recorded two catches for 53 yards.
His 26.5-yard average per reception was one of the most explosive receiving figures on Houston’s side.
Dalton Schultz
Schultz contributed:
- 4 receptions
- 35 yards
Xavier Hutchinson
Hutchinson finished with:
- 3 receptions
- 32 yards
Houston ultimately recorded 26 receptions for 274 receiving yards and two touchdowns.
Buffalo Bills Rushing Stats
Buffalo recorded 21 rushing attempts for 86 yards and two touchdowns.
James Cook III led the Bills in rushing volume:
| Player | Carries | Yards | Average | TD |
| James Cook III | 13 | 57 | 4.4 | 0 |
| Josh Allen | 6 | 23 | 3.8 | 2 |
Cook’s 57 yards accounted for the largest share of Buffalo’s rushing yardage. Allen, however, supplied both rushing touchdowns.
That distinction matters when evaluating the overall offensive performance. Cook provided the bulk of the traditional rushing workload, while Allen’s rushing production directly contributed to the scoreboard.
Houston Texans Rushing Stats
Houston ran the ball more frequently than Buffalo, recording 32 rushing attempts for 124 yards and two touchdowns.
David Montgomery led the Texans with:
- 20 carries
- 60 yards
- 2 touchdowns
Woody Marks added:
- 9 carries
- 42 yards
- 4.7 yards per carry
Houston’s rushing attack therefore produced considerably more total yardage than Buffalo’s ground game.
Yet the Texans still lost because the difference was made elsewhere, particularly through Buffalo’s passing efficiency and Houston’s two lost fumbles.
Buffalo Bills vs Texans Match Player Stats: Defensive Leaders
The defensive numbers provide another important layer to the box score.
Buffalo recorded:
- 92 total tackles
- 40 solo tackles
- 3 sacks
- 8 tackles for loss
- 2 passes defended
- 9 quarterback hits
Houston recorded:
- 57 total tackles
- 29 solo tackles
- 2 sacks
- 3 tackles for loss
- 5 passes defended
- 4 quarterback hits
The difference in quarterback pressure stands out. Buffalo recorded nine quarterback hits compared with four from Houston.
Terrel Bernard
Terrel Bernard led Buffalo with 12 total tackles, including six solo tackles.
His tackle total made him the team’s leading individual tackler.
Dorian Williams
Dorian Williams registered:
- 9 total tackles
- 4 solo tackles
C.J. Gardner-Johnson
C.J. Gardner-Johnson recorded:
- 8 total tackles
- 6 solo tackles
Deone Walker
Deone Walker produced:
- 6 total tackles
- 3 solo tackles
- 1 sack
- 2 tackles for loss
- 1 quarterback hit
Greg Rousseau
Greg Rousseau was one of Buffalo’s most disruptive defenders.
He finished with:
- 4 total tackles
- 4 solo tackles
- 2 sacks
- 2 tackles for loss
- 1 pass defended
- 5 quarterback hits
The five quarterback hits are particularly notable because they indicate pressure beyond the two recorded sacks.
Houston Texans Defensive Leaders
Azeez Al-Shaair led Houston with 8 total tackles and five solo tackles.
Reed Blankenship recorded seven total tackles and four solo tackles.
Calen Bullock finished with:
- 6 total tackles
- 5 solo tackles
- 1 pass defended
Jalen Pitre recorded:
- 6 total tackles
- 4 solo tackles
- 1 pass defended
Jadeveon Clowney produced:
- 1 total tackle
- 1 solo tackle
- 1 sack
- 1 tackle for loss
- 2 quarterback hits
Houston’s defense did generate two sacks, but Buffalo’s nine quarterback hits show that the Bills created more consistent disruption.
Turnovers and Ball Security
Turnovers were one of the most important statistical differences.
Neither team intercepted a pass.
However, both teams recorded two fumbles, and the recovery results were very different:
| Team | Fumbles | Fumbles Lost |
| Buffalo Bills | 2 | 0 |
| Houston Texans | 2 | 2 |
Buffalo protected the football despite having two fumbles.
Houston lost both of its fumbles.
That gives Buffalo a +2 turnover margin in the game, even though there were no interceptions.
For a five-point game, that is a significant detail. A turnover does not automatically translate into points, but losing possession twice while playing a high-scoring opponent can have a major effect on the final result.
Special Teams Player Stats
Special teams also contributed measurable value.
Tyler Bass
Buffalo kicker Tyler Bass was perfect on field goals and extra points:
- Field goals: 3/3
- Field-goal percentage: 100%
- Long field goal: 46 yards
- Extra points: 3/3
- Total points: 12
His 12 points represented one-third of Buffalo’s 36-point total.
Ka’imi Fairbairn
Houston’s Ka’imi Fairbairn finished:
- Field goals: 1/1
- Field-goal percentage: 100%
- Long field goal: 58 yards
- Extra points: 4/4
- Total points: 7
His longest successful kick was 58 yards.
Buffalo punting
Tommy Doman Jr. recorded:
- 2 punts
- 109 total punt yards
- 54.5-yard average
- 63-yard long
Houston punting
Kai Kroeger recorded:
- 4 punts
- 208 total punt yards
- 52.0-yard average
- 59-yard long
The Bills punted less frequently, which fits the overall picture of an offense that sustained enough production to avoid as many fourth-down possessions ending in punts.
Kick and Punt Return Statistics
Buffalo returned five kickoffs for 133 yards, averaging 26.6 yards per return.
Houston had eight kick returns for 202 yards, averaging 25.3 yards per return.
Greg Dortch handled Buffalo’s listed punt-return work with:
- 2 returns
- 10 yards
- 5.0-yard average
Houston recorded no punt returns in the supplied statistics.
The return numbers show that Houston generated more total kickoff-return yardage, but Buffalo’s overall offensive efficiency mattered more to the final score.
What the Numbers Reveal About the Game
Looking beyond the headline score reveals several important patterns.
Buffalo won the passing efficiency battle
The Bills gained 334 passing yards on 29 attempts.
Houston gained 274 passing yards on 38 attempts.
That is a difference of 60 passing yards despite Buffalo throwing nine fewer attempts.
Allen’s 130.5 rating also exceeded Stroud’s 106.7 rating.
Houston won the rushing yardage battle
Houston produced 124 rushing yards on 32 attempts.
Buffalo produced 86 rushing yards on 21 attempts.
The Texans therefore gained 38 more rushing yards.
This is a useful reminder that winning the rushing-yardage category does not necessarily determine the game.
Buffalo created more defensive pressure
Buffalo recorded three sacks compared with Houston’s two.
The bigger difference came in quarterback hits:
- Buffalo: 9
- Houston: 4
Buffalo also recorded eight tackles for loss compared with three for Houston.
Buffalo avoided costly turnovers
Both teams fumbled twice.
The difference was that Buffalo lost neither fumble while Houston lost both.
There were no interceptions.
That produced a clean contrast: both quarterbacks protected the football through the air, but Houston’s team-level ball security created two additional possessions for Buffalo.
How the Second Quarter Changed the Game
The first quarter ended with Houston ahead 7-3.
Then Buffalo scored 21 points in the second quarter, while Houston scored 14.
The 21-point explosion gave the Bills a 24-21 halftime advantage.
That was the game’s first major momentum shift.
Buffalo added another three points in the third quarter while holding Houston scoreless. As a result, the Bills entered the fourth quarter with a 27-21 lead.
Houston responded with 10 fourth-quarter points, but Buffalo added nine of its own and preserved the five-point victory.
The quarter-by-quarter progression was therefore:
- Houston established an early lead.
- Buffalo produced its biggest offensive quarter.
- Buffalo’s defense shut Houston out in the third.
- Houston fought back in the fourth.
- Buffalo held on for the 36-31 win.
The Importance of Explosive Plays
One of the clearest themes in the player statistics is Buffalo’s ability to generate large chunks of passing yardage.
Kincaid averaged 26.0 yards per reception, while Moore averaged 20.0 yards per reception based on the supplied statistics.
Allen’s 334 passing yards on only 29 attempts also demonstrates how much yardage Buffalo generated without needing a high volume of throws.
Houston, by contrast, completed 26 passes, but its 274 passing yards were spread across more attempts.
This difference helps explain why the Bills could score 36 points while running fewer offensive rushing attempts.
A Closer Look at Offensive Balance
It would be inaccurate to describe the game as simply a passing victory for Buffalo.
The Bills received meaningful contributions from multiple areas:
- Allen passed for 334 yards and two touchdowns.
- Allen added two rushing touchdowns.
- Kincaid produced 130 receiving yards.
- Moore reached 100 receiving yards and scored once.
- Cook supplied 57 rushing yards.
- Bass scored 12 points.
- Buffalo’s defense generated three sacks.
Houston also had several strong statistical contributors:
- Stroud passed for 274 yards and two touchdowns.
- Montgomery rushed for 60 yards and two touchdowns.
- Marks averaged 4.7 yards per carry.
- Collins caught seven passes for 75 yards and a touchdown.
- Fairbairn made a 58-yard field goal.
The difference was therefore not a lack of individual production from Houston. It was how the production translated into total possessions, scoring opportunities, and points.
Player Stats Worth Tracking After This Game
For readers using this box score to evaluate future performances, several numbers deserve attention.
Josh Allen’s efficiency
Allen’s combination of 334 yards, two passing touchdowns, zero interceptions, and a 130.5 rating is the most prominent quarterback statistic from the game.
His two rushing touchdowns also made his total scoring contribution especially significant.
Dalton Kincaid’s receiving workload
Kincaid’s 130 yards on five receptions immediately stands out.
The 26.0-yard average is also an important indicator of how aggressively Buffalo used him in this matchup.
Greg Rousseau’s pass rush
Rousseau recorded two sacks and five quarterback hits.
That production suggests that the defensive line was capable of affecting Houston’s passing game even when a play did not end in a sack.
Houston’s turnover problem
The Texans’ two lost fumbles were more consequential than the raw number of fumbles suggests.
Both teams fumbled twice, but only Houston surrendered possession.
Buffalo Bills vs Texans Match Player Stats: Key Takeaways
The most useful way to read this box score is to look at the interaction between categories rather than focusing on one statistic.
Buffalo did not dominate every statistical category.
Houston had:
- More rushing yards
- More rushing attempts
- More completions
- More total rushing touchdowns
Buffalo nevertheless produced the larger overall scoring total because of its passing efficiency, quarterback rushing production, defensive pressure, field-goal accuracy, and better fumble outcomes.
The five-point margin makes these differences especially relevant.
Buffalo’s 36 points came from a combination of:
- 2 passing touchdowns
- 2 rushing touchdowns
- 3 field goals
- 3 extra points
Houston’s 31 points came from:
- 2 passing touchdowns
- 2 rushing touchdowns
- 1 field goal
- 4 extra points
This scoring breakdown highlights how Buffalo’s three successful field goals provided nine points compared with Houston’s single field goal.
Statistical Comparison at a Glance
| Category | Buffalo | Houston |
| Final score | 36 | 31 |
| Passing yards | 334 | 274 |
| Completions | 20 | 26 |
| Passing TDs | 2 | 2 |
| Interceptions | 0 | 0 |
| Sacks allowed | 2 | 3 |
| Rushing yards | 86 | 124 |
| Rushing TDs | 2 | 2 |
| Fumbles | 2 | 2 |
| Fumbles lost | 0 | 2 |
| Team sacks | 3 | 2 |
| QB hits | 9 | 4 |
| Tackles for loss | 8 | 3 |
| Field goals | 3/3 | 1/1 |
The table makes the game’s statistical shape easy to understand. Houston was productive on the ground, but Buffalo created more passing yardage, defensive disruption, and scoring opportunities.
How to Use These Match Player Stats
A single box score can answer more than “who scored the most?”
For fantasy football research, player evaluation, game review, and matchup analysis, focus on the following:
- Volume: Look at attempts, carries, and targets when available.
- Efficiency: Compare yards per attempt and yards per reception.
- Scoring: Separate touchdowns from yardage production.
- Turnovers: Identify fumbles lost and interceptions.
- Pressure: Review sacks, quarterback hits, and tackles for loss.
- Context: Consider the score and game situation before interpreting raw totals.
For example, Cook’s 57 rushing yards should not be evaluated in isolation. Buffalo’s quarterback contributed 23 rushing yards and two touchdowns, changing the way the team’s ground production was distributed.
Similarly, Stroud’s 26 completions look strong, but the Texans needed 38 attempts to reach 274 yards.
Recommended Visuals for the Article
For publication, an original visual package could make the statistics much easier to scan.
A useful game chart would show the quarter-by-quarter scoring progression, with Buffalo’s 21-point second quarter clearly highlighted.
A second graphic could compare Allen and Stroud across:
- Passing yards
- Completion percentage
- Touchdowns
- Interceptions
- Passer rating
- Sacks
A third visual could display the leading offensive and defensive performers from both teams.
These should be based directly on the supplied box-score data rather than generic team imagery.
Source and Data Note
The statistics used in this article are based on the supplied ESPN Bills 36-31 Texans box score for the September 13, 2026 game. For readers who want to verify the underlying game record, the ESPN NFL coverage is the relevant authoritative source.
The supplied figures should be treated as the source of record for the player-by-player analysis above.
Frequently Asked Questions
Who won the Bills vs Texans game?
The Buffalo Bills defeated the Houston Texans 36-31 on September 13, 2026.
How many passing yards did Josh Allen have?
Josh Allen completed 20 of 29 passes for 334 yards, with two touchdowns and no interceptions.
How many passing yards did C.J. Stroud have?
C.J. Stroud completed 26 of 38 passes for 274 yards, with two touchdowns and no interceptions.
Who led the Bills in receiving?
Dalton Kincaid led Buffalo with 5 receptions for 130 yards, averaging 26.0 yards per reception.
Who led the Texans in rushing?
David Montgomery led Houston with 20 carries for 60 yards and two touchdowns.
Did either team record an interception?
No. Neither Buffalo nor Houston recorded an interception in the game.
Conclusion
The buffalo bills vs texans match player stats show a game in which Buffalo overcame Houston’s stronger rushing output through efficient passing, quarterback rushing touchdowns, defensive pressure, and better ball security.
Josh Allen’s 334 passing yards and 130.5 rating were central to Buffalo’s offensive production, while Dalton Kincaid and DJ Moore provided major receiving contributions. Allen also scored twice on the ground.
Houston received strong performances from C.J. Stroud, David Montgomery, Nico Collins, and Woody Marks, but the Texans lost both of their fumbles and faced a Buffalo defense that produced nine quarterback hits and eight tackles for loss.
The final 36-31 score reflects a competitive game in which several statistical categories moved in opposite directions. Looking at the complete player data provides a much clearer picture than the final score alone.