Miami Dolphins vs Baltimore Ravens Match Player Stats
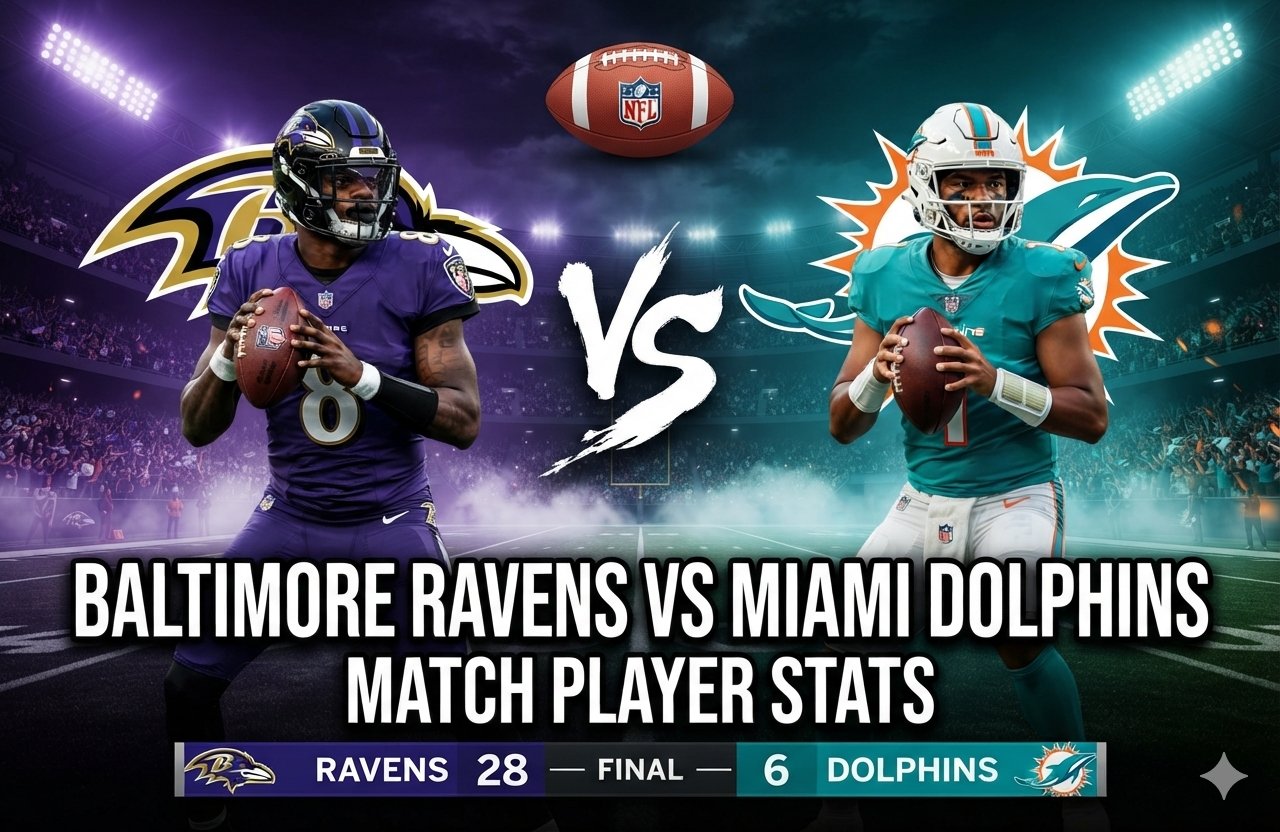
The Baltimore Ravens vs Miami Dolphins match player stats from the October 30, 2025, Week 9 meeting tell a much clearer story than the 28-6 final score alone. Baltimore produced four passing touchdowns through Lamar Jackson, controlled the game after halftime, and limited Miami to two field goals. The Dolphins moved the ball through the air but struggled to turn those yards into touchdowns, especially in the red zone. The official Ravens game record lists the matchup as a Week 9 Thursday night game at Hard Rock Stadium, with Baltimore improving to 3-5 and Miami falling to 2-7. (Baltimore Ravens)
For anyone studying the Baltimore Ravens vs Miami Dolphins match player stats, the most important takeaway is the contrast between efficiency and yardage. Miami actually finished with more passing yards than Baltimore, 261 to 204, but Baltimore’s passing attack produced all four of the game’s touchdowns. That difference explains why the final score became so one-sided.
The game also marked Lamar Jackson’s return after missing three games with a hamstring injury. He completed 18 of 23 passes for 204 yards and four touchdowns without throwing an interception. His 143.2 passer rating was the headline number, but the deeper story was how effectively Baltimore turned a relatively modest passing total into points. (Baltimore Ravens)
Baltimore Ravens vs Miami Dolphins Match Player Stats: Game Overview
| Category | Baltimore Ravens | Miami Dolphins |
| Final Score | 28 | 6 |
| Record After Game | 3-5 | 2-7 |
| Passing Yards | 204 | 261 |
| Rushing Yards | 150 | 87 |
| Rushing Attempts | 31 | 20 |
| Touchdowns | 4 | 0 |
| Interceptions | 1 | 0 |
| Sacks | 2 | 2 |
| Total Defensive Tackles | 66 | 70 |
| Tackles for Loss | 3 | 5 |
| Passes Defended | 4 | 1 |
| QB Hits | 5 | 4 |
| Fumbles | 2 | 2 |
| Fumbles Lost | 0 | 2 |
The statistical profile shows why the result was not simply a matter of Baltimore gaining more yards. Miami finished with 348 combined passing and rushing yards based on the supplied team totals, compared with 354 for Baltimore. That is a narrow overall yardage difference.
The real separation came from scoring efficiency, turnovers, rushing control, and quarterback execution.
Miami’s offense generated 261 passing yards, but it failed to score a touchdown. Baltimore’s offense generated only 204 passing yards, yet Jackson threw four touchdown passes.
That is the type of split that makes a box score more useful when it is analyzed rather than simply repeated.
Lamar Jackson’s Return Changed the Game
Lamar Jackson was easily the most influential player in the matchup.
He completed:
- 18 of 23 passes
- 204 passing yards
- 8.9 yards per attempt
- 4 touchdowns
- 0 interceptions
- 143.2 passer rating
- 93.1 QBR according to the supplied data
The completion percentage works out to approximately 78.3%, which is particularly notable given the number of scoring opportunities Baltimore created through the passing game.
Jackson’s four touchdown passes accounted for every Baltimore offensive touchdown. The official scoring record shows touchdown connections with Mark Andrews twice, Charlie Kolar once, and Rashod Bateman once. (Baltimore Ravens)
The first touchdown went to Mark Andrews on a 2-yard pass. Andrews then scored again on a 20-yard reception in the second quarter.
After halftime, Jackson connected with Charlie Kolar for a 3-yard touchdown and Rashod Bateman for a 9-yard score. (Baltimore Ravens)
This distribution matters because it shows that Baltimore did not depend on one receiver repeatedly winning downfield.
Instead, Jackson used different targets in different scoring situations.
That versatility made the Ravens difficult to defend.
Why Jackson’s efficiency mattered more than his yardage
A common mistake when reading quarterback statistics is to treat passing yards as the most important number.
This game is a perfect example of why that approach can be misleading.
Tua Tagovailoa finished with 261 passing yards, which was 57 more than Jackson. Yet Tagovailoa did not throw a touchdown, while Jackson threw four.
Jackson therefore produced considerably more scoring value from fewer passing attempts and fewer yards.
His 18 completions generated 204 yards, while Miami needed 25 completions to reach 261 yards.
That does not mean every 204-yard passing performance is better than a 261-yard performance. It means the surrounding context matters. Baltimore consistently converted its most important opportunities into touchdowns.
Tua Tagovailoa’s Numbers Tell a Different Story
Tua Tagovailoa completed 25 of 40 passes for 261 yards.
His supplied statistical line was:
- 25 completions
- 40 attempts
- 261 yards
- 6.5 yards per attempt
- 0 touchdowns
- 1 interception
- 70.9 passer rating
- 24.1 QBR
The completion rate was 62.5%.
On the surface, 261 yards looks respectable. But the Dolphins needed touchdowns and could not get them.
The official game recap noted that Miami failed to score touchdowns despite reaching the red zone three times. (Reuters)
That is one of the biggest analytical points from the game.
Moving the ball between the 20-yard lines is not enough when an opponent is consistently converting its scoring opportunities.
Miami’s offense ultimately settled for two Riley Patterson field goals.
The Red-Zone Difference
The scoreboard tells us Baltimore won 28-6.
The red-zone story explains how.
Baltimore scored four touchdowns.
Miami scored zero touchdowns.
The Dolphins’ first two scores came through Riley Patterson field goals from 49 and 43 yards. The official scoring summary confirms both kicks. (Baltimore Ravens)
That means Miami’s offense repeatedly faced the most important part of the field and failed to finish drives with touchdowns.
This is where the game became more than a simple quarterback comparison.
A quarterback can produce 261 passing yards and still leave his offense with a poor scoring output if the offense cannot finish drives.
Baltimore had the opposite experience.
Jackson did not need to accumulate 300 or 350 passing yards because the Ravens consistently converted their opportunities into touchdowns.
Derrick Henry Provided the Ground-Game Foundation
Derrick Henry was Baltimore’s leading rusher.
He carried the ball 19 times for 119 yards, averaging 6.3 yards per carry.
His longest run was 35 yards.
The supplied team totals show Baltimore finished with:
- 31 rushing attempts
- 150 rushing yards
- 4.8 yards per carry
- 0 rushing touchdowns
- 35-yard longest run
Henry’s 119 yards represented the overwhelming majority of Baltimore’s rushing production.
His 6.3-yard average also exceeded the team’s overall 4.8-yard rushing average.
That distinction matters because Henry was not simply accumulating volume. He was creating efficient runs that helped Baltimore stay balanced.
His 35-yard run was especially valuable because explosive rushing plays can dramatically change field position and force defenses to adjust their alignments.
Henry’s career milestone added context
Henry also surpassed 12,000 career rushing yards during the game, according to Reuters. (Reuters)
That milestone is significant because it places his career production among the NFL’s elite running backs.
But his importance in this particular game went beyond the milestone.
Baltimore needed a reliable rushing attack while Jackson returned from injury. Henry gave the offense exactly that.
De’Von Achane Led Miami’s Rushing Attack
De’Von Achane was Miami’s leading rusher.
He recorded:
- 14 carries
- 67 rushing yards
- 4.8 yards per carry
- 22-yard longest run
- 0 rushing touchdowns
Miami finished with 20 rushing attempts for 87 yards.
That produced a team average of 4.4 yards per carry.
Achane also contributed in the passing game and finished with 106 total yards, according to the Dolphins’ official game recap. (Miami Dolphins)
That is important because his overall offensive contribution was greater than his rushing line alone suggests.
The problem for Miami was not necessarily a lack of individual production from Achane. The larger issue was that the offense could not translate that production into touchdowns.
Baltimore’s Receiving Production
Zay Flowers led Baltimore in receiving yardage.
His line was:
- 5 receptions
- 64 yards
- 12.8 yards per reception
- 39-yard longest reception
- 5 targets
- 0 touchdowns
Flowers’ 39-yard reception represented Baltimore’s longest listed reception.
However, he was not Baltimore’s leading touchdown producer.
That role belonged to the tight ends and Rashod Bateman.
Mark Andrews caught two touchdown passes.
Charlie Kolar caught one.
Rashod Bateman caught one.
This distribution is one of the strongest indicators of Baltimore’s offensive versatility.
Mark Andrews’ two-touchdown performance
Andrews caught two touchdown passes from Jackson.
His scores came from 2 yards and 20 yards.
The first touchdown gave Baltimore a 7-3 lead after Miami opened the game with a field goal. The second extended the Ravens’ advantage to 14-3. (Baltimore Ravens)
Andrews’ performance was particularly important because the Ravens were able to use the middle and short areas of the field to create scoring opportunities rather than depending exclusively on deep passes.
Jaylen Waddle Was Miami’s Leading Receiver
Jaylen Waddle led the Dolphins in receiving.
His supplied numbers were:
- 6 receptions
- 82 yards
- 13.7 yards per reception
- 24-yard longest reception
- 9 targets
- 0 touchdowns
Waddle was one of Miami’s most productive offensive players, but his production did not translate into a touchdown.
That distinction is central to understanding Miami’s offensive struggles.
The Dolphins’ receiving group collectively produced 261 yards.
Baltimore’s receiving group produced 204 yards.
Yet Baltimore scored four passing touchdowns.
The comparison shows how much finishing efficiency mattered.
Receiving Efficiency Comparison
| Player | Team | Receptions | Yards | Average | TDs | Long |
| Zay Flowers | Baltimore | 5 | 64 | 12.8 | 0 | 39 |
| Jaylen Waddle | Miami | 6 | 82 | 13.7 | 0 | 24 |
| Mark Andrews | Baltimore | 2 TD receptions | Not supplied | Not supplied | 2 | 20 |
| Charlie Kolar | Baltimore | TD reception | Not supplied | Not supplied | 1 | 3 |
| Rashod Bateman | Baltimore | TD reception | Not supplied | Not supplied | 1 | 9 |
The available data does not provide complete reception totals for every individual Baltimore receiver, so it would be misleading to manufacture missing numbers.
What can be stated confidently is that Jackson’s touchdown passes were spread across multiple players.
That is a strong indicator of offensive variety.
Turnovers Were Another Major Difference
The turnover numbers were decisive.
Baltimore recorded two total fumbles but lost none.
Miami also recorded two fumbles, but lost both.
Baltimore additionally recorded an interception by Malaki Starks.
The supplied defensive statistics list Starks with one interception and nine return yards.
That gives Baltimore three takeaways.
The Ravens’ official postgame coverage also highlighted three takeaways as part of the defensive turnaround. (Baltimore Ravens)
Miami therefore gave Baltimore extra possessions while failing to generate a corresponding interception.
This is one reason the final score became so disproportionate despite relatively similar overall yardage.
Malaki Starks’ interception
Starks’ interception was the game’s only recorded defensive interception.
He returned it nine yards.
Although one interception may not sound overwhelming by itself, turnovers have a disproportionate impact because they can simultaneously stop an opponent’s drive and create a possession for your own offense.
In a game decided by 22 points, Miami’s two lost fumbles and one interception created a major disadvantage.
Defensive Player and Team Statistics
Baltimore recorded:
- 66 total tackles
- 41 solo tackles
- 2 sacks
- 3 tackles for loss
- 4 passes defended
- 5 quarterback hits
- 1 interception
Miami recorded:
- 70 total tackles
- 36 solo tackles
- 2 sacks
- 5 tackles for loss
- 1 pass defended
- 4 quarterback hits
- 0 interceptions
Miami actually recorded more total tackles and tackles for loss.
That is another example of why individual statistical categories cannot be viewed in isolation.
The Dolphins made 70 tackles and recorded five tackles for loss, yet their defense allowed four passing touchdowns.
Baltimore had fewer total tackles but created more meaningful disruption through takeaways and pass defense.
Baltimore’s Second-Half Adjustment
The game changed after halftime.
Baltimore entered the third quarter leading 14-6.
The Ravens then scored twice.
Charlie Kolar caught a 3-yard touchdown pass after an 11-play, 68-yard drive.
Later in the quarter, Rashod Bateman caught a 9-yard touchdown pass following a four-play, 60-yard drive. (Baltimore Ravens)
The official Ravens recap noted that Jackson completed his first nine second-half pass attempts for 95 yards and two touchdowns. (Baltimore Ravens)
That is a particularly useful statistic because it demonstrates how different the second half became from the early portion of the game.
Baltimore did not simply maintain its lead.
It expanded it quickly.
Quarter-by-Quarter Breakdown
| Quarter | Baltimore | Miami |
| First | 7 | 3 |
| Second | 7 | 3 |
| Third | 14 | 0 |
| Fourth | 0 | 0 |
| Final | 28 | 6 |
The fourth quarter produced no points from either side.
That means the decisive period was the third quarter.
Baltimore scored 14 points while Miami failed to score.
The Ravens entered halftime ahead 14-6 and then effectively ended the competitive portion of the game with two third-quarter touchdowns.
Special Teams Statistics
Special teams also contributed to the overall statistical picture.
Tyler Loop
Baltimore kicker Tyler Loop went:
- 0/0 field goals
- 4/4 extra points
- 4 points
Because Baltimore scored four touchdowns, Loop’s four successful extra points completed every Ravens scoring drive.
Riley Patterson
Miami kicker Riley Patterson recorded:
- 2/3 field goals
- 66.7% field-goal rate
- 49-yard long
- 6 points
Both of Miami’s successful scores came from field goals.
That again highlights the central problem: Miami could reach scoring territory but could not complete drives with touchdowns.
Punting Comparison
Jordan Stout handled Baltimore’s punting duties.
His supplied numbers were:
- 6 punts
- 336 yards
- 56.0-yard average
- 1 touchback
- 4 inside the 20
- 64-yard long
Jake Bailey punted for Miami:
- 3 punts
- 128 yards
- 42.7-yard average
- 0 touchbacks
- 1 inside the 20
- 47-yard long
The difference in punt volume is notable.
Baltimore punted six times while Miami punted three times, yet Baltimore still won by 22 points.
That reinforces the importance of Baltimore’s scoring efficiency when it did sustain drives.
Return Game
Baltimore recorded three kickoff returns for 77 yards, averaging 25.7 yards per return.
Miami recorded four kickoff returns for 89 yards, averaging 22.3 yards.
On punt returns, Baltimore had one return for 17 yards.
Miami had two returns for 38 yards, averaging 19.0 yards.
The return statistics were relatively balanced and were not the primary reason for the outcome.
The bigger differences came from quarterback efficiency, turnovers, rushing production and red-zone execution.
What the Player Stats Reveal That the Score Does Not
The final score makes Baltimore’s victory look straightforward.
The individual statistics make the story more interesting.
1. Miami gained more passing yards
Tagovailoa threw for 261 yards.
Jackson threw for 204.
Yet Jackson threw four touchdowns.
This is the clearest example of efficiency beating raw volume.
2. Baltimore ran the ball better
The Ravens produced 150 rushing yards.
Miami produced 87.
That gave Baltimore a 63-yard advantage on the ground.
Henry accounted for 119 of those Ravens rushing yards.
3. Baltimore protected the football
The Ravens lost zero fumbles.
Miami lost two.
Baltimore also recorded the only interception of the game.
That created a three-takeaway advantage.
4. Baltimore finished drives
Four touchdowns from Jackson meant Baltimore converted opportunities into maximum-value scoring plays.
Miami’s two field goals were not enough.
5. Baltimore improved after halftime
The Ravens scored 14 points in the third quarter.
Miami scored none.
That was effectively the game’s turning point.
Key Player Matchup: Lamar Jackson vs Tua Tagovailoa
The quarterback comparison is the most obvious place to start.
| Statistic | Lamar Jackson | Tua Tagovailoa |
| Completions | 18 | 25 |
| Attempts | 23 | 40 |
| Completion Rate | 78.3% | 62.5% |
| Passing Yards | 204 | 261 |
| Yards/Attempt | 8.9 | 6.5 |
| TD Passes | 4 | 0 |
| Interceptions | 0 | 1 |
| Passer Rating | 143.2 | 70.9 |
| QBR | 93.1 | 24.1 |
Jackson won the statistical battle decisively despite throwing for fewer yards.
His combination of accuracy, yards per attempt, touchdown production and ball security produced a much more efficient performance.
Tagovailoa had more volume but less scoring impact.
That difference was reflected directly on the scoreboard.
Key Player Matchup: Derrick Henry vs De’Von Achane
The running-back comparison was also favorable to Baltimore.
| Statistic | Derrick Henry | De’Von Achane |
| Carries | 19 | 14 |
| Rushing Yards | 119 | 67 |
| Yards/Carry | 6.3 | 4.8 |
| Longest Run | 35 | 22 |
| Rushing TDs | 0 | 0 |
Henry gained 52 more rushing yards than Achane despite receiving only five additional carries.
That difference helped Baltimore maintain offensive balance.
Achane still had a productive game overall and finished with 106 total yards according to Miami’s official recap, but Baltimore got more consistent production from its ground attack. (Miami Dolphins)
Why Miami’s 261 Passing Yards Were Not Enough
It is tempting to look at Miami’s 261 passing yards and conclude that the offense performed reasonably well.
The problem is that yardage without scoring efficiency can be misleading.
Miami had:
- 261 passing yards
- 87 rushing yards
- 348 combined yards
- 0 touchdowns
- 2 field goals
- 1 interception
- 2 lost fumbles
The Dolphins moved the football.
They simply did not finish.
Baltimore’s defense deserves credit for that because the Ravens repeatedly forced Miami’s offense to settle for less than seven points.
The official Dolphins recap specifically noted that Miami went 0-for-3 on red-zone opportunities. (Reuters)
That is arguably more important than the raw passing-yard difference.
Why Baltimore’s 204 Passing Yards Were Enough
Baltimore’s offense did not need to throw 40 times.
Jackson attempted only 23 passes.
He completed 18.
Four of those completions became touchdowns.
That produced a touchdown rate of roughly 17.4% of his pass attempts.
The number is unusually high for a single game and explains why Baltimore could score 28 points without producing a huge passing-yard total.
The Ravens also had Henry and a productive running game available.
That balance meant Miami could not simply focus on stopping Jackson’s passing attack.
The Importance of Offensive Balance
Baltimore’s 31 rushing attempts compared with 23 Jackson pass attempts.
That balance is revealing.
The Ravens did not put the entire game on Jackson’s arm, even though he ultimately produced all four offensive touchdowns through the air.
Henry’s running created another dimension.
Miami had to respect the ground game.
That helped create favorable situations for Jackson and Baltimore’s receiving targets.
The Most Important Statistical Lessons
Anyone analyzing this matchup should focus on five numbers.
143.2
Jackson’s passer rating.
It summarizes the efficiency of his passing performance.
4
Jackson’s touchdown passes.
Every Baltimore touchdown came through the air.
150
Baltimore’s rushing yards.
The Ravens did not become one-dimensional.
3
Baltimore’s takeaways.
Miami lost two fumbles and threw one interception.
0
Miami’s touchdowns.
This is ultimately the number that mattered most.
What Could Miami Have Done Differently?
The statistics suggest several areas where Miami needed improvement.
First, the Dolphins needed better red-zone execution.
The offense had opportunities but failed to convert them into touchdowns.
Second, ball security had to improve.
Two lost fumbles against a team featuring Lamar Jackson created unnecessary short fields and extra possessions.
Third, Miami needed greater efficiency from its passing game.
Tagovailoa’s 261 yards were respectable, but 40 attempts for zero touchdowns and one interception did not produce enough scoring value.
Fourth, the Dolphins needed to prevent Baltimore from controlling the ground game.
Allowing Henry to average 6.3 yards per carry made it difficult to consistently put the Ravens into obvious passing situations.
What Baltimore Did Particularly Well
Baltimore’s strongest characteristics were complementary.
The offense scored touchdowns.
The running game produced 150 yards.
Jackson protected the football.
The defense generated three takeaways.
The Ravens did not lose a fumble.
The team also scored 14 points in the third quarter and shut Miami out in the second half.
That combination explains why the game moved from a competitive 14-6 halftime margin to a comfortable 28-6 final.
A Practical Way to Read These Match Player Stats
When evaluating a game like this, do not start with the final score.
Use this sequence instead:
- Compare quarterback efficiency.
- Compare rushing production.
- Check turnovers.
- Examine touchdown production.
- Review red-zone results.
- Look at second-half scoring.
- Identify which individual players created the biggest changes in field position or scoring probability.
Using that approach, the Ravens’ victory becomes easy to understand.
Jackson was more efficient than Tagovailoa.
Henry was more productive than Miami’s primary runner.
Baltimore protected the football.
Miami did not.
Baltimore scored four touchdowns.
Miami scored none.
The Ravens also dominated the third quarter.
Those factors explain the result far better than total yardage alone.
Final Statistical Assessment
The Baltimore Ravens vs Miami Dolphins match player stats show a game where efficiency mattered more than volume.
Miami’s 261 passing yards exceeded Baltimore’s 204.
Yet Baltimore won by 22 points.
The reason was scoring efficiency.
Lamar Jackson returned from injury and delivered one of the game’s defining quarterback performances, completing 18 of 23 passes for 204 yards and four touchdowns. The official Ravens game record confirms that his touchdown passes went to Mark Andrews twice, Charlie Kolar and Rashod Bateman. (Baltimore Ravens)
Derrick Henry added 119 rushing yards, helping Baltimore reach 150 rushing yards as a team.
Zay Flowers led Baltimore in receiving yards with 64, while Jaylen Waddle led Miami with 82.
Tua Tagovailoa produced 261 passing yards, but he did not throw a touchdown and finished with one interception.
Miami also lost two fumbles.
Those turnovers, combined with the red-zone failures, prevented the Dolphins from turning their offensive yardage into points.
Baltimore, meanwhile, maximized its opportunities.
The Ravens led 14-6 at halftime and then scored two touchdowns in the third quarter to establish a 28-6 advantage. Neither team scored in the fourth quarter. (Baltimore Ravens)
The result was therefore not simply a case of one team gaining dramatically more yards.
It was a case of one team being far more effective with the opportunities it created.
For readers studying individual performance, Jackson is the obvious standout. For readers examining team-level factors, the most important figures are Baltimore’s 150 rushing yards, three takeaways, four passing touchdowns and Miami’s zero touchdowns.
Those numbers collectively explain the 28-6 result.
Frequently Asked Questions
Who won the Ravens vs Dolphins game in 2025?
The Baltimore Ravens defeated the Miami Dolphins 28-6 in Week 9 at Hard Rock Stadium. The official Ravens record lists the game as October 30, 2025. (Baltimore Ravens)
How many touchdowns did Lamar Jackson throw against the Dolphins?
Lamar Jackson threw four touchdown passes. He completed 18 of 23 passes for 204 yards without an interception. (Baltimore Ravens)
How many rushing yards did Derrick Henry have?
Derrick Henry rushed 19 times for 119 yards, averaging 6.3 yards per carry, with a longest run of 35 yards.
How many passing yards did Tua Tagovailoa have?
Tua Tagovailoa completed 25 of 40 passes for 261 yards. He did not throw a touchdown and had one interception.
Who was Miami’s leading receiver?
Jaylen Waddle led Miami with six receptions for 82 yards, averaging 13.7 yards per reception.
How many turnovers did the Ravens force?
Baltimore recorded three takeaways based on the supplied statistics: one interception and two recovered Miami fumbles. Baltimore itself did not lose either of its two fumbles.
Conclusion
The Baltimore Ravens vs Miami Dolphins match player stats provide a strong example of why football performance cannot be judged by yardage totals alone.
Miami threw for 261 yards compared with Baltimore’s 204, but the Ravens scored four passing touchdowns while the Dolphins scored none. Baltimore also produced 150 rushing yards, compared with Miami’s 87, and forced three turnovers.
Lamar Jackson’s return was the defining individual storyline. His 18-of-23 passing performance, 204 yards and four touchdowns gave Baltimore the efficiency it needed. Derrick Henry’s 119 rushing yards added balance, while Mark Andrews, Charlie Kolar and Rashod Bateman all contributed touchdown receptions.
For Miami, Jaylen Waddle and De’Von Achane produced useful offensive numbers, but the Dolphins could not finish drives. Their two lost fumbles and failure to score a touchdown ultimately outweighed their 261 passing yards.
The third quarter proved decisive. Baltimore scored twice, Miami failed to score, and the Ravens turned a competitive 14-6 halftime advantage into a 28-6 victory. The official game record confirms the final score and scoring sequence. (Baltimore Ravens)