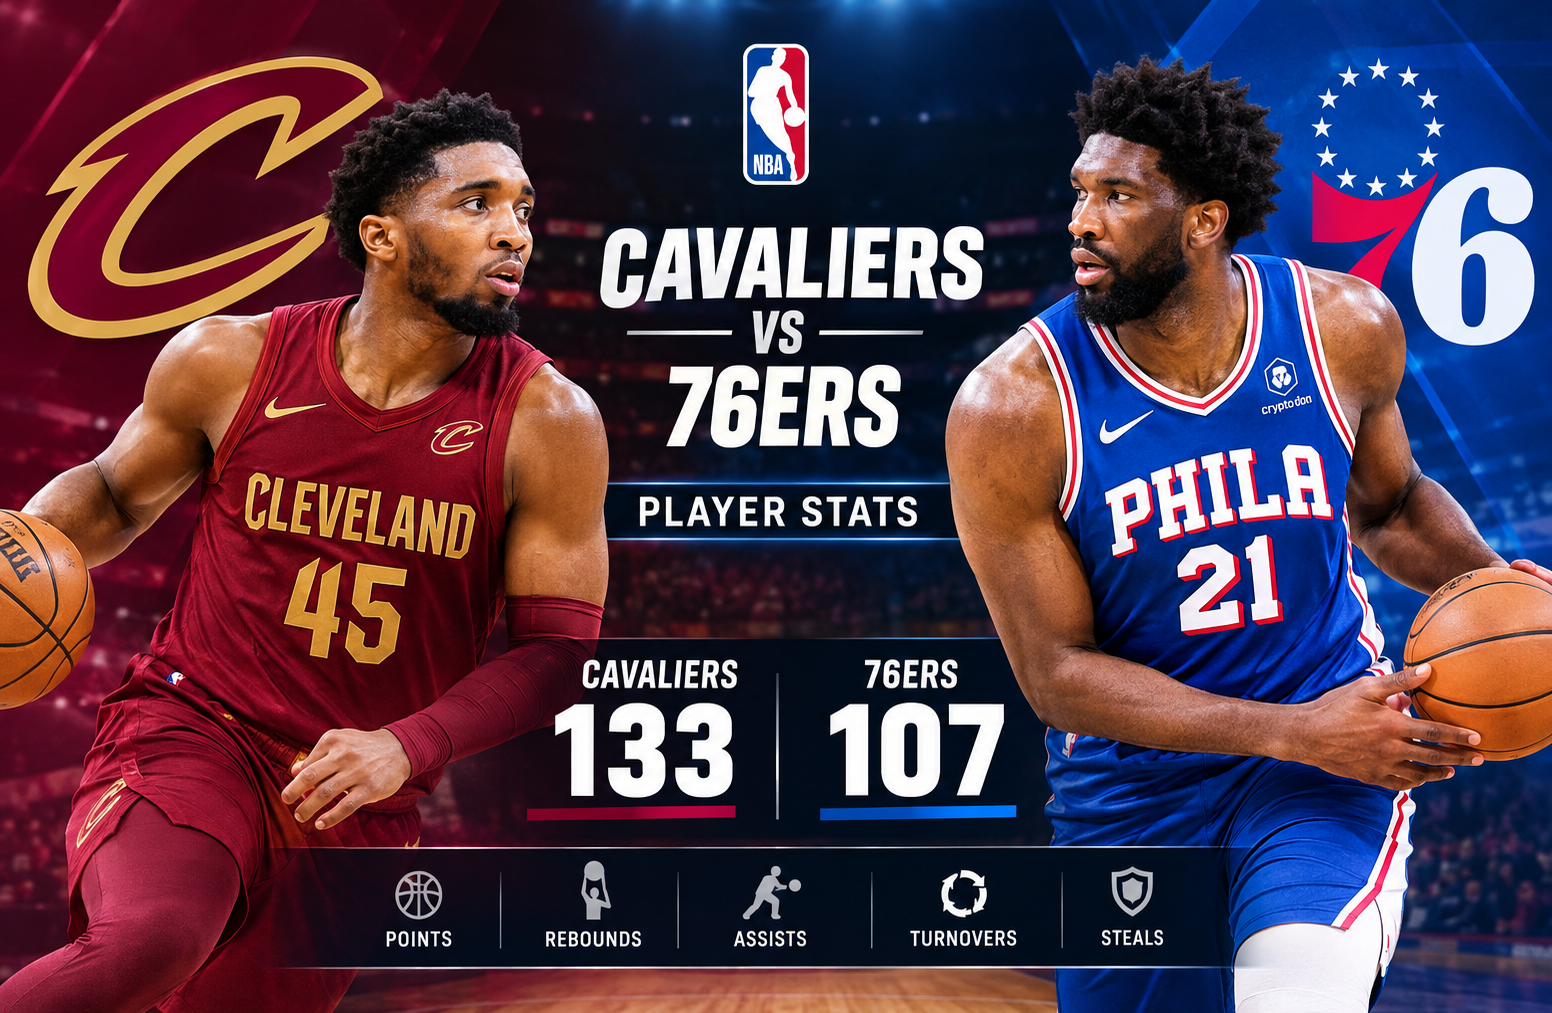
76ers vs Cleveland Cavaliers Match Player Stats
The 76ers vs cleveland cavaliers match player stats from January 15, 2026, tell the story of a dominant Cleveland performance against Philadelphia at Xfinity Mobile Arena in Philadelphia, Pennsylvania. The Cavaliers secured a 133-107 victory, combining efficient three-point shooting, strong ball movement, and a balanced scoring attack to control the game. Donovan Mitchell led Cleveland with 35 points and nine assists, while Evan Mobley collected 13 rebounds. For Philadelphia, Joel Embiid scored 20 points, and Paul George added 17 points and four assists.
The 26-point margin reflected more than a difference in individual scoring. Cleveland made 50 of 95 field-goal attempts, connected on 20 three-pointers, and recorded 41 assists. Philadelphia made 36 of 89 shots and struggled to convert from beyond the arc, finishing with 12 three-pointers on 43 attempts. Although the 76ers shot accurately from the free-throw line, their overall shooting efficiency and lower assist total made it difficult to keep pace with Cleveland’s offense.
This breakdown examines the final score, individual performances, starting lineups, team statistics, quarter-by-quarter scoring, and the tactical factors that shaped the result. It also explains how to interpret the numbers so readers can distinguish between impressive individual production and the team-level execution that often determines an NBA game.
76ers vs Cleveland Cavaliers Match Player Stats: Game Overview
The January 15 matchup featured two teams with competitive records entering the game. Cleveland was listed at 23-19 overall, including a 9-9 road record. Philadelphia entered with a 22-17 record and a 10-10 home record.
Despite Philadelphia’s home-court advantage, Cleveland established control early and maintained its scoring pressure throughout the contest.
| Game detail | Information |
| Date | January 15, 2026 |
| Venue | Xfinity Mobile Arena |
| Location | Philadelphia, Pennsylvania |
| Attendance | 19,746 |
| Cleveland Cavaliers | 133 |
| Philadelphia 76ers | 107 |
| Winning team | Cleveland Cavaliers |
| Winning margin | 26 points |
| Broadcast | ESPN and FanDuel Sports Network Ohio |
The game was a useful example of how shooting efficiency and passing can combine to create a decisive result. Cleveland scored 33 points in the first quarter, added 33 in the third, and finished with 40 in the fourth. Philadelphia produced its best quarter in the second, scoring 29 points, but could not sustain enough offensive production to challenge Cleveland late.
One important distinction is that the final score alone does not explain the entire performance. Cleveland’s advantage came from several measurable areas: three-point accuracy, assists, total rebounds, and overall field-goal percentage. Philadelphia remained competitive at the free-throw line, but that strength did not compensate for its lower shooting efficiency from the field.
Final Score and Quarter-by-Quarter Breakdown
The quarter-by-quarter score shows when Cleveland gained its advantage and how Philadelphia responded.
| Quarter | Cleveland Cavaliers | Philadelphia 76ers |
| First quarter | 33 | 18 |
| Second quarter | 27 | 29 |
| Third quarter | 33 | 28 |
| Fourth quarter | 40 | 32 |
| Final score | 133 | 107 |
First quarter: Cleveland establishes control
Cleveland opened the game with 33 points while limiting Philadelphia to 18. That 15-point advantage immediately placed the 76ers in a difficult position.
An early deficit changes the decisions a team must make. Philadelphia needed to recover points while also protecting against Cleveland’s perimeter attack. That balance can be difficult because aggressive three-point defense may create driving lanes, while a packed defense can allow open shots from outside.
Cleveland’s opening production gave it room to manage the game without needing to win every subsequent quarter.
Second quarter: Philadelphia makes a response
Philadelphia scored 29 points in the second quarter, two more than Cleveland’s 27. This was the 76ers’ strongest relative stretch of the game.
The improvement showed that Philadelphia could generate more offense than it had in the opening period. However, winning a quarter by two points was not enough to erase a 15-point deficit.
At halftime, Cleveland still held a 60-47 lead. Philadelphia needed a substantially stronger second half, particularly from three-point range, to change the direction of the contest.
Third quarter: Cleveland protects its advantage
Cleveland scored 33 points in the third quarter, compared with Philadelphia’s 28. The five-point difference increased the Cavaliers’ lead to 18 points.
This stretch mattered because Philadelphia had an opportunity to build on its second-quarter response. Instead, Cleveland maintained offensive consistency and prevented the home team from making meaningful progress on the scoreboard.
A team defending a lead does not always need to force difficult shots or play at a slower pace. Cleveland’s continued scoring helped prevent Philadelphia from turning the game into a close fourth-quarter contest.
Fourth quarter: Cleveland delivers its strongest scoring period
The Cavaliers scored 40 points in the final quarter, their highest output of the game. Philadelphia added 32, but the eight-point difference pushed the final margin to 26.
Cleveland’s late scoring demonstrated that its offense remained productive rather than relying solely on the cushion created in the first quarter.
The fourth-quarter total should not be interpreted as proof of a particular defensive breakdown without detailed possession data. It does, however, confirm that Philadelphia did not significantly reduce Cleveland’s scoring output as the game progressed.
Cleveland Cavaliers Player Stats
Cleveland’s performance featured a high-scoring lead guard, a productive secondary scorer, strong rebounding from its frontcourt, and useful contributions from the bench.
The available game data identifies Donovan Mitchell as the leading scorer and assist leader, Evan Mobley as the leading rebounder, and De’Andre Hunter as a key bench contributor.
Cleveland’s leading individual performances
| Player | Points | Rebounds | Assists | Statistical highlight |
| Donovan Mitchell | 35 | Not provided | 9 | Led Cleveland in scoring and assists |
| Darius Garland | 20 | Not provided | Not provided | Second-leading scorer |
| Evan Mobley | Not provided | 13 | Not provided | Team rebounding leader |
| De’Andre Hunter | 17 | Not provided | Not provided | Bench scoring contribution |
The supplied statistical summary does not include every player’s complete box-score line. Missing values are therefore left unspecified rather than estimated.
Donovan Mitchell: 35 points and nine assists
Donovan Mitchell delivered Cleveland’s most prominent individual performance with 35 points and nine assists. His scoring led every player identified in the supplied game summary, while his passing helped Cleveland create opportunities for teammates.
The combination of scoring and playmaking is particularly important when assessing a guard’s impact. A high-scoring player can influence a game by converting difficult shots, drawing defensive attention, and creating open opportunities for teammates. Assists provide one measurable indication of that second responsibility.
Mitchell’s nine assists were part of a larger team pattern. Cleveland finished with 41 assists, nearly twice Philadelphia’s total of 22. His individual production therefore fits the broader picture of a team that combined individual shot creation with effective ball movement.
A useful distinction is that nine assists do not reveal every advantage a player creates. A pass that leads to an extra pass, a defensive rotation, or a shooting foul may benefit the offense without appearing in the passer’s assist total. Mitchell’s recorded numbers establish his direct production, while the team statistics help explain the larger offensive context.
Darius Garland: 20 points as the secondary scorer
Darius Garland scored 20 points, giving Cleveland another player capable of putting pressure on Philadelphia’s defense.
Having multiple scoring threats creates a difficult choice for opponents. Concentrating defensive attention on Mitchell can leave other guards with room to operate. Giving Garland more attention can create opportunities for Mitchell or Cleveland’s frontcourt players.
Garland’s 20 points also meant Cleveland did not depend entirely on one player to reach 133. Mitchell led the attack, but Garland’s contribution helped provide another source of offense.
The available data does not establish Garland’s shooting splits or assist total for this game. It would therefore be misleading to assign his scoring efficiency or describe a particular shooting sequence without a complete player-level box score.
Evan Mobley: 13 rebounds and frontcourt influence
Evan Mobley led Cleveland with 13 rebounds. His total contributed to a team rebounding advantage of 52-42.
Rebounding is important because it determines which team gains possession after missed shots. Defensive rebounds can end an opponent’s possession, while offensive rebounds create additional opportunities to score.
Cleveland recorded 12 offensive rebounds and 40 defensive rebounds. Philadelphia collected 11 offensive rebounds and 31 defensive rebounds. The difference in defensive rebounds was especially notable, although the totals alone do not establish how many rebounds Mobley personally secured at each end.
Mobley’s 13 rebounds provide clear evidence of his contribution to Cleveland’s work on the glass. His complete defensive statistics, contested-rebound count, and individual matchup data would be needed to evaluate his full impact beyond the recorded total.
De’Andre Hunter: 17 points off the bench
De’Andre Hunter scored 17 points as a bench contributor, giving Cleveland valuable production beyond its starting group.
Bench scoring matters because it helps maintain offensive output when starters rest or when the opposing team adjusts its defensive approach. A strong reserve performance can also prevent an opponent from gaining momentum during rotation changes.
Hunter’s 17 points represented a meaningful contribution in a game Cleveland won by 26. His scoring was not the only reason for the victory, but it supported the broader pattern of production from several players.
The supplied data does not include his field-goal attempts, three-point attempts, minutes, or plus/minus. Those figures would be necessary to compare his efficiency with that of other bench players.
Cleveland’s starting lineup
The supplied starting lineup for Cleveland was:
- Jarrett Allen
- Evan Mobley
- Donovan Mitchell
- Darius Garland
- Jaylon Tyson
This group combined guard scoring and playmaking with frontcourt size and rebounding. Mitchell and Garland supplied the primary perimeter scoring threats, while Allen and Mobley offered interior size and rebounding potential.
The lineup’s structure helps explain the different ways Cleveland could generate offense. Guards can create shots through ball handling and passing, while taller players can contribute through screening, interior positioning, offensive rebounds, and finishing near the basket.
These are role-based observations, not a claim that every player recorded a particular action during this game. Detailed play-by-play and individual shot data would be required to identify the exact possessions that produced Cleveland’s advantage.
Philadelphia 76ers Player Stats
Philadelphia received scoring contributions from Joel Embiid and Paul George, while Andre Drummond led the team in rebounds. The challenge was turning individual production into a more efficient and connected team offense.
The 76ers finished with 107 points, 26 fewer than Cleveland. Their 36 made field goals and 12 made three-pointers were both below Cleveland’s totals.
Philadelphia’s leading individual performances
| Player | Points | Rebounds | Assists | Statistical highlight |
| Joel Embiid | 20 | Not provided | Not provided | Philadelphia’s leading scorer |
| Paul George | 17 | Not provided | 4 | Second-leading scorer and listed assist leader |
| Andre Drummond | Not provided | 9 | Not provided | Philadelphia’s rebounding leader |
Paul George’s four assists were tied with other Philadelphia players, according to the supplied information. The full box score would be needed to identify all players tied at that mark.
Joel Embiid: 20 points
Joel Embiid led Philadelphia with 20 points. His scoring gave the 76ers a reliable source of individual production, but the team’s overall shooting performance made it difficult to close the gap.
Philadelphia made 40% of its field-goal attempts and 28% of its three-point attempts. Those percentages indicate that the team converted a smaller proportion of its shots than Cleveland.
Embiid’s scoring total should be evaluated separately from the team’s shooting percentage. His 20 points do not reveal how many shots he attempted, how efficiently he converted them, or how often he reached the free-throw line. Without those details, it would be inappropriate to assign him an individual shooting percentage or claim that he was responsible for the team’s wider offensive problems.
The clearest supported conclusion is that Embiid led Philadelphia in points, but his output was not enough to overcome Cleveland’s stronger team shooting and ball movement.
Paul George: 17 points and four assists
Paul George scored 17 points and recorded four assists. His combination of scoring and passing made him another important offensive contributor for Philadelphia.
George’s four assists were fewer than Mitchell’s nine, although assists should always be considered in the context of minutes played, teammates’ shooting, and the team’s overall offensive system.
The team comparison is particularly revealing here. Philadelphia recorded 22 assists, while Cleveland finished with 41. That gap suggests that Cleveland generated substantially more made baskets directly credited to a pass.
It does not prove that Philadelphia failed to pass the ball or that every Cleveland basket resulted from superior decision-making. A team’s assist total is influenced by shot selection, successful conversions, offensive structure, and the way scoring plays develop. Still, the 19-assist difference is a meaningful part of the statistical explanation for the final result.
Andre Drummond: nine rebounds
Andre Drummond led Philadelphia with nine rebounds. His total contributed to a team effort that produced 42 rebounds overall.
Philadelphia’s 11 offensive rebounds were close to Cleveland’s 12. This indicates that the 76ers were not completely outmatched in their ability to recover missed shots on the offensive glass.
The larger difference appeared in defensive rebounds, where Philadelphia recorded 31 compared with Cleveland’s 40. That gap contributed to Cleveland’s 10-rebound overall advantage.
Drummond’s individual total is useful, but a complete evaluation would also examine his minutes, offensive and defensive rebound splits, and the number of contested opportunities he converted. Those additional figures would provide a more detailed view of his work inside.
Philadelphia’s starting lineup
The supplied starting lineup for Philadelphia was:
- Paul George
- Dominick Barlow
- Joel Embiid
- Tyrese Maxey
- VJ Edgecombe
This lineup included scoring options in the backcourt and frontcourt, with Embiid providing a central interior presence.
The available summary identifies George and Embiid as Philadelphia’s leading scorers, but it does not provide a complete individual statistical line for Maxey, Barlow, or Edgecombe. Their exact scoring totals, shooting efficiency, and defensive contributions should not be inferred from the team result.
The lineup information is still useful for understanding the players involved. However, evaluating the performance of the starting five requires more than knowing which players began the game. Minutes, substitutions, lineup combinations, and possession-level results are needed to establish how effectively the group performed together.
Cleveland Cavaliers vs Philadelphia 76ers: Complete Team Statistics
The team box score provides the strongest quantitative explanation for Cleveland’s victory. The Cavaliers shot better from the field and from three-point range, recorded significantly more assists, and collected more rebounds.
| Team statistic | Cleveland Cavaliers | Philadelphia 76ers |
| Points | 133 | 107 |
| Field goals made/attempted | 50/95 | 36/89 |
| Field-goal percentage | 53% | 40% |
| Three-pointers made/attempted | 20/46 | 12/43 |
| Three-point percentage | 43% | 28% |
| Free throws made/attempted | 13/18 | 23/26 |
| Free-throw percentage | 72% | 88% |
| Total rebounds | 52 | 42 |
| Offensive rebounds | 12 | 11 |
| Defensive rebounds | 40 | 31 |
| Assists | 41 | 22 |
| Turnovers | 15 | 12 |
| Steals | 6 | 9 |
| Blocks | 5 | 5 |
| Personal fouls | 19 | 15 |
Field-goal efficiency: Cleveland converts more opportunities
Cleveland made 50 of 95 field-goal attempts, while Philadelphia made 36 of 89.
Using the supplied shooting totals, Cleveland converted approximately 52.6% of its attempts, compared with approximately 40.4% for Philadelphia. The displayed percentages of 53% and 40% are rounded.
The Cavaliers made 14 more field goals despite attempting only six more shots. This is one of the clearest differences in the box score.
A team can attempt a similar number of shots to its opponent and still produce a very different score if it converts those attempts more frequently. Cleveland’s higher conversion rate allowed it to generate more points from its field-goal attempts without needing a dramatically higher attempt volume.
Three-point shooting: a major scoring difference
Cleveland made 20 of 46 three-point attempts, while Philadelphia made 12 of 43.
The Cavaliers therefore made eight more three-pointers. Because every successful three-pointer is worth three points, that difference represented 24 points in total three-point makes.
The comparison is especially significant because the teams attempted a similar number of shots from beyond the arc. Cleveland attempted only three more three-pointers, yet its 43% shooting rate was substantially higher than Philadelphia’s 28%.
Three-point shooting can influence a game’s structure as well as its final score. When a team consistently converts shots from outside, defenders may need to extend their coverage farther from the basket. That can open driving lanes and change the defensive positioning required to protect the paint.
The available totals do not identify every open or contested shot, so they cannot prove exactly how Cleveland created each three-point opportunity. They do show that the Cavaliers converted their perimeter attempts at a much higher rate.
Free throws: Philadelphia’s relative strength
Philadelphia made 23 of 26 free throws, an 88% conversion rate. Cleveland made 13 of 18, or approximately 72%.
The 76ers scored 10 more points at the free-throw line. This was an area in which Philadelphia performed better in both volume and accuracy.
However, the advantage did not overcome the difference in field goals. Cleveland made 14 more field goals and eight more three-pointers. Those advantages helped offset Philadelphia’s superior free-throw production.
This illustrates why a single strong statistic cannot determine a game’s outcome. Free-throw accuracy matters, but it must be considered alongside field-goal efficiency, shot value, rebounding, and ball movement.
Rebounding: a 10-rebound Cleveland advantage
Cleveland finished with 52 rebounds, while Philadelphia recorded 42.
The Cavaliers collected 40 defensive rebounds to Philadelphia’s 31. Their offensive-rebound totals were much closer, with Cleveland recording 12 and Philadelphia 11.
This distinction matters because total rebounds can conceal differences in how a team secures possession. The close offensive-rebound totals suggest that the overall gap was driven more by defensive rebounds than by a large difference in second-chance recovery.
A defensive rebound typically ends the opponent’s immediate scoring opportunity and gives the rebounding team possession. Consistently securing defensive boards can help a team limit additional attempts and transition into its own offense.
The totals support the conclusion that Cleveland had the stronger overall rebounding performance. They do not, by themselves, establish how many second-chance points either team scored.
Assists: Cleveland’s passing advantage
Cleveland recorded 41 assists compared with Philadelphia’s 22. The 19-assist difference was one of the largest gaps in the team statistics.
Assists measure passes that directly lead to made field goals under official scoring rules. They are therefore useful for evaluating how much scoring comes from credited passing plays.
Cleveland’s total indicates that a substantial portion of its made baskets involved an assisting teammate. Combined with 50 made field goals, the 41 assists point to an offense that produced many credited assisted baskets.
Philadelphia’s lower total does not automatically mean its players failed to move the ball. Some successful shots are unassisted, and assists do not capture every useful pass. Nevertheless, the difference reinforces the contrast between Cleveland’s offensive output and Philadelphia’s less productive shooting performance.
Turnovers, steals, and blocks
Philadelphia committed 12 turnovers, three fewer than Cleveland’s 15. The 76ers also recorded nine steals compared with Cleveland’s six. Both teams finished with five blocks.
These figures show that Philadelphia had some defensive and ball-security advantages. It forced more recorded steals and committed fewer turnovers, yet still lost by 26 points.
This is an important reminder that turnovers do not tell the entire story of offensive performance. A team can protect possession relatively well but still struggle if it misses a high proportion of its shots.
Similarly, a higher steal total does not necessarily mean a team controlled the game defensively. Philadelphia’s nine steals were not enough to neutralize Cleveland’s shooting efficiency, passing, and rebounding advantages.
The equal block totals also show that rim protection, measured simply through recorded blocks, did not distinguish the teams in this contest.
The Main Statistical Reasons Cleveland Won
The final score becomes easier to understand when the main statistical differences are considered together rather than in isolation.
1. Cleveland made more shots
Cleveland converted 50 field goals compared with Philadelphia’s 36. The 14-basket difference provided a substantial scoring advantage.
The Cavaliers did not need a dramatically higher number of attempts to achieve that result. Their superior shooting percentage helped turn a relatively similar shot volume into a much higher point total.
2. The Cavaliers converted more three-pointers
Cleveland made 20 three-pointers, eight more than Philadelphia. This gave the visitors a significant advantage in scoring from the perimeter.
Philadelphia attempted 43 three-pointers, meaning it had many opportunities to generate points from outside. However, it converted only 12. The difference between attempts and makes was a key feature of the team’s offensive performance.
3. Cleveland created more assisted baskets
The 41-22 assist comparison points to a clear difference in credited playmaking outcomes.
Cleveland combined Mitchell’s nine assists with a team total of 41, while Philadelphia recorded 22 assists overall. The figures suggest that Cleveland’s offense generated substantially more made shots directly credited to a pass.
4. Cleveland secured more rebounds
The Cavaliers won the total rebounding comparison 52-42. Their nine-rebound advantage on the defensive glass was particularly notable.
Although Philadelphia nearly matched Cleveland in offensive rebounds, it did not secure as many defensive boards. That difference formed part of Cleveland’s overall possession and rebounding advantage.
5. Philadelphia could not capitalize on its free-throw advantage
Philadelphia made 23 free throws, while Cleveland made 13. The 76ers also had a higher free-throw percentage.
Despite this strength, Philadelphia’s lower field-goal and three-point percentages created a much larger disadvantage elsewhere. The result demonstrates how several moderate advantages and disadvantages can combine to determine a game’s final margin.
Statistical Interpretation: What the Numbers Reveal and What They Do Not
A useful game analysis should distinguish between confirmed box-score facts and interpretations that require additional evidence.
The confirmed facts in this matchup include Cleveland’s 133-107 victory, Mitchell’s 35 points and nine assists, Mobley’s 13 rebounds, Embiid’s 20 points, and the teams’ shooting and rebounding totals.
The broader interpretations are supported by those facts, but they have limits.
For example, Cleveland’s 43% three-point shooting shows that the Cavaliers converted a high proportion of their attempts relative to Philadelphia’s 28%. It does not reveal whether those attempts were open, contested, created by isolation plays, or generated through off-ball movement.
Likewise, the 41 assists indicate a high number of credited assisted field goals, but they do not reveal the complete quality of every possession. A full tactical evaluation would require shot charts, possession data, player minutes, and play-by-play records.
Three practical principles help readers analyze NBA statistics more carefully:
- Separate individual and team production. A player’s point total should be considered alongside shooting efficiency, assists, rebounds, and the team’s overall performance.
- Compare both volume and efficiency. Forty-six three-point attempts and 20 makes tell a different story from 46 attempts and 12 makes.
- Avoid conclusions that the data cannot support. Without individual shooting splits or detailed play-by-play information, claims about a player’s exact efficiency or a particular defensive mistake remain unverified.
These principles are useful beyond this matchup. They help readers evaluate box scores without confusing a memorable scoring total with a complete account of a player’s contribution.
Head-to-Head Record and Season-Series Context
The supplied matchup summary lists the following Cleveland-Philadelphia results for the 2025-26 season:
| Game date | Result |
| November 6, 2025 | Cleveland 132, Philadelphia 121 |
| January 15, 2026 | Cleveland 133, Philadelphia 107 |
| January 17, 2026 | Cleveland 117, Philadelphia 115 |
| March 10, 2026 | Cleveland 115, Philadelphia 101 |
These results show Cleveland winning all four listed meetings, with margins of 11, 26, two, and 14 points, respectively.
The January 15 game was the most decisive of the four listed matchups by point margin. The January 17 result was much closer, with Cleveland winning by two points.
There is a small data-quality issue in the supplied head-to-head notes: the season-series summary says Cleveland led 2-0 heading into the listed matchup section, while the table includes four games from the season. The 2-0 statement appears to refer to an earlier point in the season rather than the completed set of results shown here.
For that reason, the four listed results should be treated as the supplied season-series record, while the 2-0 description should not be presented as the final head-to-head tally.
The scores also illustrate why one game should not be used to predict every future meeting. Cleveland’s January 15 win was convincing, but the two-point result on January 17 shows that the margin could be much narrower in another matchup.
Starting Lineups and Player Roles
The starting lineups provide context for understanding how both teams approached the game.
Cleveland Cavaliers lineup
| Position group | Starting players |
| Guards | Donovan Mitchell, Darius Garland |
| Frontcourt | Jarrett Allen, Evan Mobley |
| Additional starter | Jaylon Tyson |
Philadelphia 76ers lineup
| Position group | Starting players |
| Guard and wing group | Paul George, Tyrese Maxey, VJ Edgecombe |
| Frontcourt | Joel Embiid, Dominick Barlow |
These groupings are descriptive rather than official positional assignments for every player. NBA players frequently switch roles depending on the lineup, opponent, and possession.
Cleveland’s lineup placed two established scoring guards alongside Allen and Mobley in the frontcourt. That combination provided a mix of perimeter creation and interior size.
Philadelphia’s listed lineup included Embiid as a major interior scoring option, George and Maxey as perimeter creators, and Barlow and Edgecombe as additional members of the starting group.
The result cannot be explained simply by listing the starting five. Individual minutes, bench rotations, player availability, and lineup efficiency all affect how a game develops. The available data establishes the starters but does not provide enough information to calculate the exact performance of each five-player combination.
How to Read the 76ers vs Cleveland Cavaliers Box Score
Readers looking for a quick explanation of a basketball game can follow a simple sequence.
Step 1: Start with the score
Cleveland won 133-107, a margin of 26 points. That establishes the result but not the reasons behind it.
Step 2: Compare shooting
Cleveland shot approximately 53% from the field and 43% from three-point range. Philadelphia shot approximately 40% from the field and 28% from three-point range.
The difference in conversion rates provides a strong starting point for understanding the outcome.
Step 3: Examine the leading players
Mitchell’s 35 points and nine assists show his scoring and playmaking production. Mobley’s 13 rebounds identify him as Cleveland’s leading rebounder. Embiid’s 20 points and George’s 17 points identify Philadelphia’s leading scorers.
These totals provide individual context, but they should not replace a complete evaluation of efficiency and overall contribution.
Step 4: Review possession-related statistics
Rebounds, turnovers, and steals help explain how teams gain or lose possessions. Cleveland collected 10 more rebounds, while Philadelphia committed three fewer turnovers and recorded three more steals.
This combination is more informative than looking at any one category alone.
Step 5: Use quarter scores to understand game flow
Cleveland’s 15-point first-quarter advantage was followed by a competitive second quarter and continued scoring advantages in the third and fourth. The quarter totals explain how the lead developed and why Philadelphia’s second-quarter response did not change the final outcome.
Following this sequence makes it easier to turn a box score into a structured, evidence-based game analysis.
Official Game Information and Statistical Reliability
The supplied game data identifies ESPN as the source of the box score and game recap. For readers who want to check the original figures, the official game page is the most relevant starting point.
Player totals, shooting percentages, and team statistics should be checked against the same game record to avoid mixing information from different meetings between the teams. This is especially important for season-series tables, because the two teams played multiple games against each other during the season.
The following distinction is also important when reviewing statistical data:
- Recorded statistics: Points, field goals, rebounds, assists, steals, blocks, and turnovers are box-score categories.
- Calculated statistics: Shooting percentages can be calculated by dividing makes by attempts.
- Interpretations: Statements about offensive flow, defensive pressure, and tactical effectiveness are analytical conclusions drawn from the available evidence.
The first two categories can be checked directly against the game statistics. The third requires careful wording and, for more detailed conclusions, additional information such as shot charts and play-by-play records.
The supplied data is sufficient to explain the main statistical differences in this game. It does not provide complete individual lines for every player, so missing figures should not be filled in with estimates.
Where to Find the Official Box Score
Readers can consult the official ESPN box score to verify the final score and recorded player statistics for the January 15 matchup.
Checking the original box score is especially useful when comparing individual performances. Points alone do not show shooting efficiency, and rebounds alone do not distinguish offensive boards from defensive boards. A complete player line provides more context for evaluating a player’s contribution.
For this game, the most important confirmed figures are Cleveland’s 133 points, Mitchell’s 35 points and nine assists, Mobley’s 13 rebounds, and Philadelphia’s 107 points. These numbers, combined with the shooting and team totals, provide a reliable foundation for understanding the result.
Frequently Asked Questions
1. What was the final score of the 76ers vs Cleveland Cavaliers game on January 15, 2026?
The Cleveland Cavaliers defeated the Philadelphia 76ers 133-107 at Xfinity Mobile Arena in Philadelphia. Cleveland won by 26 points after leading 33-18 in the first quarter.
2. Who scored the most points in the game?
Donovan Mitchell was the leading scorer with 35 points for Cleveland. Darius Garland added 20 points, while Philadelphia’s leading scorer was Joel Embiid with 20 points.
3. How many rebounds did Evan Mobley record?
Evan Mobley recorded 13 rebounds, the highest individual rebound total identified in the supplied game data. Cleveland finished with 52 total rebounds, compared with Philadelphia’s 42.
4. How did Paul George perform against Cleveland?
Paul George scored 17 points and recorded four assists. He was Philadelphia’s second-leading scorer behind Joel Embiid, who finished with 20 points.
5. Why did Cleveland beat Philadelphia by 26 points?
Cleveland’s main statistical advantages were its shooting efficiency, three-point production, assists, and rebounding. The Cavaliers made 50 field goals and 20 three-pointers, while Philadelphia made 36 field goals and 12 three-pointers. Cleveland also recorded 41 assists and 52 rebounds.
6. Which team shot better from three-point range?
Cleveland shot 43% from three-point range, making 20 of 46 attempts. Philadelphia shot 28%, making 12 of 43 attempts. Cleveland’s eight additional three-pointers represented a major difference in perimeter scoring.
Conclusion
The January 15, 2026, matchup between Cleveland and Philadelphia demonstrated how shooting efficiency, ball movement, and rebounding can combine to produce a decisive NBA result. Cleveland’s 133-107 victory was supported by 50 made field goals, 20 three-pointers, 41 assists, and 52 rebounds.
Donovan Mitchell led the Cavaliers with 35 points and nine assists, while Evan Mobley secured 13 rebounds and Darius Garland contributed 20 points. De’Andre Hunter added 17 points from the bench. For Philadelphia, Joel Embiid scored 20 points, Paul George recorded 17 points and four assists, and Andre Drummond led the team with nine rebounds.
Philadelphia’s 88% free-throw shooting and higher steal total were positive statistical contributions, but they could not compensate for the gap in field-goal and three-point efficiency. Cleveland also recorded 19 more assists and finished with a 10-rebound advantage.
The most useful lesson from this game is that a box score should be read as a connected set of statistics rather than a collection of isolated numbers. Individual scoring identifies the leading performers, shooting percentages reveal conversion efficiency, and assists and rebounds help explain broader team performance. Together, these figures provide a clearer understanding of why Cleveland controlled the matchup and why Philadelphia struggled to close the gap.