Carolina Panthers vs New York Jets Match Player Stats
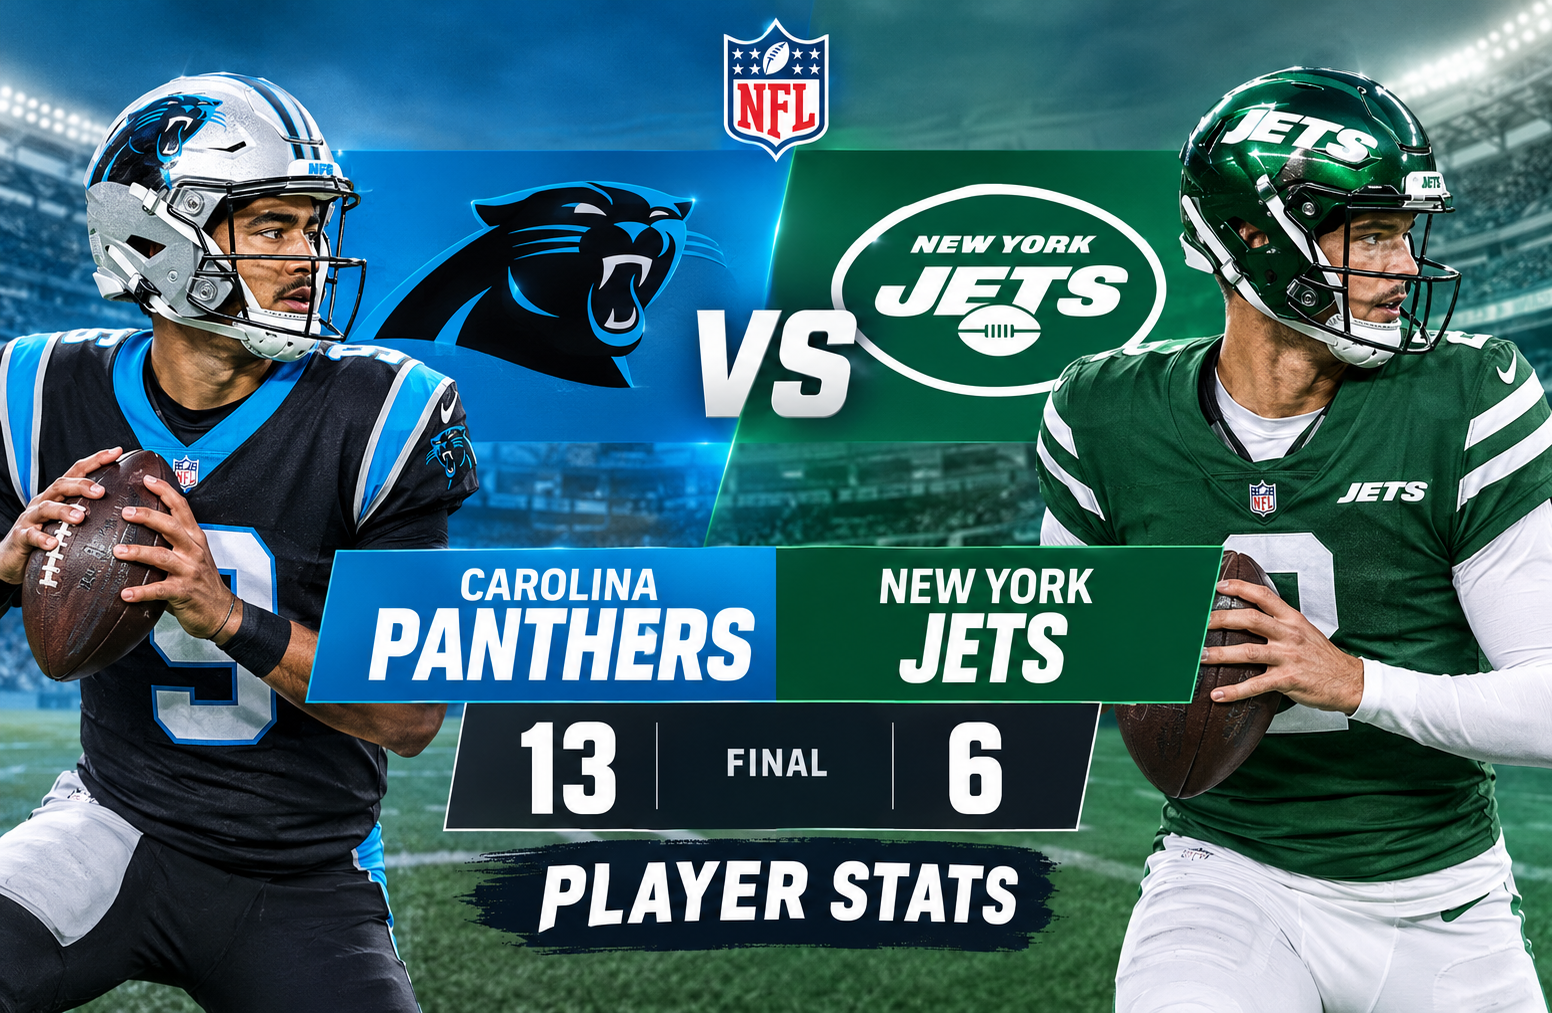
The Carolina Panthers vs New York Jets match player stats from October 19, 2025, tell the story of a defensive battle in which Carolina earned a 13-6 road victory over New York. The Panthers combined a touchdown pass from Bryce Young to Xavier Legette, a productive rushing performance from Rico Dowdle, and a defense that recorded six sacks and two interceptions. New York moved the ball at times but struggled to turn its opportunities into touchdowns, finishing without a passing touchdown and throwing two interceptions.
The final score only explains part of the game. Carolina finished with 302 combined passing and rushing yards, while the Jets produced 220. The Panthers also held a substantial advantage in sacks and turnovers, giving their offense more opportunities to protect its lead. For the Jets, six sacks allowed and two interceptions thrown proved costly in a game where Nick Folk converted both field-goal attempts.
This detailed breakdown examines the final score, quarter-by-quarter scoring, quarterback performances, rushing and receiving leaders, defensive contributions, special teams, and the statistics that best explain the outcome. It also highlights an important distinction when evaluating football box scores: total yards show how much ground a team covered, but turnovers, touchdowns, and pressure often explain why one team wins.
Carolina Panthers vs New York Jets Match Player Stats: Final Score and Game Summary
The Panthers defeated the Jets 13-6 on October 19, 2025. Carolina scored in three separate quarters, while New York managed one field goal in the second quarter and another in the fourth.
| Game information | Result |
| Matchup | Carolina Panthers vs New York Jets |
| Date | October 19, 2025 |
| Final score | Panthers 13, Jets 6 |
| Winning team | Carolina Panthers |
| Panthers record shown | 4-3 overall, 1-3 away |
| Jets record shown | 0-7 overall, 0-5 home |
| Panthers points | 13 |
| Jets points | 6 |
| Panthers passing touchdowns | 1 |
| Jets passing touchdowns | 0 |
| Panthers interceptions | 2 recorded by the defense |
| Jets interceptions | 0 recorded by the defense |
Main takeaway: Carolina did not need a high-scoring offensive performance to win. The Panthers controlled enough of the rushing game, avoided interceptions on offense, and generated six sacks and two interceptions on defense. Those advantages helped compensate for a passing offense that produced fewer than 200 yards.
The Jets had some productive individual performances, especially from receiver Tyler Johnson, but could not turn their passing and rushing opportunities into a touchdown. Their defense recorded two sacks, yet the offense’s inability to score a touchdown left little room for error.
Quarter-by-quarter scoring
| Quarter | Carolina Panthers | New York Jets |
| First quarter | 3 | 0 |
| Second quarter | 7 | 3 |
| Third quarter | 3 | 0 |
| Fourth quarter | 0 | 3 |
| Final | 13 | 6 |
Carolina opened the scoring with three points in the first quarter. The Panthers then added a touchdown in the second quarter to establish a 10-3 halftime lead. A field goal in the third quarter increased the margin to 13-3.
New York scored three points in the second quarter and three more in the fourth. However, the Jets never reached the end zone, leaving them seven points short of Carolina’s final total.
The scoring pattern reveals how the Panthers managed the game. Their offense produced enough points early to build a cushion, while the defense prevented New York from responding with a touchdown. The Jets’ fourth-quarter field goal reduced the deficit but did not fundamentally change the situation.
Team Statistics: Panthers vs Jets
Team-level statistics help explain the difference between the two offenses. Carolina generated more total yards and first downs while protecting the football through the passing game. New York recorded fewer total yards and gave the ball away twice through interceptions.
| Team statistic | Carolina Panthers | New York Jets |
| Passing yards | 177 | 139 |
| Rushing yards | 125 | 81 |
| Total yards | 302 | 220 |
| Pass completions/attempts | 19/32 | 16/34 |
| Completion percentage | 59.4% | 47.1% |
| Yards per pass attempt | 5.5 | 4.1 |
| Rushing attempts | 36 | 20 |
| Yards per rushing attempt | 3.5 | 4.1 |
| Passing touchdowns | 1 | 0 |
| Interceptions thrown | 0 | 2 |
| Sacks allowed | 2 | 6 |
| Total sacks recorded by defense | 6 | 2 |
| Receiving yards | 198 | 172 |
| Receiving touchdowns | 1 | 0 |
Statistical note: Passing, rushing, and receiving totals are reported separately because receiving yards include yards gained after completed passes, while passing yards exclude certain sack losses. The team passing and rushing figures should not be added to receiving yards to calculate total offense.
Carolina’s 82-yard advantage in combined passing and rushing production was meaningful, but the most revealing numbers were the six sacks and two interceptions recorded by its defense. New York’s offense faced repeated negative plays and failed to throw a touchdown.
The Panthers’ offense also benefited from balance. Their 36 rushing attempts helped keep the running game involved, while 32 pass attempts gave Bryce Young and Andy Dalton opportunities to distribute the ball without forcing a high-risk passing approach.
The Jets averaged more yards per rushing attempt, at 4.1 compared with Carolina’s 3.5. That figure is worth noting, but it does not automatically mean New York had the better rushing offense. Carolina ran 16 more times and accumulated 44 additional rushing yards. Volume, game situation, and the effect of sacks all matter when comparing team performance.
Carolina Panthers Passing Stats
Carolina used Bryce Young as its primary passer, with Andy Dalton also appearing in the passing statistics. Young threw the team’s touchdown pass and finished without an interception. Dalton added 60 passing yards without a touchdown or interception.
Bryce Young player stats
| Statistic | Bryce Young |
| Completions/attempts | 15/25 |
| Completion percentage | 60.0% |
| Passing yards | 138 |
| Average yards per attempt | 5.5 |
| Passing touchdowns | 1 |
| Interceptions | 0 |
| Sacks taken | 1 |
| Sack yards lost | 12 |
| QBR | 60.1 |
| Passer rating | 88.4 |
Young completed 15 of 25 attempts for 138 yards and threw one touchdown without an interception. His 88.4 passer rating reflected a controlled performance rather than a high-volume passing display.
The important contribution was his ability to produce a touchdown while avoiding the turnovers that damaged New York’s chances. A quarterback does not always need to throw for 300 yards to play a winning role. In a low-scoring game, protecting possession and making the most of scoring opportunities can be more valuable than accumulating passing yards.
Young also contributed 10 rushing yards on two carries. Those gains gave Carolina another way to move the ball, although the supplied statistics do not establish how many of those carries were designed runs or scrambles.
One area for context is efficiency. Young’s 5.5 yards per attempt was modest, so his passing performance should not be mistaken for an explosive aerial attack. Carolina’s overall success came from combining efficient decision-making with a productive rushing workload and strong defensive pressure.
Andy Dalton player stats
| Statistic | Andy Dalton |
| Completions/attempts | 4/7 |
| Completion percentage | 57.1% |
| Passing yards | 60 |
| Average yards per attempt | 8.6 |
| Passing touchdowns | 0 |
| Interceptions | 0 |
| Sacks taken | 1 |
| Sack yards lost | 9 |
| QBR | 28.0 |
| Passer rating | 85.4 |
Dalton completed four of seven attempts for 60 yards. His average of 8.6 yards per attempt was higher than Young’s, but the sample was much smaller. Seven attempts are not enough to conclude that Dalton was more effective overall.
He did not throw a touchdown or an interception. His contribution gave Carolina additional passing production while maintaining possession, although one sack resulted in a nine-yard loss.
Carolina’s passing offense as a whole
The Panthers finished with 19 completions on 32 attempts, 177 passing yards, one touchdown, and no interceptions. They allowed two sacks for a combined loss of 21 yards.
The lack of interceptions was particularly important. Carolina could continue using its offense to manage the game without giving New York additional possessions through passing mistakes. The Panthers did not need to dominate through the air because their defense repeatedly limited the Jets’ ability to respond.
New York Jets Passing Stats
New York used Tyrod Taylor and Justin Fields in the passing game. Neither quarterback threw a touchdown, and Taylor’s two interceptions were a major factor in the Jets’ inability to mount a comeback.
Tyrod Taylor player stats
| Statistic | Tyrod Taylor |
| Completions/attempts | 10/22 |
| Completion percentage | 45.5% |
| Passing yards | 126 |
| Average yards per attempt | 5.7 |
| Passing touchdowns | 0 |
| Interceptions | 2 |
| Sacks taken | 3 |
| Sack yards lost | 12 |
| QBR | 11.4 |
| Passer rating | 25.9 |
Taylor completed 10 of 22 attempts for 126 yards, but he threw two interceptions and failed to produce a passing touchdown. His 25.9 passer rating illustrates how difficult his passing performance was, especially when turnovers and missed completions are considered together.
The two interceptions were particularly damaging because the Jets were playing from behind for much of the game. When an offense is trailing, it needs to sustain drives and convert possessions into points. Interceptions make that task more difficult by ending drives and potentially giving the opposition advantageous field position.
Taylor was also sacked three times for 12 yards. Those losses contributed to the pressure facing New York’s offense and reduced the value of its completed passes.
Justin Fields player stats
| Statistic | Justin Fields |
| Completions/attempts | 6/12 |
| Completion percentage | 50.0% |
| Passing yards | 46 |
| Average yards per attempt | 3.8 |
| Passing touchdowns | 0 |
| Interceptions | 0 |
| Sacks taken | 3 |
| Sack yards lost | 21 |
| QBR | 10.1 |
| Passer rating | 59.7 |
Fields completed six of 12 passes for 46 yards without a touchdown or interception. He was sacked three times for a combined loss of 21 yards.
His passing line shows why completion percentage alone cannot tell the full story. Fields completed half his attempts, but his 3.8 yards per attempt indicated limited production through the air. The three sacks also reduced the offense’s ability to sustain drives.
Fields added 22 rushing yards on four carries. That gave him a useful contribution as a runner, but it did not offset the limited passing output or the absence of a touchdown.
New York’s passing offense as a whole
The Jets finished with 16 completions on 34 attempts, 139 passing yards, no touchdowns, and two interceptions. They also allowed six sacks for 33 yards.
The difference between the teams was not simply the number of completed passes. Carolina completed 59.4% of its attempts, compared with New York’s 47.1%. More importantly, the Panthers threw one touchdown and no interceptions, while the Jets threw no touchdowns and two interceptions.
For a low-scoring contest, that combination created a decisive advantage for Carolina.
Carolina Panthers Rushing Stats
The Panthers’ ground game provided a steady foundation for their offense. Rico Dowdle led the team with 79 rushing yards on 17 carries, while Chuba Hubbard recorded 31 yards on 14 attempts.
Carolina rushing leaders
| Player | Carries | Rushing yards | Average | Longest run | TDs |
| Rico Dowdle | 17 | 79 | 4.6 | 13 | 0 |
| Chuba Hubbard | 14 | 31 | 2.2 | 11 | 0 |
| Bryce Young | 2 | 10 | 5.0 | 6 | 0 |
| Jimmy Horn Jr. | 1 | 7 | 7.0 | 7 | 0 |
| Andy Dalton | 2 | -2 | -1.0 | -1 | 0 |
| Team total | 36 | 125 | 3.5 | 13 | 0 |
Rico Dowdle’s contribution
Dowdle’s 79 yards on 17 carries made him Carolina’s leading rusher. His 4.6-yard average was the strongest among the Panthers’ primary ball carriers, and his longest run covered 13 yards.
His production helped Carolina maintain a credible rushing threat without relying entirely on Young’s arm. Seventeen carries also represented a substantial share of the team’s 36 rushing attempts.
Dowdle’s performance is best understood through workload and consistency rather than touchdowns. He did not score on the ground, but he gained positive yardage often enough to help the offense remain balanced. In a game decided by seven points, those ordinary gains can help a team avoid predictable passing situations.
Chuba Hubbard’s rushing performance
Hubbard recorded 31 yards on 14 carries, averaging 2.2 yards per attempt. That was considerably less productive than Dowdle’s rushing output.
The contrast between the two runners suggests that Carolina’s ground game was effective in aggregate but uneven between individual players. Hubbard’s workload still helped the Panthers maintain their running threat and use time between possessions.
The supplied statistics do not provide a play-by-play explanation for his lower average, so it would be inaccurate to attribute it to a specific defensive scheme or blocking problem.
Carolina’s rushing approach
The Panthers finished with 125 rushing yards on 36 attempts. They averaged 3.5 yards per carry and did not record a rushing touchdown.
The running game was not explosive, but it gave Carolina another way to advance the ball. Combined with a turnover-free passing performance, it supported a game plan centered on limiting mistakes and allowing the defense to protect the lead.
New York Jets Rushing Stats
New York produced 81 rushing yards on 20 carries, averaging 4.1 yards per attempt. Breece Hall led the Jets in carries and rushing yards, while Fields provided an additional running threat.
New York rushing leaders
| Player | Carries | Rushing yards | Average | Longest run | TDs |
| Breece Hall | 11 | 38 | 3.5 | 8 | 0 |
| Justin Fields | 4 | 22 | 5.5 | 7 | 0 |
| Tyrod Taylor | 3 | 11 | 3.7 | 5 | 0 |
| Isaiah Davis | 2 | 10 | 5.0 | 5 | 0 |
| Team total | 20 | 81 | 4.1 | 8 | 0 |
Breece Hall’s role
Hall led New York with 38 rushing yards on 11 carries. He averaged 3.5 yards per attempt and added 14 receiving yards on two catches.
His combined contribution of 52 yards from rushing and receiving gave the Jets another outlet beyond the passing game. However, he did not score a touchdown, and the team did not generate enough overall offense to turn its possession into a scoring advantage.
Hall’s workload was lower than the combined workload of Carolina’s two main running backs. That difference does not, by itself, establish why the Jets ran less often, but it highlights the greater emphasis Carolina placed on its ground game.
Justin Fields as a runner
Fields added 22 rushing yards on four carries, averaging 5.5 yards per attempt. His rushing average was the highest among the Jets’ listed ball carriers with more than one attempt, although the sample was small.
His ability to gain yards on the ground gave New York a second method of moving the ball. Nevertheless, his rushing production could not compensate for the limited passing output, three sacks, and the lack of a passing touchdown in the supplied statistics.
Comparing the two rushing attacks
Carolina gained 125 rushing yards on 36 carries, while New York gained 81 on 20 carries. The Jets averaged more yards per attempt, but Carolina gained 44 more rushing yards because it ran the ball more frequently.
This is an important statistical distinction. A higher average measures efficiency per attempt, while total yards measure cumulative production. Both figures are useful, but neither should be interpreted without considering the number of carries, the score, and the rest of the offensive performance.
Carolina Panthers Receiving Stats
Carolina’s receiving unit produced 198 yards on 19 receptions and 31 targets. Xavier Legette led the group with 92 receiving yards and the game’s listed Carolina receiving touchdown.
Carolina receiving leaders
| Player | Receptions | Targets | Yards | Average | Longest | TDs |
| Xavier Legette | 9 | 11 | 92 | 10.2 | 33 | 1 |
| Tetairoa McMillan | 3 | 5 | 33 | 11.0 | 11 | 0 |
| Chuba Hubbard | 2 | 3 | 24 | 12.0 | 26 | 0 |
| Mitchell Evans | 2 | 3 | 24 | 12.0 | 13 | 0 |
| Rico Dowdle | 1 | 2 | 17 | 17.0 | 17 | 0 |
| Jimmy Horn Jr. | 1 | 2 | 8 | 8.0 | 8 | 0 |
| Tommy Tremble | 1 | 1 | 0 | 0.0 | 0 | 0 |
| Ja’Tavion Sanders | 0 | 2 | 0 | 0.0 | 0 | 0 |
| Jalen Coker | 0 | 2 | 0 | 0.0 | 0 | 0 |
| Team total | 19 | 31 | 198 | 10.4 | 33 | 1 |
The team receiving total is presented as supplied in the game statistics. Individual player rows may not add to the team total in every data feed, so consult the official box score when exact reconciliation is required.
Xavier Legette leads Carolina’s receivers
Legette was Carolina’s most productive receiver, catching nine passes for 92 yards and one touchdown on 11 targets. His longest reception covered 33 yards.
Three aspects of this performance stand out:
- Target involvement: Legette received 11 targets, the highest total among Carolina’s listed receivers.
- Reliable production: He caught nine passes, giving Young a dependable option throughout the passing game.
- Scoring impact: His touchdown supplied a key part of Carolina’s 13-point total.
Legette’s nine catches represented a substantial portion of the team’s 19 completions. That made him an important part of the passing plan, especially in a game where Carolina did not produce a large number of passing yards.
His 92 receiving yards also accounted for nearly half of the team’s listed 198 receiving yards. While receiving yards are not identical to team passing yards in every statistical presentation, Legette’s individual production clearly identifies him as the Panthers’ leading pass catcher.
Tetairoa McMillan adds complementary production
McMillan recorded three receptions for 33 yards on five targets. He averaged 11 yards per catch, giving Carolina another receiver capable of making meaningful gains.
His longest reception was 11 yards, so his contribution came through several moderate gains rather than a long catch. In a close game, these completions can help an offense keep drives alive and avoid placing every passing responsibility on its leading receiver.
Contributions from Carolina’s running backs and tight ends
Hubbard caught two passes for 24 yards, including a 26-yard reception. Dowdle added 17 receiving yards on one catch, while Mitchell Evans also recorded two receptions for 24 yards.
These contributions mattered because Carolina did not rely on Legette alone. Passes to running backs and other receiving options gave the offense additional ways to gain yards.
Tommy Tremble caught one pass but did not gain a receiving yard. Ja’Tavion Sanders and Jalen Coker were targeted twice each without recording a catch in the supplied data.
The numbers show that targets do not automatically become receptions. When evaluating a receiver, it is useful to examine catches, targets, yards, and touchdowns together rather than treating a single statistic as a complete measure of performance.
New York Jets Receiving Stats
The Jets finished with 16 receptions for 172 receiving yards on 31 targets. Tyler Johnson led New York with 60 yards, while Mason Taylor and Josh Reynolds each recorded three catches.
New York receiving leaders
| Player | Receptions | Targets | Yards | Average | Longest | TDs |
| Tyler Johnson | 3 | 5 | 60 | 20.0 | 35 | 0 |
| Mason Taylor | 3 | 4 | 31 | 10.3 | 13 | 0 |
| Josh Reynolds | 3 | 9 | 29 | 9.7 | 12 | 0 |
| Isaiah Davis | 2 | 3 | 22 | 11.0 | 12 | 0 |
| Allen Lazard | 2 | 3 | 16 | 8.0 | 9 | 0 |
| Breece Hall | 2 | 3 | 14 | 7.0 | 8 | 0 |
| Arian Smith | 1 | 3 | 0 | 0.0 | 0 | 0 |
| Jeremy Ruckert | 0 | 1 | 0 | 0.0 | 0 | 0 |
| Team total | 16 | 31 | 172 | 10.8 | 35 | 0 |
Individual receiving figures are reproduced from the supplied statistics. Arian Smith’s listed reception with zero receiving yards is retained as reported.
Tyler Johnson’s explosive receiving average
Johnson caught three passes for 60 yards on five targets. His 20-yard average was the highest among the Jets’ listed receivers, and his longest catch covered 35 yards.
Johnson demonstrated the ability to generate substantial yardage when a pass was completed. His performance was one of the more productive individual elements of New York’s passing offense.
However, three catches for 60 yards did not translate into a touchdown. That distinction helps explain the difference between an encouraging individual stat line and a successful team passing performance. New York’s receivers generated yards, but the offense did not finish a passing drive with a touchdown.
Mason Taylor and Josh Reynolds
Taylor caught three passes for 31 yards on four targets. His 75% catch rate was based on a relatively small number of opportunities, but his production gave the Jets another option in the passing game.
Reynolds also caught three passes, finishing with 29 yards on nine targets. His 33.3% catch rate was much lower than Taylor’s, and his total yardage remained limited despite the larger target count.
That contrast shows why targets deserve attention. A player receiving nine targets may have a meaningful role in the offense, but the number alone does not demonstrate successful execution. Catch rate and yards gained help place the workload in context.
Why New York’s receiving production was not enough
The Jets’ receivers averaged 10.8 yards per catch, slightly higher than Carolina’s listed 10.4. Yet New York did not score a receiving touchdown.
This is a useful reminder that yards per catch do not measure scoring efficiency. A receiver can produce several large gains without finishing a drive, while a shorter reception in the right situation can move an offense closer to the end zone.
The Jets’ receiving group had some productive moments, but its output was undermined by interceptions, sacks, and the absence of a touchdown pass.
Defensive Player and Team Statistics
Defense was central to Carolina’s victory. The Panthers recorded six sacks, 11 quarterback hits, nine passes defended, and two interceptions. New York recorded two sacks, seven quarterback hits, seven passes defended, and six tackles for loss.
Defensive comparison
| Defensive statistic | Carolina Panthers | New York Jets |
| Total tackles | 60 | 75 |
| Solo tackles | 32 | 44 |
| Sacks | 6 | 2 |
| Tackles for loss | 3 | 6 |
| Passes defended | 9 | 7 |
| Quarterback hits | 11 | 7 |
| Interceptions | 2 | 0 |
| Defensive touchdowns | 0 | 0 |
The Jets recorded more tackles, but Carolina generated more sacks and interceptions. A higher tackle count does not necessarily indicate a better defensive performance. It can also reflect the number of plays an opponent runs or the amount of time a defense spends on the field.
Carolina’s six sacks stand out because they directly disrupted New York’s passing attack. The Panthers also recorded two interceptions, giving the defense another way to end possessions without allowing a scoring drive to continue.
New York’s defense had its own positive contributions. Six tackles for loss show that the Jets were able to disrupt plays behind or near the line of scrimmage. However, two sacks and no interceptions were not enough to offset the Panthers’ defensive production.
Jaycee Horn’s two interceptions
Jaycee Horn was credited with two interceptions for Carolina, with no return yards or defensive touchdowns listed.
Interceptions are among the most influential events in football because they end the offense’s possession and transfer the ball to the opposing team. They can also prevent an offense from converting a promising drive into points.
Horn’s two interceptions were particularly significant in a six-point Jets performance. New York needed to protect possession and finish drives with touchdowns, but turnovers made that task harder.
The supplied data does not specify the exact timing, field position, or play sequence for both interceptions. It would therefore be inaccurate to assign either interception to a particular quarter or claim that one directly produced Carolina’s touchdown without consulting the play-by-play record.
Carolina’s pass rush
The Panthers recorded six sacks and 11 quarterback hits. Those numbers indicate consistent disruption of New York’s passing game.
The Jets’ quarterbacks were sacked six times for a combined loss of 33 yards. Those losses reduced the offense’s net passing output and often left the team facing more difficult down-and-distance situations.
Pressure does not always lead to a sack. Quarterback hits can affect timing and make a passer less comfortable in the pocket. Carolina’s combination of sacks, hits, and interceptions provides a stronger explanation of its defensive success than any one category alone.
New York’s defensive effort
The Jets recorded 75 total tackles, 44 solo tackles, six tackles for loss, and two sacks. They also defended seven passes and recorded seven quarterback hits.
Those figures show that the defense was active and generated some negative plays. The final score was close enough that the Jets’ defense remained competitive, holding Carolina to 13 points.
However, the Panthers still completed one touchdown pass and avoided interceptions. New York’s defense did not produce the takeaways that could have helped its offense overcome a difficult passing performance.
Special Teams Stats: Kicking, Punting, and Returns
Special teams had a direct impact on the final score. Both kickers made their field-goal attempts, but Carolina’s touchdown gave the Panthers an advantage that New York could not match.
Kicking statistics
| Statistic | Ryan Fitzgerald, Carolina | Nick Folk, New York |
| Field goals made/attempted | 2/2 | 2/2 |
| Field-goal accuracy | 100% | 100% |
| Longest field goal | 30 yards | 47 yards |
| Extra points made/attempted | 1/1 | 0/0 |
| Total points | 7 | 6 |
Fitzgerald scored seven points through two field goals and one extra point. Folk scored six points through two field goals.
Both kickers were perfect on their recorded attempts. The difference came from the extra point associated with Carolina’s touchdown. Because New York did not score a touchdown, Folk had no extra-point attempt.
This comparison also shows why the final score cannot be explained by kicking accuracy alone. Both teams converted all their field goals, but Carolina’s offense generated the game’s only listed touchdown.
Punting statistics
| Statistic | Sam Martin, Carolina | Austin McNamara, New York |
| Punts | 6 | 5 |
| Total punt yards | 276 | 243 |
| Average | 46.0 | 48.6 |
| Longest punt | 68 yards | 56 yards |
| Touchbacks | 0 | 0 |
| Punts inside the 20 | 4 | 2 |
McNamara averaged 48.6 yards per punt, compared with Martin’s 46.0. Martin, however, placed four punts inside the 20-yard line, while McNamara recorded two.
Punting averages alone do not establish which player had the more valuable game. Distance matters, but so does where the ball lands and the field position the opposing offense receives.
Carolina’s four punts inside the 20 helped the team create situations in which New York had to cover more ground to reach scoring range. That was particularly useful for a defense that was already generating sacks and interceptions.
Kick and punt returns
| Team and returner | Return type | Returns | Yards | Average | Longest |
| Trevor Etienne, Carolina | Kick | 1 | 45 | 45.0 | 45 |
| Trevor Etienne, Carolina | Punt | 3 | 35 | 11.7 | 15 |
| Isaiah Williams, New York | Kick | 3 | 71 | 23.7 | 30 |
| Kene Nwangwu, New York | Kick | 1 | 29 | 29.0 | 29 |
| Isaiah Williams, New York | Punt | 2 | 14 | 7.0 | 14 |
Etienne recorded a 45-yard kickoff return and 35 yards on three punt returns. His kickoff return provided Carolina with a substantial gain in field position.
New York’s kick returners combined for 100 yards on four returns. Williams handled three of those returns for 71 yards, while Nwangwu added 29 yards on one return.
These plays did not produce a return touchdown, but they influenced the starting positions for offensive drives. In a low-scoring contest, field position can affect how many first downs a team needs to reach field-goal range.
What Decided the Panthers vs Jets Game?
The final score was 13-6, but several statistical differences help explain how Carolina secured the win.
1. Carolina protected the ball
The Panthers’ listed passing statistics showed zero interceptions. New York’s passing offense threw two.
This difference gave Carolina a more stable offensive foundation. The Panthers did not need to create a large number of explosive plays because they avoided the turnovers that could have put their lead at risk.
2. The Panthers pressured the quarterback
Carolina recorded six sacks, compared with two for New York. The Jets also lost 33 yards on sacks, while Carolina lost 21.
Sacks do more than reduce passing yardage. They can place an offense in long-yardage situations, limit its play options, and make it harder to sustain a drive. The Panthers’ pass rush repeatedly created that challenge.
3. Carolina generated more total offense
The Panthers produced 302 combined passing and rushing yards, while the Jets finished with 220. Carolina’s 125 rushing yards also exceeded New York’s 81.
Although the Jets had a higher rushing average, Carolina’s greater rushing volume contributed to its overall yardage advantage.
4. The Jets failed to score a touchdown
New York scored two field goals but did not record a passing touchdown. Carolina produced one touchdown pass and two field goals.
That was the central scoring difference. Even though the Jets made both of their field goals, they could not find the end zone to close the gap.
5. Carolina made its scoring opportunities count
The Panthers scored 10 points in the first half and added three in the third quarter. That gave the defense a lead to protect throughout the final period.
New York’s fourth-quarter field goal reduced the deficit to seven points, but the Jets needed a touchdown and another scoring opportunity to change the result. Carolina’s defense prevented that response.
Carolina Panthers vs New York Jets Match Player Stats: Key Takeaways
The individual numbers provide several useful lessons for understanding the game beyond the final score.
- Bryce Young delivered the key passing touchdown. He completed 15 of 25 attempts for 138 yards, one touchdown, and no interceptions.
- Rico Dowdle led the rushing game. His 79 yards on 17 carries gave Carolina its strongest individual rushing contribution.
- Xavier Legette was the leading receiver. He caught nine passes for 92 yards and a touchdown.
- Tyrod Taylor struggled with turnovers. He threw two interceptions and finished with a 25.9 passer rating.
- Justin Fields contributed as a runner. He gained 22 rushing yards but completed only six of 12 passes for 46 yards.
- Jaycee Horn delivered a major defensive contribution. He was credited with two interceptions.
- Carolina’s pass rush created the biggest defensive advantage. Six sacks compared with New York’s two disrupted the Jets’ offensive rhythm.
- Both kickers converted their field goals. Carolina’s touchdown and extra point created the difference in scoring.
These statistics also demonstrate why player evaluation should combine individual performance with game context. A receiver’s yardage can look impressive even when his team fails to score a touchdown. A running back can contribute without finding the end zone. A quarterback can produce a winning performance without reaching 200 passing yards when he avoids turnovers and receives strong defensive support.
How to Read an NFL Box Score Accurately
A box score is most useful when its statistics are read together rather than in isolation. The following approach helps readers understand both individual performances and the factors behind the result.
Start with the final score and quarter breakdown
The score establishes the outcome, while quarter-by-quarter points show when the scoring occurred. Carolina’s first-half lead explains why the Panthers could approach the second half differently from the Jets.
Compare passing efficiency and turnovers
Look at completions, attempts, yards per attempt, touchdowns, interceptions, and sacks. Completion percentage alone does not measure the quality of a passing performance.
For example, Taylor completed 45.5% of his attempts and threw two interceptions. Young completed 60% and threw no interceptions. The difference was more meaningful than completion percentage alone.
Separate rushing volume from rushing efficiency
Carries and total yards measure workload and production. Yards per carry measures average efficiency. Carolina gained more total rushing yards because it ran the ball more often, while New York averaged more yards per attempt.
Examine receivers by targets and production
Receptions and receiving yards should be read alongside targets and touchdowns. Legette’s nine catches on 11 targets demonstrate both involvement and production, while Reynolds’ nine targets for 29 yards show why workload alone is not enough.
Evaluate defense using multiple categories
Sacks, interceptions, passes defended, quarterback hits, and tackles for loss measure different aspects of defensive performance. Carolina’s six sacks and two interceptions were more revealing in this game than the raw tackle totals.
Verify unusual or inconsistent figures
When a statistic appears inconsistent with another row, consult the official box score and play-by-play report before publishing a correction. Different statistical categories can use different accounting rules, and a data feed can sometimes present totals that do not reconcile cleanly.
For the complete game record, see the official ESPN box score for Panthers vs Jets.
Frequently Asked Questions
1. What was the final score of the Carolina Panthers vs New York Jets game?
The Carolina Panthers defeated the New York Jets 13-6 on October 19, 2025. Carolina scored one touchdown and two field goals, while New York scored two field goals without recording a touchdown.
2. Who was the leading receiver in the Panthers vs Jets game?
Xavier Legette led Carolina with nine receptions for 92 yards and one touchdown on 11 targets. For New York, Tyler Johnson led the team with 60 receiving yards on three catches.
3. How many passing yards did Bryce Young record against the Jets?
Bryce Young completed 15 of 25 passes for 138 yards and one touchdown. He threw no interceptions and finished with an 88.4 passer rating.
4. Which quarterback threw interceptions for the New York Jets?
Tyrod Taylor threw two interceptions while completing 10 of 22 passes for 126 yards. Justin Fields completed six of 12 passes for 46 yards without throwing an interception.
5. How many sacks did the Panthers record against the Jets?
Carolina recorded six sacks, compared with two by New York. The Panthers also recorded two interceptions, making defensive pressure and turnovers important differences in the final result.
6. Who led the Panthers and Jets in rushing yards?
Rico Dowdle led Carolina with 79 rushing yards on 17 carries. Breece Hall led New York with 38 rushing yards on 11 carries. The Panthers finished with 125 team rushing yards, while the Jets recorded 81.
Conclusion
The Carolina Panthers’ 13-6 victory over the New York Jets on October 19, 2025, was built on defensive pressure, ball security, and a balanced offensive approach. Bryce Young threw the game’s key touchdown, Xavier Legette led the receiving group with 92 yards, and Rico Dowdle paced the rushing attack with 79 yards.
Carolina’s six sacks and two interceptions were especially important because they prevented New York from developing a consistent passing attack. The Jets received useful contributions from Tyler Johnson and Breece Hall, but their inability to score a touchdown proved decisive.
The most important lesson from the Carolina Panthers vs New York Jets match player stats is that winning football does not always require a high-scoring offense. Carolina gained more total yards, avoided interceptions, and capitalized on its defensive advantages. New York’s two field goals were not enough to overcome the turnover gap and lack of touchdown production.
Taken together, the final score, quarterback statistics, rushing totals, receiving performances, and defensive numbers provide a clearer explanation of the result than any single player statistic could offer.