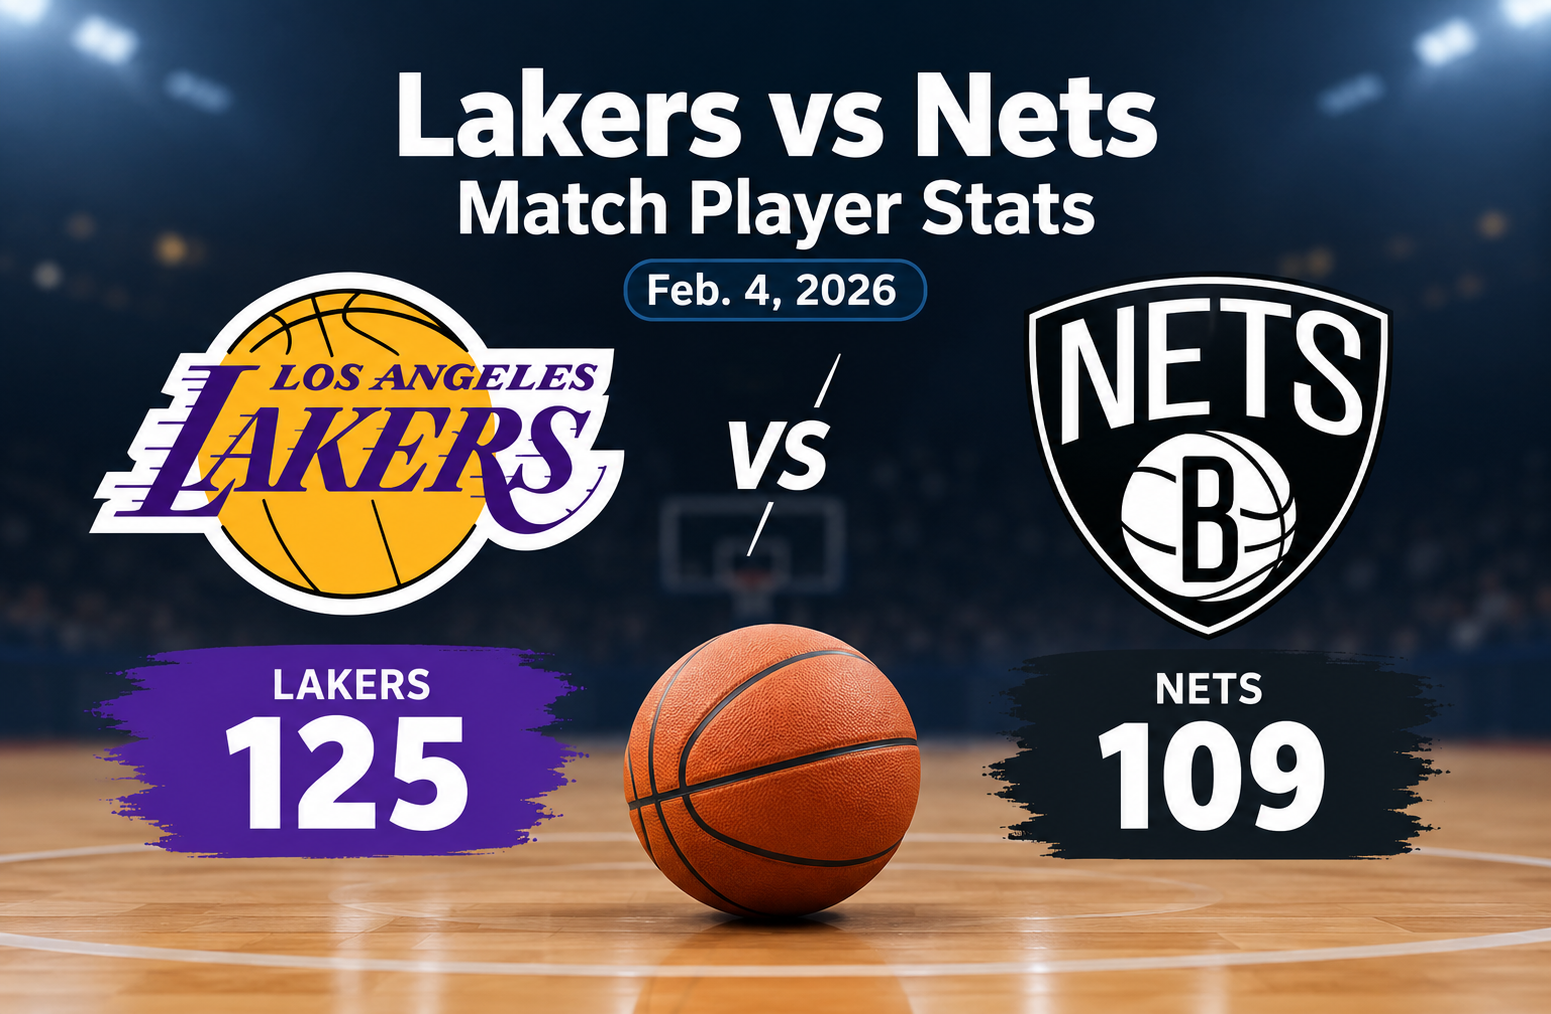
Lakers vs Brooklyn Nets Match Player Stats
The lakers vs brooklyn nets match player stats from February 4, 2026, provide a detailed picture of how the Los Angeles Lakers defeated the Brooklyn Nets 125-109 at Barclays Center. The final score shows a 16-point Lakers victory, but the box score reveals several different reasons for the result. Los Angeles produced an outstanding 45-point first quarter, shot 54% from the field, forced 20 Brooklyn turnovers, and received efficient scoring from several players around Luka Doncic and LeBron James.
Brooklyn had some strong individual performances of its own. Day’Ron Sharpe delivered one of the most productive all-around games on the Nets roster with 19 points, 14 rebounds, 5 assists and 3 steals. Michael Porter Jr. also posted 21 points and 10 rebounds. Ziaire Williams added 17 points while shooting 7-for-11 from the field.
However, the Lakers established control early. Their 45-23 advantage in the opening period created a 22-point gap that Brooklyn never completely erased. The Nets actually outscored Los Angeles 34-31 in the third quarter and 35-25 in the fourth, but the early deficit proved too large.
This article breaks down the team numbers, individual performances, shooting efficiency, ball security, rebounding, defensive activity and the game flow to explain what the statistics say about the matchup.
Lakers vs Brooklyn Nets Match Player Stats
The most important numbers from the game are summarized below.
| Category | Lakers | Nets |
| Final Score | 125 | 109 |
| Field Goals | 46-85 | 45-94 |
| Field Goal Percentage | 54% | 48% |
| Three-Pointers | 7-31 | 10-41 |
| Three-Point Percentage | 23% | 24% |
| Free Throws | 26-39 | 9-14 |
| Free-Throw Percentage | 67% | 64% |
| Total Rebounds | 41 | 48 |
| Assists | 25 | 28 |
| Turnovers | 12 | 20 |
| Steals | 14 | 7 |
| Offensive Rebounds | 10 | 16 |
| Defensive Rebounds | 31 | 32 |
| Personal Fouls | 13 | 21 |
The table immediately highlights an interesting feature of the game. Brooklyn won the rebounding battle 48-41 and had more assists, more offensive rebounds and more made three-pointers. Yet Los Angeles won comfortably.
That tells us that the result was not based on winning every statistical category. The Lakers were more efficient in several of the areas that had the greatest impact on possession value, particularly overall field-goal shooting and turnover creation.
Game Summary: Lakers 125, Nets 109
Los Angeles opened the game with extraordinary offensive efficiency.
The Lakers scored 45 points in the first quarter while Brooklyn managed only 23. A 45-point opening period is significant because it immediately changed the structure of the game. Instead of playing from an even starting point, Brooklyn had to spend the rest of the night trying to recover from a substantial deficit.
The second quarter was more competitive in terms of scoring, but Los Angeles still added 24 points while the Nets scored 17. At halftime, the Lakers therefore held a 69-40 advantage.
Brooklyn responded after halftime.
The Nets scored 34 points in the third quarter compared with 31 from Los Angeles. They followed that with a 35-25 advantage in the fourth quarter. Those two periods demonstrate that Brooklyn did not simply stop competing after falling behind.
The problem was the size of the first-half deficit.
The Lakers entered halftime with a 29-point advantage. Even after Brooklyn won both second-half quarters, the Nets could not completely close the gap.
The final quarter therefore became more about reducing the margin than changing the eventual result.
First Quarter Created the Foundation
The 45-23 first quarter deserves special attention because it explains much of the final outcome.
Los Angeles scored 45 points while shooting efficiently throughout the game. The Lakers ultimately finished 46-for-85 from the field, which translates to 54%.
That efficiency allowed them to score consistently without needing a huge three-point shooting performance.
In fact, Los Angeles made only 7 of 31 attempts from three-point range. That is just 23%.
This is important because a team can win despite mediocre three-point shooting if it compensates through other areas. The Lakers did exactly that.
Their 54% overall field-goal percentage was substantially better than Brooklyn’s 48%. Los Angeles also made 26 free throws compared with only 9 for Brooklyn.
The combination of two-point efficiency and free-throw production helped offset the Lakers’ poor three-point conversion.
Brooklyn’s Second-Half Response
Brooklyn’s response after halftime is one of the more interesting elements of the box score.
The Nets scored 34 points in the third quarter and 35 in the fourth. That means Brooklyn produced 69 points in the second half.
Los Angeles scored 56 points over the same period.
This difference shows that the Nets found more offensive success after the break. However, basketball games are cumulative. A strong second half cannot automatically erase a major first-half deficit.
Brooklyn’s 109 total points were enough to produce respectable offensive numbers, but Los Angeles had already created too much separation.
For anyone studying this matchup through statistics, the lesson is straightforward: quarter-by-quarter performance matters. Looking only at the final score does not explain how the margin was created.
LeBron James Leads the Lakers
LeBron James was one of the central contributors to the Lakers’ victory.
He played 30 minutes and finished with:
- 25 points
- 10-for-16 field goals
- 0-for-3 three-pointers
- 5-for-7 free throws
- 3 rebounds
- 7 assists
- 1 turnover
- 3 steals
- +24 plus/minus
His 10-for-16 shooting translated to 62.5% from the field.
The most notable part of his performance was the combination of scoring and playmaking. Seven assists gave him a meaningful role in creating opportunities for teammates, while just one turnover showed strong ball security.
His three-point shooting was not productive, but the Lakers did not need him to rely heavily on perimeter attempts. He remained effective through overall shot-making and playmaking.
The +24 plus/minus also indicates that Los Angeles had a substantial advantage during his minutes.
Luka Doncic Provides Scoring and Creation
Luka Doncic finished with 24 points in 29 minutes.
His complete line was:
- 24 points
- 8-for-18 field goals
- 4-for-11 three-pointers
- 4-for-6 free throws
- 6 rebounds
- 5 assists
- 5 turnovers
- 1 steal
- +19
Doncic attempted 11 three-pointers, the most notable high-volume perimeter shooting contribution among the Lakers’ primary scorers.
He converted four of them.
His five turnovers are the main negative statistic in an otherwise productive offensive line. For a high-usage creator, turnovers are often part of the cost of handling the ball frequently, but they still matter because each turnover ends a possession without a shot attempt.
Despite that issue, his +19 plus/minus reflects the Lakers’ strong overall performance during his minutes.
Jake LaRavia Delivers Efficient Scoring
Jake LaRavia produced one of the game’s most efficient scoring performances.
He scored 18 points in 22 minutes while shooting 7-for-9 from the field.
That is 77.8% shooting.
He also went 1-for-2 from three-point range and added five rebounds and one steal.
LaRavia did not record an assist, but his role was primarily reflected through efficient scoring and supporting work on the glass.
His +10 plus/minus indicates that his minutes were productive for Los Angeles.
When examining a box score, performances like this can be overlooked if attention is focused only on the highest scorers. LaRavia’s 18 points on nine field-goal attempts were particularly valuable because he generated substantial production without requiring a large number of possessions.
Austin Reaves Adds Free-Throw Production
Austin Reaves scored 15 points in 21 minutes.
His line included:
- 3-for-9 shooting
- 1-for-5 from three
- 8-for-10 from the free-throw line
- 4 rebounds
- 1 assist
- 2 turnovers
- 2 steals
- +10
His 8-for-10 free-throw performance was especially important.
The Lakers as a team went 26-for-39 from the free-throw line. Reaves alone accounted for eight makes.
Although his field-goal shooting was not particularly efficient, his ability to reach and convert free throws added valuable points.
His two steals also contributed to Los Angeles’ defensive activity.
Deandre Ayton’s Interior Contribution
Deandre Ayton played 28 minutes and recorded:
- 7 points
- 3-for-5 field goals
- 8 rebounds
- 3 assists
- 1 turnover
- 1 steal
- +16
Ayton did not have a large scoring night, but his value was broader than his seven points.
Eight rebounds helped Los Angeles compete against a Brooklyn team that ultimately collected 48 total rebounds.
His three assists were also notable for a center.
The +16 plus/minus suggests that his minutes were associated with a strong team performance even though his individual scoring total was modest.
Supporting Lakers Performances
Several other Lakers contributed in different ways.
Jaxson Hayes scored nine points while going 3-for-3 from the field and 3-for-4 at the free-throw line. He added two assists and one steal in 15 minutes.
Jarred Vanderbilt scored six points, collected five rebounds and recorded three assists. His 2-for-3 shooting was efficient, and he finished at +4.
Marcus Smart played 18 minutes and scored six points. He shot 3-for-5 from the field and added three rebounds and one steal. His +30 was the highest plus/minus among the listed Lakers.
Rui Hachimura scored five points on 2-for-3 shooting, including 1-for-2 from three-point range.
Dalton Knecht scored four points in five minutes, while Bronny James also scored four points in five minutes.
Drew Timme contributed two points and two rebounds in six minutes.
Gabe Vincent did not score, going 0-for-3 from the field, but he recorded two steals.
Maxi Kleber played three minutes without registering a statistical contribution and finished at -5.
Day’Ron Sharpe Dominates the Glass
For Brooklyn, Day’Ron Sharpe produced arguably the most complete statistical performance.
He finished with:
- 19 points
- 9-for-12 field goals
- 1-for-1 free throws
- 14 rebounds
- 5 assists
- 1 turnover
- 3 steals
- +14
Sharpe shot 75% from the field.
His 14 rebounds were the highest total recorded by either team.
He also added five assists and three steals, giving him production across several categories.
The +14 plus/minus is particularly interesting because Brooklyn lost by 16 points overall. It shows that Sharpe’s individual minutes were productive even though the team’s overall performance was not enough to overcome the early deficit.
His 19 points were also generated efficiently. He made nine of his 12 field-goal attempts.
Michael Porter Jr. Produces a Double-Double
Michael Porter Jr. scored 21 points and grabbed 10 rebounds.
He played 32 minutes, the most among the listed Brooklyn players.
His shooting line was:
- 7-for-18 field goals
- 0-for-9 three-pointers
- 7-for-9 free throws
The biggest statistical contradiction in his performance was the difference between his overall scoring and his three-point shooting.
He made seven field goals but missed all nine three-point attempts.
That meant his scoring came through two-point field goals and free throws rather than perimeter shooting.
Porter Jr.’s 10 rebounds were valuable, particularly because Brooklyn won the overall rebounding battle.
However, he finished at -18, reflecting the team’s overall disadvantage during his minutes.
Ziaire Williams Provides Efficient Perimeter Scoring
Ziaire Williams scored 17 points in 24 minutes.
He went 7-for-11 from the field and 3-for-6 from three-point range.
That is 63.6% overall shooting and 50% from three.
His shooting efficiency stands out among Brooklyn’s perimeter players.
Williams also recorded two rebounds, three assists and one steal.
Unlike some of Brooklyn’s other contributors, his +2 plus/minus was positive despite the Nets losing the game.
His performance demonstrates why the final score should not be used as a substitute for individual analysis. Brooklyn had several players who produced efficient offensive numbers even in a losing effort.
Other Important Nets Performances
Nic Claxton scored 10 points in 22 minutes.
He shot 5-for-7 from the field and added five rebounds and two assists. His field-goal percentage was an efficient 71.4%.
Egor Demin scored 11 points and made three of eight three-point attempts. He also recorded two rebounds and two assists, but six turnovers significantly affected his statistical profile.
Nolan Traore scored seven points, grabbed five rebounds and recorded four assists in 25 minutes.
Danny Wolf scored seven points, collected four rebounds and added three assists and one steal.
Noah Clowney finished with six points and four rebounds.
Cam Thomas scored eight points in 23 minutes.
Ben Saraf scored three points.
Drake Powell played four minutes without scoring and recorded one rebound.
Team Shooting Explains Much of the Difference
The shooting statistics provide one of the clearest explanations for the result.
Los Angeles:
46-for-85, 54%
Brooklyn:
45-for-94, 48%
The Lakers made only one more field goal than Brooklyn, but they attempted nine fewer shots.
That is a major efficiency difference.
Brooklyn’s 94 field-goal attempts indicate that the Nets generated a high volume of shot opportunities. However, making 45 of those attempts resulted in a lower conversion rate.
Los Angeles made 46 shots from 85 attempts.
The Lakers therefore needed fewer attempts to produce nearly the same number of made field goals.
This is one of the most important statistics to understand when analyzing a box score. Raw shot totals do not tell the complete story. Efficiency matters.
Three-Point Shooting Was Not the Lakers’ Strength
Neither team shot particularly well from three.
The Lakers made 7 of 31 attempts, or 23%.
The Nets made 10 of 41, or 24%.
Brooklyn therefore made three more three-pointers than Los Angeles.
Ordinarily, that could be enough to create a meaningful advantage. But the difference was not large enough to compensate for the Lakers’ stronger overall field-goal percentage and free-throw production.
The game is a useful reminder that three-point volume and three-point success are only part of offensive efficiency.
A team can make more threes and still lose if it gives away too many possessions or fails to convert enough shots inside the arc.
Free Throws Favored Los Angeles
Free-throw production created another significant separation.
The Lakers attempted 39 free throws and made 26.
The Nets attempted only 14 and made nine.
That is a difference of 25 free-throw attempts.
Los Angeles therefore had substantially more opportunities to score without a field-goal attempt.
The Lakers converted those chances at 67%, while Brooklyn converted at 64%.
Neither team was exceptional at the line, but the volume difference mattered.
Reaves’ 8-for-10 performance and LeBron James’ 5-for-7 shooting were particularly useful for Los Angeles.
Turnovers Were a Major Difference
One of the clearest statistical advantages for Los Angeles came from turnovers.
The Lakers committed 12 turnovers.
The Nets committed 20.
That is an eight-turnover difference.
The Lakers also recorded 14 steals compared with seven for Brooklyn.
Those numbers suggest that Los Angeles was much more disruptive defensively.
Turnovers are important because they do not simply remove a possession. They can also prevent the opposing team from generating a shot and can create transition opportunities for the defense.
Brooklyn’s 20 turnovers therefore represented a significant lost-possession problem.
Egor Demin’s six turnovers were the highest individual total listed for either team. Luka Doncic had five for Los Angeles.
Rebounding Battle Went to Brooklyn
Interestingly, Brooklyn won the rebounding battle.
The Nets collected 48 rebounds compared with 41 for Los Angeles.
Brooklyn also had 16 offensive rebounds, while the Lakers had 10.
This is a clear area where the Nets had an advantage.
Offensive rebounds can create additional possessions, and Brooklyn’s 16 offensive boards show that the Nets repeatedly created second-chance opportunities.
However, the rebounding advantage did not translate into a victory.
That is another important analytical lesson from this game: winning one statistical category does not guarantee winning the game.
Brooklyn controlled the glass but gave away too many possessions through turnovers and did not shoot as efficiently overall.
Assists Show Brooklyn’s Ball Movement
The Nets recorded 28 assists compared with 25 for the Lakers.
That suggests Brooklyn’s offense generated slightly more assisted scoring opportunities.
Nolan Traore recorded four assists, while Sharpe had five. Ziaire Williams and Danny Wolf each added three.
For Los Angeles, LeBron James led the team with seven assists, while Luka Doncic added five.
The assist numbers were relatively close, so they do not explain the 16-point difference by themselves.
The more important distinction was what happened after possessions were created.
Los Angeles converted its opportunities at a higher overall field-goal rate and protected the ball better.
Defensive Activity Favored the Lakers
Los Angeles recorded 14 steals.
Brooklyn recorded seven.
That is twice as many steals for the Lakers.
The Lakers also committed fewer personal fouls, 13 compared with 21 for Brooklyn.
This combination is notable because it points to two different aspects of defensive control.
The Lakers generated more takeaways while committing fewer fouls.
Brooklyn’s 21 personal fouls also contributed to Los Angeles receiving 39 free-throw attempts.
Defensive impact therefore appears in several places on the box score rather than in steals alone.
Plus/Minus Provides Additional Context
The plus/minus statistics offer another way to understand the game.
Marcus Smart recorded the highest listed Lakers mark at +30.
LeBron James was +24.
Luka Doncic was +19.
Deandre Ayton was +16.
Jake LaRavia and Austin Reaves were both +10.
For Brooklyn, Day’Ron Sharpe was +14, while Ziaire Williams finished at +2 and Danny Wolf at +3.
Several Nets players had negative numbers, including Nic Claxton at -30 and Michael Porter Jr. at -18.
Plus/minus should not be treated as a complete measure of individual performance because it reflects what happens while a player is on the floor, including team-level factors.
Still, when viewed alongside shooting, turnovers and game flow, it provides useful context.
Why Brooklyn Could Not Complete the Comeback
The second half shows that Brooklyn had enough offensive production to make the final score respectable.
The Nets scored 69 second-half points.
The Lakers scored 56.
That means Brooklyn gained 13 points over the final two quarters.
But the Nets started the second half down 29.
To overcome such a deficit, the comeback would have required a much larger swing.
The first-quarter difference alone was 22 points.
The second-quarter difference added another seven.
Together, the Lakers had a 29-point halftime advantage.
Brooklyn’s second-half response reduced the margin, but it could not fully erase the first-half damage.
This is why quarter splits are essential when interpreting the result.
What the Box Score Says About the Lakers
The Lakers’ statistical profile can be summarized through five major points.
First, they shot efficiently overall.
Second, they created turnovers.
Third, they converted substantially more free throws.
Fourth, they received balanced scoring from multiple players.
Fifth, they established an enormous early advantage.
The Lakers did not dominate every category.
They lost the rebounding battle.
They made fewer three-pointers.
They recorded fewer assists.
But their combination of efficiency, ball security, defensive disruption and early scoring proved more important in this matchup.
What the Box Score Says About the Nets
Brooklyn’s numbers show a team that had several productive individual performances but struggled with possession efficiency.
The Nets had:
- More total rebounds
- More offensive rebounds
- More assists
- More made three-pointers
Those are meaningful positives.
But they also had:
- Eight more turnovers
- Seven fewer steals
- More personal fouls
- A lower overall field-goal percentage
- A much smaller free-throw total
The 20 turnovers stand out because they counteracted much of the Nets’ success on the glass.
Brooklyn created extra possessions through offensive rebounding but lost possessions through turnovers.
That contrast is central to understanding the game.
Key Statistical Takeaways
Several numbers deserve to be remembered from this matchup.
1. Lakers scored 45 in the first quarter
The opening period created the foundation for the victory.
2. Lakers shot 54% from the field
Los Angeles made 46 of 85 attempts.
3. Nets had 20 turnovers
That was eight more than the Lakers.
4. Brooklyn won the rebounding battle
The Nets collected 48 rebounds compared with 41 for Los Angeles.
5. Day’Ron Sharpe recorded 19 points and 14 rebounds
His double-double was one of Brooklyn’s strongest individual performances.
6. LeBron James produced 25 points and 7 assists
He combined scoring efficiency with playmaking and defensive activity.
7. Jake LaRavia shot 7-for-9
His 18 points came on highly efficient shooting.
8. Ziaire Williams shot 7-for-11
He also made three of six attempts from three-point range.
9. The Lakers made 26 free throws
Brooklyn made only nine.
10. Los Angeles recorded 14 steals
The Nets had seven.
Complete Lakers Player Statistics
| Player | MIN | PTS | FG | 3PT | FT | REB | AST | TO | STL | +/- |
| LeBron James | 30 | 25 | 10-16 | 0-3 | 5-7 | 3 | 7 | 1 | 3 | +24 |
| Jake LaRavia | 22 | 18 | 7-9 | 1-2 | 3-6 | 5 | 0 | 1 | 1 | +10 |
| Deandre Ayton | 28 | 7 | 3-5 | 0-0 | 1-2 | 8 | 3 | 1 | 1 | +16 |
| Marcus Smart | 18 | 6 | 3-5 | 0-2 | 0-0 | 3 | 1 | 1 | 1 | +30 |
| Luka Doncic | 29 | 24 | 8-18 | 4-11 | 4-6 | 6 | 5 | 5 | 1 | +19 |
| Maxi Kleber | 3 | 0 | 0-0 | 0-0 | 0-0 | 0 | 0 | 0 | 0 | -5 |
| Rui Hachimura | 26 | 5 | 2-3 | 1-2 | 0-0 | 3 | 0 | 1 | 1 | -1 |
| Jarred Vanderbilt | 19 | 6 | 2-3 | 0-1 | 2-4 | 5 | 3 | 0 | 0 | +4 |
| Drew Timme | 6 | 2 | 1-3 | 0-1 | 0-0 | 2 | 0 | 0 | 0 | -8 |
| Dalton Knecht | 5 | 4 | 2-5 | 0-2 | 0-0 | 0 | 1 | 0 | 0 | -9 |
| Jaxson Hayes | 15 | 9 | 3-3 | 0-0 | 3-4 | 1 | 2 | 0 | 1 | +8 |
| Gabe Vincent | 16 | 0 | 0-3 | 0-2 | 0-0 | 1 | 1 | 0 | 2 | -9 |
| Austin Reaves | 21 | 15 | 3-9 | 1-5 | 8-10 | 4 | 1 | 2 | 2 | +10 |
| Bronny James | 5 | 4 | 2-3 | 0-0 | 0-0 | 0 | 1 | 0 | 1 | -9 |
Complete Nets Player Statistics
| Player | MIN | PTS | FG | 3PT | FT | REB | AST | TO | STL | +/- |
| Michael Porter Jr. | 32 | 21 | 7-18 | 0-9 | 7-9 | 10 | 3 | 3 | 1 | -18 |
| Noah Clowney | 21 | 6 | 3-7 | 0-4 | 0-0 | 4 | 2 | 2 | 0 | -17 |
| Nic Claxton | 22 | 10 | 5-7 | 0-0 | 0-2 | 5 | 2 | 0 | 0 | -30 |
| Egor Demin | 27 | 11 | 4-11 | 3-8 | 0-0 | 2 | 2 | 6 | 1 | -11 |
| Nolan Traore | 25 | 7 | 3-9 | 1-3 | 0-0 | 5 | 4 | 2 | 0 | -4 |
| Ziaire Williams | 24 | 17 | 7-11 | 3-6 | 0-0 | 2 | 3 | 1 | 1 | +2 |
| Danny Wolf | 19 | 7 | 3-8 | 1-5 | 0-0 | 4 | 3 | 1 | 1 | +3 |
| Day’Ron Sharpe | 26 | 19 | 9-12 | 0-0 | 1-1 | 14 | 5 | 1 | 3 | +14 |
| Cam Thomas | 23 | 8 | 3-7 | 1-4 | 1-2 | 0 | 2 | 2 | 0 | -11 |
| Drake Powell | 4 | 0 | 0-0 | 0-0 | 0-0 | 1 | 0 | 1 | 0 | -6 |
| Ben Saraf | 17 | 3 | 1-4 | 1-2 | 0-0 | 1 | 2 | 1 | 0 | -2 |
Jalen Wilson, Terance Mann and Tyrese Martin were listed as DNP due to the coach’s decision.
Lakers vs Nets Season Series Context
The provided game data lists Los Angeles as leading the season series 1-0 after the February 4 meeting.
The listed previous and next matchup information records the February 4 result as Lakers 125-109 Nets and another matchup as Nets 99-116 Lakers on March 28.
The February game therefore represented one part of the season series rather than an isolated meeting.
For statistical analysis, however, the February 4 box score stands on its own because it provides enough information to evaluate shooting, rebounding, turnovers, assists and individual production.
Frequently Asked Questions
What was the final score of Lakers vs Nets on February 4, 2026?
The Los Angeles Lakers defeated the Brooklyn Nets 125-109 at Barclays Center in Brooklyn.
Who led the Lakers in scoring?
LeBron James led the Lakers with 25 points. Luka Doncic scored 24, while Jake LaRavia added 18.
Who led the Nets in scoring?
Michael Porter Jr. led Brooklyn with 21 points. Day’Ron Sharpe scored 19 and Ziaire Williams added 17.
Who had the most rebounds in the game?
Day’Ron Sharpe led all players with 14 rebounds. Michael Porter Jr. was next among the listed players with 10.
Which team had more turnovers?
The Brooklyn Nets committed 20 turnovers compared with 12 for the Lakers.
Which team shot better from the field?
The Lakers shot 54% from the field, making 46 of 85 attempts. Brooklyn shot 48%, making 45 of 94.
Conclusion
The lakers vs brooklyn nets match player stats from February 4, 2026, show that Los Angeles built its 125-109 victory through efficiency, defensive pressure and an exceptional start.
The 45-point first quarter was the defining stretch. By halftime, the Lakers had created a 29-point advantage, forcing Brooklyn into a difficult second-half comeback situation.
LeBron James combined 25 points with seven assists and three steals, while Luka Doncic contributed 24 points, six rebounds and five assists. Jake LaRavia added 18 points on 7-for-9 shooting, and Austin Reaves provided 15 points with eight made free throws.
Brooklyn had several strong individual performances. Day’Ron Sharpe produced 19 points, 14 rebounds, five assists and three steals. Michael Porter Jr. recorded 21 points and 10 rebounds, while Ziaire Williams scored 17 points on 7-for-11 shooting.
The Nets also won the rebounding battle and recorded more assists and more made three-pointers. Those advantages were not enough because Los Angeles shot better overall, committed eight fewer turnovers, recorded twice as many steals and generated far more free-throw attempts.
The biggest lesson from this box score is that no single category explains the result. The Lakers did not dominate the boards or the three-point line. Instead, the victory came from the combined effect of efficient field-goal shooting, possession control, defensive activity and a huge opening quarter.
For readers studying player performance, this matchup is a useful example of why a complete box-score analysis should go beyond points. Efficiency, turnovers, rebounds, assists, steals, free throws and plus/minus together provide a much clearer picture of how a game developed.