Portland Trail Blazers vs Celtics Match Player Stats
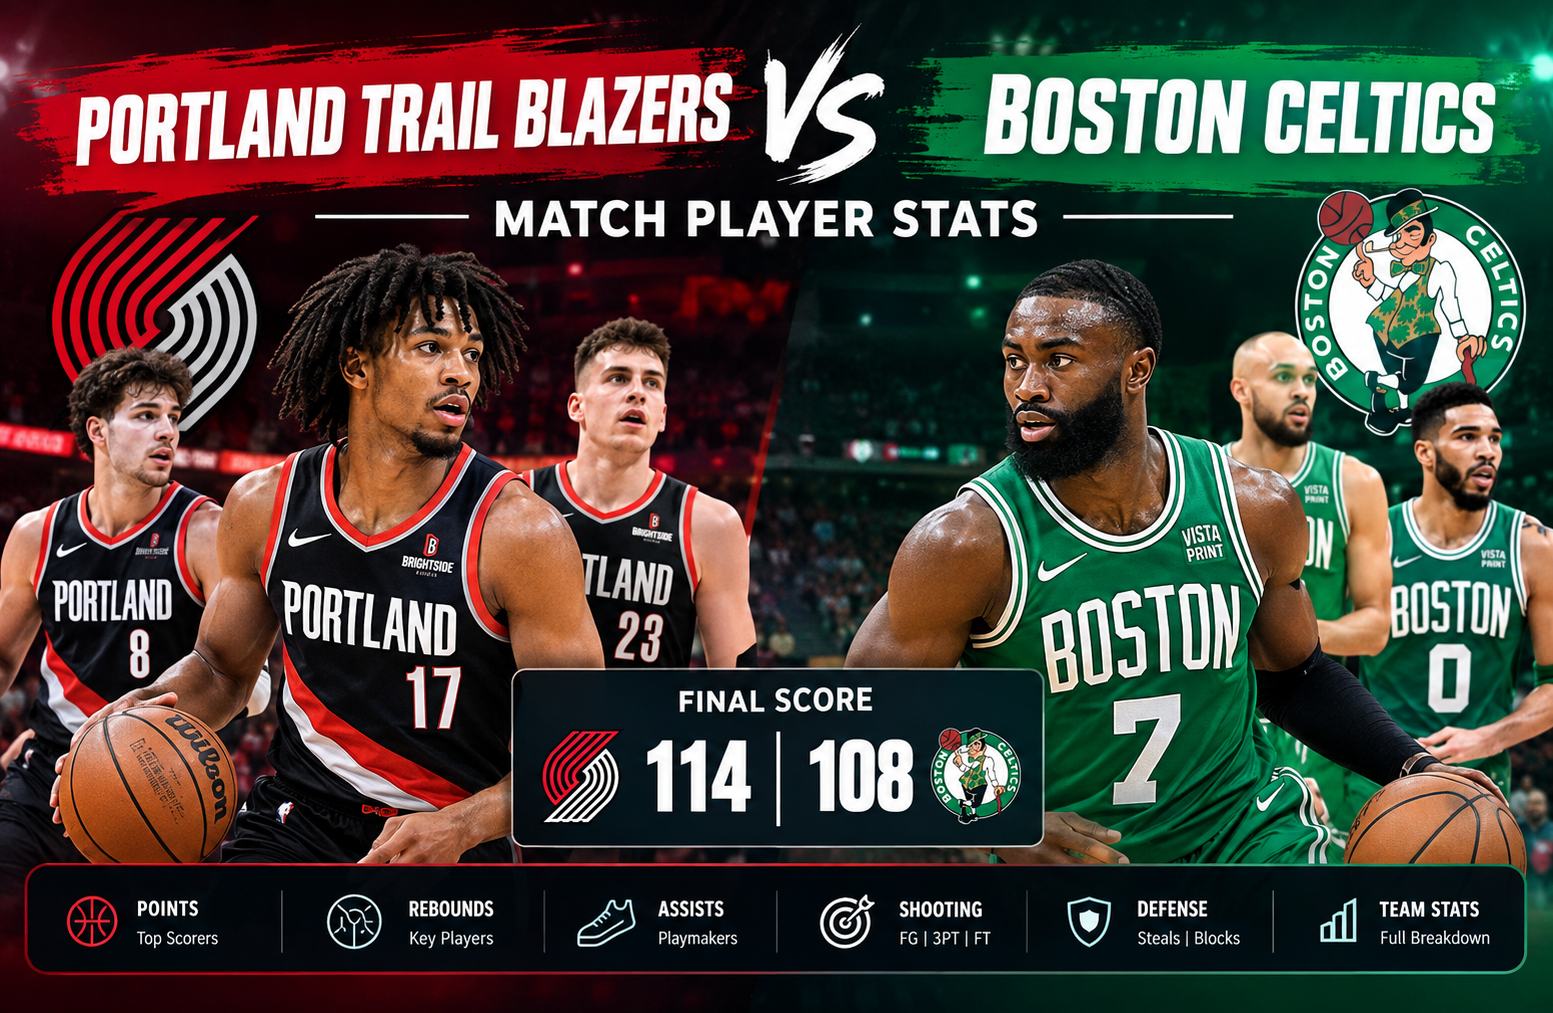
The portland trail blazers vs celtics match player stats from Portland’s 114-108 win over Boston show a game that was decided by much more than one scoring line. Shaedon Sharpe led Portland with 26 points, Deni Avdija delivered 24 points and 10 assists, and Donovan Clingan controlled the glass with 18 rebounds and 18 points. For Boston, Jaylen Brown produced a game-high 37 points, but Portland’s broader production, rebounding advantage, and second-half response were enough to secure the victory. The official NBA record lists this game as December 28, 2025, at Moda Center, although the supplied data labels it December 29. Official NBA game record and matchup history
Portland Trail Blazers vs Celtics Match Player Stats
The final score was Portland Trail Blazers 114, Boston Celtics 108.
At first glance, the six-point margin does not look large. The box score tells a more interesting story. Portland shot better from the field, made more three-pointers, won the rebounding battle by nine, and created 26 assists compared with Boston’s 19.
Boston had the game’s highest individual scorer in Jaylen Brown, who finished with 37 points. However, Portland received major contributions from several players rather than relying on one scorer.
Here are the central game numbers:
| Category | Boston Celtics | Portland Trail Blazers |
| Final Score | 108 | 114 |
| Field Goals | 40-91 | 42-89 |
| Field Goal % | 44% | 47% |
| 3-Pointers | 13-44 | 18-51 |
| 3PT % | 30% | 35% |
| Free Throws | 15-19 | 12-21 |
| Rebounds | 39 | 48 |
| Assists | 19 | 26 |
| Turnovers | 19 | 20 |
| Steals | 13 | 7 |
| Blocks | 5 | 2 |
| Offensive Rebounds | 12 | 16 |
| Defensive Rebounds | 27 | 32 |
| Personal Fouls | 23 | 19 |
The numbers point toward a clear pattern. Boston generated defensive activity with 13 steals and five blocks, but Portland created more possessions through offensive rebounding and converted those opportunities efficiently enough to overcome Boston’s defensive pressure.
NBA’s own game recap also highlighted Sharpe’s 26 points, Clingan’s 18-point, 18-rebound double-double, and Avdija’s 24-point, 10-assist performance. (NBA.com)
Game Overview: How Portland Won 114-108
Portland did not win because Boston suddenly stopped scoring. The Celtics actually produced 63 points through the first two quarters and entered halftime with a 63-55 lead.
That makes Portland’s eventual comeback particularly important.
The quarter-by-quarter scoring was:
| Quarter | Boston | Portland |
| 1st | 30 | 31 |
| 2nd | 33 | 24 |
| 3rd | 22 | 31 |
| 4th | 23 | 28 |
| Total | 108 | 114 |
The turning point was the third quarter.
Boston had scored 33 points in the second period, but Portland answered with 31 points in the third while holding Boston to only 22. That nine-point swing essentially erased the Celtics’ halftime advantage.
Portland then outscored Boston 28-23 in the fourth quarter.
This is an important distinction when analyzing a six-point game. The Trail Blazers did not simply survive a close contest from start to finish. They changed the direction of the game after halftime.
Portland’s Second-Half Response
The most useful takeaway from the scoring sequence is Portland’s ability to increase its offensive pressure while Boston’s scoring slowed.
Boston’s first-half total:
63 points
Boston’s second-half total:
45 points
Portland’s first-half total:
55 points
Portland’s second-half total:
59 points
That 14-point difference in second-half scoring between the teams explains much of the comeback.
Portland’s offense became more balanced after halftime. Sharpe continued to attack, Avdija remained involved as a passer and scorer, and Clingan’s interior presence gave the Blazers another reliable source of offense.
Shaedon Sharpe’s 26-Point Performance
Shaedon Sharpe was Portland’s leading scorer with 26 points.
He shot 10-of-20 from the field, giving him a 50% field-goal percentage.
That efficiency matters because Portland did not need Sharpe to take an extreme number of shots to become its top scorer.
His performance provided scoring pressure on the perimeter while the team received additional production from Avdija and Clingan.
Sharpe’s 26 points were also part of a combined 50-point output from Sharpe and Avdija. NBA.com specifically identified the duo’s 50 points as a major reason Portland was able to overcome Boston. (NBA.com)
Why Sharpe’s Scoring Mattered
Boston’s defensive attention had to account for multiple Portland threats.
If Boston concentrated heavily on Sharpe, Avdija could create opportunities as a scorer and passer. If defenders collapsed toward the paint, Portland had three-point shooting available around the perimeter.
That type of offensive balance is often more difficult to defend than a system built around one high-volume scorer.
Sharpe’s contribution therefore should not be evaluated only through his 26 points. His scoring helped Portland maintain an offensive structure in which Boston could not comfortably dedicate every possession to stopping a single player.
Deni Avdija’s All-Around Impact
Deni Avdija produced one of the most complete statistical performances of the game.
He finished with:
- 24 points
- 7 rebounds
- 10 assists
- 2 steals
- 1 block
- +8 plus/minus
The 10 assists were particularly important.
Avdija was Portland’s leading assist provider, and his passing helped connect the team’s scoring options. His contribution was not limited to creating shots for himself.
He was one assist short of a triple-double.
That makes his performance especially valuable when studying the game beyond the traditional scoring column.
Avdija as Portland’s Connector
A useful way to understand Avdija’s performance is to view him as the connector between Portland’s perimeter scoring and interior play.
Sharpe could attack as a scorer.
Clingan could finish inside and dominate the glass.
Avdija helped connect those pieces.
His 10 assists also explain why Portland finished with 26 team assists, seven more than Boston.
That difference suggests Portland’s offense generated more shared creation even though the Celtics had the game’s highest individual scorer.
Donovan Clingan Controls the Glass
If one statistic best explains Portland’s physical advantage, it is probably rebounding.
Portland collected 48 rebounds compared with Boston’s 39.
The biggest individual contributor was Donovan Clingan.
He recorded:
- 18 points
- 18 rebounds
- 8-of-10 shooting
That was a dominant double-double.
Clingan’s 18 rebounds were especially significant because Portland also collected 16 offensive rebounds as a team.
Offensive rebounding gives a team additional possessions without requiring a forced turnover from the opponent.
That can change the mathematics of a game.
Boston shot 44% from the field, while Portland shot 47%. When those shooting percentages are relatively close, extra possessions can become a decisive factor.
Clingan’s Efficiency
Clingan’s 8-of-10 shooting means he converted 80% of his field-goal attempts.
That efficiency is difficult to ignore.
He combined efficient finishing with elite rebounding volume, giving Portland production in two areas that directly affect possession value.
NBA.com noted that Clingan became the second Portland player after Bill Walton to record at least three career games with 15 points and 15 rebounds before turning 22. (NBA.com)
For this particular matchup, however, the immediate value was simpler: Clingan kept Portland competitive on the glass and finished efficiently around the basket.
Jaylen Brown Leads Boston With 37 Points
Jaylen Brown was the game’s leading scorer.
He finished with:
37 points on 14-of-23 shooting
That is approximately 61% shooting from the field.
Brown was not simply a high-volume scorer who needed a large number of attempts to reach 37 points. He converted at a strong rate.
NBA.com reported that Brown entered the game on a remarkable scoring run and extended his streak of 30-point games to nine. The game also matched Larry Bird’s franchise record for consecutive 30-point performances. (NBA.com)
Brown’s Scoring Was Not Enough
The unusual part of Boston’s offensive performance was how much the scoring load concentrated around Brown.
Brown scored 37.
No other Boston player exceeded 13 points.
That is a major difference in offensive distribution.
Portland had three players combining for substantial production:
- Shaedon Sharpe: 26
- Deni Avdija: 24
- Donovan Clingan: 18
That trio accounted for 68 points.
Boston, meanwhile, received 37 of its 108 points from Brown alone.
This does not mean Brown played poorly. Quite the opposite. His scoring was one of the strongest individual performances in the game.
The issue was that Boston did not receive enough comparable scoring support to match Portland’s multi-player production.
Neemias Queta’s Rebounding Contribution
Neemias Queta led Boston with 8 rebounds.
He also finished with a team-best plus/minus tie at +2, alongside Payton Pritchard.
Queta’s eight rebounds were useful, but Portland’s 48 total rebounds show that Boston needed more control of the glass.
The Celtics collected 12 offensive rebounds, which was a respectable number. Portland, however, produced 16.
That four-rebound difference on the offensive glass contributed to Portland’s overall nine-rebound advantage.
Derrick White’s Defensive Activity
Derrick White produced one of Boston’s most notable defensive statistical lines.
He recorded:
- 5 assists
- 5 steals
The five steals were the most for either team.
Boston finished with 13 steals, nearly twice Portland’s seven.
This is one reason the final result should not be interpreted as Portland simply dominating every aspect of the game.
Boston created turnovers and defensive plays.
The Celtics also finished with five blocks compared with Portland’s two.
Yet Portland’s offensive execution and rebounding compensated for Boston’s defensive activity.
Payton Pritchard’s Role
Payton Pritchard finished with 5 assists and tied Queta for Boston’s best plus/minus at +2.
His five assists matched White for the team lead.
That gives Boston two important playmaking sources behind Brown’s scoring.
However, Boston finished with only 19 assists overall.
Portland had 26.
That seven-assist gap provides useful context when assessing the offensive balance of the two teams.
Team Shooting Comparison
Shooting efficiency was another important part of the game.
Portland:
42-of-89, 47%
Boston:
40-of-91, 44%
Portland made two more field goals despite taking two fewer attempts.
That difference is small in raw volume but meaningful in efficiency.
The three-point numbers also favored Portland:
Portland: 18-of-51, 35%
Boston: 13-of-44, 30%
Portland made five more three-pointers.
Those five additional made threes represented 15 extra points from beyond the arc.
Boston’s free-throw shooting was much better:
Boston: 15-of-19, 79%
Portland: 12-of-21, 57%
So Boston had an advantage at the free-throw line, but Portland’s field-goal and three-point production outweighed it.
The Three-Point Battle
Three-point shooting deserves special attention because Portland attempted seven more threes than Boston.
Portland attempted 51.
Boston attempted 44.
More importantly, Portland made 18 compared with Boston’s 13.
That five-made-three advantage is substantial in a six-point game.
It means Portland gained a 15-point advantage from made three-pointers before considering the difference in other scoring areas.
Boston’s 30% three-point shooting limited the value of its perimeter volume.
Portland’s 35% mark was not spectacular, but it was good enough to produce a clear advantage.
Rebounding Was a Major Separator
The rebounding numbers tell another important story.
Portland:
48 rebounds
Boston:
39 rebounds
That is a nine-rebound advantage.
Portland also led offensive rebounding:
16 to 12
And defensive rebounding:
32 to 27
This was not a narrow advantage in one particular rebounding category. Portland led in both.
The practical effect was extra possession opportunities and fewer second chances for Boston.
Clingan’s 18 rebounds were central to that advantage.
Assists Reveal the Difference in Offensive Distribution
Portland recorded 26 assists.
Boston recorded 19.
That seven-assist difference is significant.
Portland’s scoring was distributed among multiple players, while Boston’s offense leaned heavily on Brown.
Avdija’s 10 assists were particularly important because he accounted for a large share of Portland’s creation.
White and Pritchard each had five assists for Boston.
That gave Boston useful secondary playmaking, but the Celtics still finished seven assists behind Portland.
Turnovers Nearly Offset Portland’s Advantages
Portland was not perfect with the basketball.
The Trail Blazers committed 20 turnovers.
Boston committed 19.
So Boston actually won the turnover battle by one.
Boston also had a significant advantage in steals:
13 to 7
This shows why the game remained competitive.
Portland’s victory was not created by flawless ball security. The Blazers gave Boston plenty of defensive opportunities.
Instead, Portland compensated through shooting, rebounding, assists, and offensive balance.
Portland’s Starting Lineup
The supplied matchup data lists Portland’s starters as:
- Toumani Camara
- Kris Murray
- Deni Avdija
- Donovan Clingan
- Shaedon Sharpe
This group combined different roles.
Sharpe supplied scoring.
Avdija provided scoring and playmaking.
Clingan offered interior finishing and rebounding.
Camara and Murray provided supporting two-way responsibilities.
The statistical distribution demonstrates why Portland could win despite Boston having the game’s leading scorer.
Boston’s Starting Lineup
The supplied data lists Boston’s starters as:
- Neemias Queta
- Derrick White
- Jaylen Brown
- Payton Pritchard
- Jordan Walsh
Boston’s lineup had strong defensive activity.
White recorded five steals.
The team produced 13 steals overall and five blocks.
But the offensive distribution was more concentrated than Portland’s.
Brown scored 37, while the other Boston players collectively struggled to match Portland’s secondary scoring.
Quarter-by-Quarter Analysis
First Quarter
Portland opened with 31 points compared with Boston’s 30.
That gave the Trail Blazers a one-point advantage.
It was an efficient opening from both sides, and neither team established meaningful separation.
Second Quarter
Boston changed the momentum.
The Celtics scored 33 points while holding Portland to 24.
That nine-point quarter advantage gave Boston an eight-point halftime lead.
Brown’s scoring was particularly important during this stretch.
NBA.com reported that Brown had 27 points by halftime and was the only Celtic in double figures at that point. (NBA.com)
Third Quarter
This was the critical response from Portland.
The Trail Blazers scored 31.
Boston scored 22.
Portland therefore gained nine points in the quarter, completely removing Boston’s halftime advantage.
Fourth Quarter
Portland continued the pressure.
The Blazers scored 28.
Boston scored 23.
That five-point edge secured the six-point final margin.
The second half therefore tells the story more clearly than the halftime score.
Portland scored 59 after halftime.
Boston scored 45.
What the Player Stats Say About the Game
The portland trail blazers vs celtics match player stats show two very different offensive models.
Boston had the game’s most dominant individual scoring performance.
Portland had the more balanced overall attack.
That contrast is visible in several areas.
Boston’s Statistical Strengths
Boston led or matched Portland in:
- Individual scoring through Brown
- Steals
- Blocks
- Free-throw percentage
- Turnover margin
Portland’s Statistical Strengths
Portland led in:
- Final score
- Field-goal percentage
- Made three-pointers
- Three-point percentage
- Total rebounds
- Offensive rebounds
- Defensive rebounds
- Assists
- Second-half scoring
The result therefore was not a simple case of one team dominating every statistical category.
It was a game in which Portland won several possession and efficiency categories that collectively outweighed Boston’s defensive activity and Brown’s individual scoring.
A Closer Look at Plus/Minus
Plus/minus can be useful, but it needs context.
Portland’s best plus/minus was:
Deni Avdija: +8
Boston’s best listed plus/minus was:
Neemias Queta: +2
Payton Pritchard: +2
Avdija’s +8 was the strongest figure among the listed leaders.
His combination of scoring, passing, rebounding, and defensive contributions helps explain why his impact extended beyond the scoring column.
Still, plus/minus should not be treated as an isolated measure of individual performance.
It reflects what happened while a player was on the floor and is affected by teammates, opponents, lineups, and game context.
The Most Important Statistical Matchups
Shaedon Sharpe vs Boston’s Perimeter Defense
Sharpe’s 26 points on 50% shooting indicate that Portland found enough opportunities for one of its primary scorers.
Deni Avdija vs Boston’s Team Defense
Avdija’s 24 points and 10 assists demonstrate that Boston could not simply focus on his scoring.
He created for teammates as well.
Donovan Clingan vs Boston’s Frontcourt
Clingan’s 18 rebounds were perhaps the clearest physical advantage of the game.
His 18 points on 8-of-10 shooting added an efficient offensive dimension.
Jaylen Brown vs Portland’s Defensive Scheme
Brown scored 37 on 14-of-23 shooting.
Portland did not completely shut him down.
Instead, the Trail Blazers limited the supporting offensive output around him and won through team-level production.
What Went Wrong for Boston?
The biggest concern in the box score is not Brown’s performance.
It is the lack of comparable scoring from the rest of the lineup.
A 37-point performance normally gives a team a strong foundation.
But when the opposing team receives 68 combined points from three players, one elite scorer may not be enough.
Boston also shot only 30% from three-point range.
That made it harder to keep pace once Portland improved its offense in the second half.
The Celtics did create turnovers, but their 19 turnovers of their own reduced some of the value generated by their defensive pressure.
What Worked for Portland?
Portland’s biggest advantage was balance.
The team had:
- A 26-point scorer
- A 24-point scorer
- An 18-point interior scorer
- A 10-assist playmaker
- An 18-rebound center
That distribution gave Boston several problems to solve.
The Trail Blazers also shot 47% from the field and 35% from three.
They won the rebounding battle by nine.
They finished seven assists ahead of Boston.
Those numbers explain the final result more effectively than any single player statistic.
Why the Six-Point Margin Can Be Misleading
A six-point final margin can suggest an evenly matched game.
The statistical details reveal more movement.
Boston led by eight at halftime.
Portland then scored 59 second-half points while Boston scored 45.
That is a 14-point second-half scoring advantage.
Portland also finished with nine more rebounds and seven more assists.
So although the final difference was only six points, Portland’s second-half control was meaningful.
Boston’s defense kept the game within reach, but Portland’s offensive balance and possession advantages ultimately carried the game.
Portland Trail Blazers vs Celtics Match Player Stats: Key Takeaways
The portland trail blazers vs celtics match player stats provide several useful lessons for anyone studying this matchup.
1. Brown was the game’s leading scorer
Jaylen Brown scored 37 points on 14-of-23 shooting.
2. Portland had multiple major contributors
Sharpe scored 26, Avdija scored 24, and Clingan scored 18.
3. Clingan dominated rebounding
His 18 rebounds were the game’s standout rebounding figure.
4. Avdija was Portland’s primary creator
His 10 assists were the highest total on either team.
5. Portland shot more effectively
The Trail Blazers shot 47% compared with Boston’s 44%.
6. Portland won the three-point battle
Portland made 18 threes compared with Boston’s 13.
7. Portland won the glass
The rebounding advantage was 48-39.
8. Boston generated more defensive plays
The Celtics recorded 13 steals and five blocks.
9. Boston’s offense was heavily concentrated
Brown’s 37 points represented a large share of the team’s 108 points.
10. Portland’s second half changed the result
The Trail Blazers outscored Boston 59-45 after halftime.
Season-Series Context
The supplied data identifies this as Portland’s first win over Boston in the listed season series.
The official NBA matchup history also records Portland’s 114-108 victory before the teams met again in Boston in January 2026. (NBA.com)
That later meeting is useful context when reviewing the matchup history, but it should not be mixed into the statistics of this particular game.
For readers analyzing only this contest, the relevant result is Portland 114, Boston 108.
What Readers Should Look For in a Box Score Like This
A useful player-stat analysis should go beyond identifying the highest scorer.
When reviewing an NBA matchup, check these areas in order:
- Scoring distribution
- Shooting efficiency
- Three-point volume and accuracy
- Rebounding
- Offensive rebounds
- Assists
- Turnovers
- Free throws
- Steals and blocks
- Plus/minus with lineup context
This approach helps explain why a team won instead of merely describing who scored the most points.
For this game, following that process leads to a straightforward conclusion: Boston had the strongest individual scorer, while Portland produced the broader statistical profile.
Frequently Asked Questions
Who led the Portland Trail Blazers in scoring against the Celtics?
Shaedon Sharpe led Portland with 26 points. He shot 10-of-20 from the field.
Who scored the most points in the game?
Jaylen Brown was the game’s leading scorer with 37 points for Boston, shooting 14-of-23 from the field.
How many rebounds did Donovan Clingan have?
Donovan Clingan recorded 18 rebounds along with 18 points. He shot 8-of-10 from the field.
How many assists did Deni Avdija have?
Deni Avdija recorded 10 assists, which was the highest assist total for either team. He also scored 24 points and grabbed seven rebounds.
What was the final score between Portland and Boston?
The Portland Trail Blazers defeated the Boston Celtics 114-108.
Which team had more rebounds?
Portland had 48 rebounds, while Boston had 39.
Conclusion
The portland trail blazers vs celtics match player stats show a matchup defined by contrasting styles of production.
Jaylen Brown delivered the game’s biggest scoring performance with 37 points, but Portland received a more balanced contribution from its leading players. Shaedon Sharpe scored 26, Deni Avdija posted 24 points and 10 assists, and Donovan Clingan added 18 points and 18 rebounds.
The team statistics reinforce that difference.
Portland shot 47% from the field, made 18 three-pointers, collected 48 rebounds, and recorded 26 assists. Boston shot 44%, made 13 threes, collected 39 rebounds, and finished with 19 assists.
The quarter-by-quarter numbers are equally important. Boston led 63-55 at halftime, but Portland responded by outscoring the Celtics 31-22 in the third quarter and 28-23 in the fourth.
For anyone reviewing this game through the box score, the clearest takeaway is that individual scoring and team impact were not the same thing. Brown had the highest point total, while Portland’s combination of scoring balance, rebounding, playmaking, and second-half execution produced the 114-108 result.