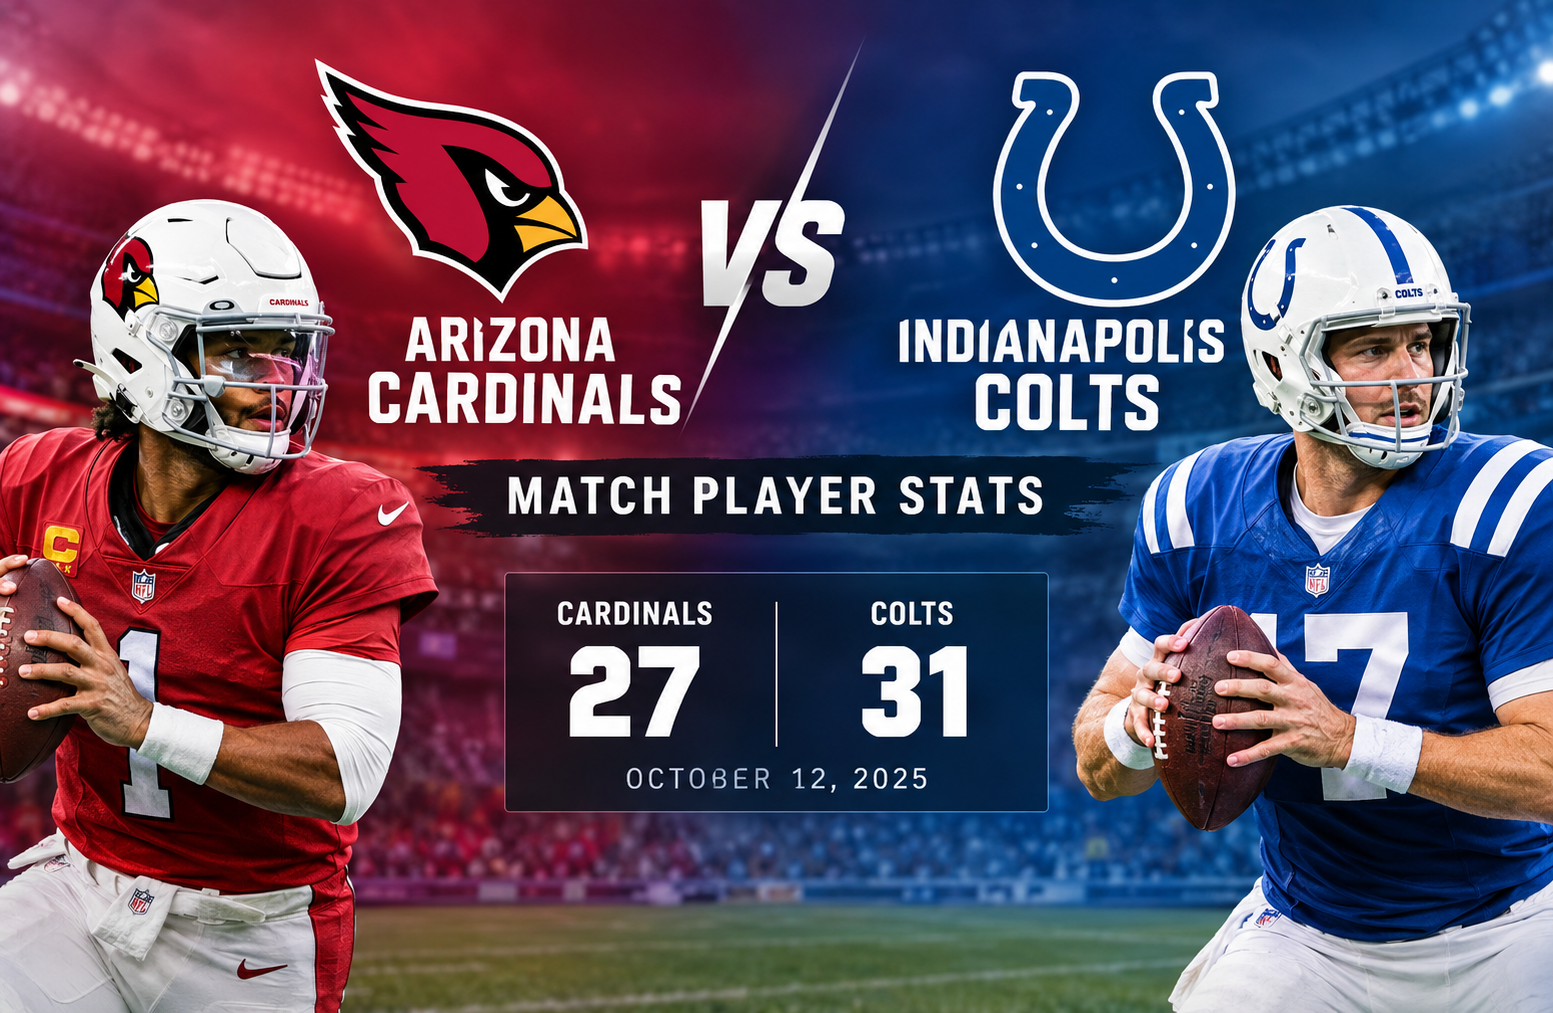
Arizona Cardinals vs Colts Match Player Stats
Arizona cardinals vs colts match player stats tell a more detailed story than the final 31-27 score alone. On October 12, 2025, the Indianapolis Colts defeated the Arizona Cardinals at Lucas Oil Stadium in a game where Arizona produced 400 total yards, Indianapolis produced 355, and both teams finished with 25 first downs. The difference came largely from how Indianapolis converted its opportunities, especially in the red zone and on the ground. (NFL)
This game is particularly useful to study because the Cardinals actually finished with more total offense and more passing production, yet the Colts won. Jacoby Brissett threw for 320 gross yards and two touchdowns for Arizona, while Daniel Jones threw for 212 gross yards and two touchdowns for Indianapolis. Jonathan Taylor added 123 rushing yards and the decisive touchdown for the Colts, while Trey McBride led Arizona’s receiving group with eight catches for 72 yards and a touchdown. (ESPN)
The final score was Indianapolis Colts 31, Arizona Cardinals 27. Arizona entered the game at 2-4, while Indianapolis improved to 5-1. (NFL)
Game Overview
The matchup took place during Week 6 of the 2025 NFL regular season at Lucas Oil Stadium in Indianapolis. The Cardinals scored 7 points in the first quarter, 3 in the second, 14 in the third and 3 in the fourth. The Colts followed with 7, 7, 3 and 14 points across the four quarters. (NFL)
| Category | Arizona Cardinals | Indianapolis Colts |
| Final score | 27 | 31 |
| Record after game | 2-4 | 5-1 |
| Total net yards | 400 | 355 |
| First downs | 25 | 25 |
| Rushing yards | 88 | 150 |
| Passing gross yards | 320 | 212 |
| Passing net yards | 312 | 205 |
| Total plays | 70 | 58 |
| Yards per play | 5.7 | 6.1 |
| Third down | 9/14 | 4/8 |
| Red zone | 3/6 | 4/4 |
| Turnovers | 1 | 1 |
| Time of possession | 32:05 | 27:55 |
| Sacks | 2 | 1 |
The first important lesson from these numbers is that yardage did not determine the winner.
Arizona ran 70 offensive plays compared with 58 for Indianapolis and held the ball for more than 32 minutes. The Cardinals also converted 9 of 14 third downs, compared with 4 of 8 for the Colts. Yet Indianapolis scored on all four of its red-zone trips, while Arizona scored touchdowns or field goals on only three of six red-zone opportunities. (ESPN)
That efficiency gap is one of the central reasons the final score went Indianapolis’ way.
arizona cardinals vs colts match player stats
The individual numbers provide a clearer explanation of how the game developed.
Arizona Cardinals Passing Stats
Jacoby Brissett was Arizona’s starting quarterback and produced one of his more productive passing performances of the season.
| Player | Comp/Att | Gross Yards | TD | INT | QBR | Rating |
| Jacoby Brissett | 27/44 | 320 | 2 | 1 | 61.3 | 89.2 |
Brissett completed 27 of 44 attempts, giving him a completion rate of 61.4%. He averaged 7.3 yards per completed pass attempt and finished with two touchdowns against one interception. His official passer rating was 89.2. (ESPN)
The Cardinals also had to operate without Kyler Murray, who was inactive for the game after dealing with a foot injury. The NFL reported before kickoff that Brissett was expected to start, and Arizona officially listed Murray as inactive. (NFL)
That context matters when evaluating Brissett’s performance. He was not simply filling in for a few drives. He handled the full quarterback workload and produced 320 gross passing yards against a Colts defense that ultimately forced a late turnover on downs.
One statistical detail is worth explaining because box scores can otherwise look confusing.
Brissett is listed with 320 passing yards, but Arizona finished with 312 net passing yards. The difference comes from the eight yards lost on two sacks. The NFL gamebook lists Arizona at 320 gross passing yards, 8 sack yards lost and 312 net passing yards. (NFL)
That distinction is useful when comparing quarterback statistics with team offensive statistics.
Indianapolis Colts Passing Stats
Daniel Jones delivered a lower-volume passing performance than Brissett, but Indianapolis did not need Jones to throw 40 or more passes.
| Player | Comp/Att | Gross Yards | TD | INT | QBR | Rating |
| Daniel Jones | 22/30 | 212 | 2 | 1 | 60.4 | 101.0 |
Jones completed 22 of 30 passes, a completion rate of 73.3%. He threw two touchdown passes and one interception, finishing with a 101.0 passer rating. (ESPN)
His workload was significantly lighter than Brissett’s:
- Brissett attempted 44 passes.
- Jones attempted 30 passes.
- Brissett completed 27 passes.
- Jones completed 22 passes.
- Brissett produced 320 gross passing yards.
- Jones produced 212 gross passing yards.
Yet the Colts’ offense did not need Jones to match Arizona’s passing volume because Indianapolis generated 150 rushing yards and two rushing touchdowns.
Jones also contributed on the ground, rushing five times for 20 yards and one touchdown. That gave Indianapolis another scoring dimension and helped the Colts finish with four total touchdowns. (ESPN)
Arizona Cardinals Rushing Stats
Arizona’s rushing production was much less efficient than Indianapolis’ ground game.
| Player | Carries | Yards | Average | TD | Long |
| Bam Knight | 11 | 34 | 3.1 | 1 | 7 |
| Michael Carter | 9 | 34 | 3.8 | 0 | 11 |
| Jacoby Brissett | 3 | 19 | 6.3 | 0 | 12 |
| Emari Demercado | 1 | 1 | 1.0 | 0 | 1 |
| Team | 24 | 88 | 3.7 | 1 | 12 |
Bam Knight led the Cardinals with 11 carries for 34 yards and a touchdown. Michael Carter also recorded 34 yards, but needed nine carries to reach that total. (ESPN)
The team average of 3.7 yards per rush was well below Indianapolis’ 5.6-yard average.
That difference becomes more meaningful when considering offensive balance. Arizona had the advantage in passing volume, but the Colts were more efficient when they ran the ball. Indianapolis gained 150 rushing yards on 27 attempts, while Arizona gained 88 on 24 attempts. (NFL)
Brissett’s 19 rushing yards were also notable. They were not enough to transform Arizona’s rushing attack, but they demonstrate that the Cardinals’ quarterback contributed some movement outside the pocket.
Indianapolis Colts Rushing Stats
Jonathan Taylor was the standout runner of the game.
| Player | Carries | Yards | Average | TD | Long |
| Jonathan Taylor | 21 | 123 | 5.9 | 1 | 30 |
| Daniel Jones | 5 | 20 | 4.0 | 1 | 17 |
| Ameer Abdullah | 1 | 7 | 7.0 | 0 | 7 |
| Team | 27 | 150 | 5.6 | 2 | 30 |
Taylor carried the ball 21 times for 123 yards, averaging 5.9 yards per carry. His longest run went for 30 yards, and he scored the go-ahead rushing touchdown late in the fourth quarter. (ESPN)
His workload is particularly important because Indianapolis did not rely on a high-volume passing attack.
Taylor accounted for 82% of Indianapolis’ rushing attempts and 82% of its rushing yards. That level of concentration shows how important the running back was to the Colts’ offensive identity in this matchup.
The decisive touchdown came with 4:32 remaining in the fourth quarter, when Taylor scored to put Indianapolis ahead 31-27. (ESPN)
That play became the final offensive touchdown of the game.
Arizona Cardinals Receiving Stats
Arizona’s passing production was spread across several players.
| Player | Receptions | Yards | Average | TD | Long | Targets |
| Zay Jones | 5 | 79 | 15.8 | 0 | 24 | 8 |
| Trey McBride | 8 | 72 | 9.0 | 1 | 26 | 11 |
| Michael Wilson | 4 | 44 | 11.0 | 0 | 30 | 5 |
| Elijah Higgins | 2 | 34 | 17.0 | 0 | 24 | 2 |
| Marvin Harrison Jr. | 2 | 32 | 16.0 | 0 | 21 | 2 |
| Michael Carter | 2 | 30 | 15.0 | 0 | 16 | 5 |
| Bam Knight | 1 | 20 | 20.0 | 0 | 20 | 2 |
| Greg Dortch | 3 | 9 | 3.0 | 1 | 12 | 3 |
Zay Jones led Arizona in receiving yards with 79, while Trey McBride led the team in both receptions and receiving touchdowns. McBride caught eight passes for 72 yards and a touchdown on 11 targets. (ESPN)
Trey McBride’s Role
McBride’s workload is one of the clearest indicators of how Arizona moved the football.
His 11 targets represented approximately 28% of Arizona’s 39 team targets. He converted those opportunities into eight receptions.
His touchdown came in the third quarter on a one-yard pass from Brissett. That score helped Arizona build momentum after trailing earlier in the game. (Arizona Cardinals)
McBride was also involved in the late stages of the game. Arizona reached the Indianapolis 9-yard line with less than a minute remaining, but the Cardinals could not complete the final pass into the end zone. (Arizona Cardinals)
Zay Jones’ Efficiency
Zay Jones produced 79 yards on only five receptions.
His 15.8 yards per reception was the highest figure among Arizona players with at least four receptions. That makes his performance easy to overlook if someone focuses only on touchdown totals.
Jones did not score, but his ability to generate chunk gains helped Arizona maintain a passing attack capable of moving the ball downfield.
Indianapolis Colts Receiving Stats
Indianapolis had fewer receptions and fewer receiving yards, but its passing game produced two touchdowns.
| Player | Receptions | Yards | Average | TD | Long | Targets |
| Tyler Warren | 6 | 63 | 10.5 | 1 | 23 | 9 |
| Alec Pierce | 2 | 48 | 24.0 | 0 | 26 | 4 |
| Josh Downs | 6 | 42 | 7.0 | 1 | 11 | 7 |
| Michael Pittman Jr. | 2 | 20 | 10.0 | 0 | 14 | 3 |
| Mo Alie-Cox | 1 | 16 | 16.0 | 0 | 16 | 2 |
| Jonathan Taylor | 4 | 14 | 3.5 | 0 | 13 | 4 |
| Ameer Abdullah | 1 | 9 | 9.0 | 0 | 9 | 1 |
Tyler Warren led the Colts with six catches for 63 yards and a touchdown. Josh Downs also caught six passes and scored a touchdown, although his receiving total was lower at 42 yards. (ESPN)
Alec Pierce had an interesting efficiency line. He caught only two passes, but those receptions produced 48 yards, an average of 24 yards per catch.
That is a useful reminder that reception totals do not always tell the full story of a player’s influence.
The Colts did not need one receiver to dominate the box score. Instead, the passing game distributed opportunities among Warren, Downs, Pierce and others while Taylor supplied the major rushing production.
The Most Important Defensive Player Stats
The defensive statistics show a relatively balanced game.
Arizona Defense
Mack Wilson Sr. led the Cardinals with nine total tackles, including six solo tackles. He also recorded Arizona’s only interception, returning it nine yards. (ESPN)
Arizona finished with:
- 66 total tackles
- 37 solo tackles
- 1 sack
- 3 tackles for loss
- 4 passes defended
- 1 interception
- 6 quarterback hits
The interception was particularly important because Indianapolis also committed one turnover through the air. Both teams finished with one turnover and neither team lost a fumble. (ESPN)
Indianapolis Defense
Germaine Pratt led the Colts with 11 total tackles and eight solo tackles.
The Colts recorded two sacks, compared with one for Arizona. Kwity Paye accounted for both of Indianapolis’ sacks, according to the game defensive statistics. Mekhi Blackmon recorded Indianapolis’ interception and returned it nine yards. (ESPN)
Indianapolis finished with:
- 65 total tackles
- 49 solo tackles
- 2 sacks
- 6 tackles for loss
- 3 passes defended
- 1 interception
- 12 quarterback hits
The sack and pressure numbers matter because Arizona’s offense was able to produce significant passing yardage despite those pressures.
Special Teams Player Stats
Special teams did not produce a touchdown, but several players made measurable contributions.
Arizona Special Teams
Greg Dortch was Arizona’s main return specialist.
He recorded four kickoff returns for 114 yards, averaging 28.5 yards per return, with a long of 36 yards. He also returned one punt for 12 yards. (ESPN)
Chad Ryland was perfect on his kicking attempts:
- Field goals: 2/2
- Long field goal: 44 yards
- Extra points: 3/3
- Total points: 9
Pat O’Donnell punted twice for 92 yards, averaging 46.0 yards per punt. One punt finished inside the 20-yard line. (ESPN)
Indianapolis Special Teams
Anthony Gould and Ashton Dulin combined for five kickoff returns and 135 yards.
Their combined average was 27.0 yards per return, with a long of 32 yards. Gould also returned one punt for no gain. (ESPN)
Michael Badgley converted his only field-goal attempt and all four extra-point attempts:
- Field goals: 1/1
- Long field goal: 45 yards
- Extra points: 4/4
- Total points: 7
Rigoberto Sanchez punted three times for 165 yards, averaging 55.0 yards per punt. His longest punt was 57 yards. (ESPN)
Why Arizona Had More Yardage but Lost
This is perhaps the most useful part of the box score for anyone trying to understand the game rather than simply record the numbers.
Arizona finished with 400 total yards.
Indianapolis finished with 355.
Normally, a 45-yard advantage in total offense might suggest the team with more yards controlled the game. That did not happen here. (Arizona Cardinals)
The explanation becomes clearer when several efficiency statistics are placed together.
1. Indianapolis was far better in the red zone
The Colts went 4-for-4 in the red zone.
Arizona went 3-for-6.
That means Indianapolis scored on every red-zone possession, while Arizona failed to finish half of its red-zone trips with points. (NFL)
This was arguably the biggest statistical difference in the game.
2. Indianapolis ran the ball more effectively
The Colts averaged 5.6 yards per rushing attempt.
Arizona averaged 3.7.
The 1.9-yard difference per rushing attempt may look small at first, but over an entire game it creates meaningful differences in down-and-distance situations.
Jonathan Taylor’s 5.9-yard average was especially important.
3. Arizona relied heavily on passing volume
Brissett attempted 44 passes.
Jones attempted 30.
Arizona therefore asked its quarterback to carry more of the offensive workload. The Cardinals generated 320 gross passing yards, but Indianapolis was able to balance its offense with 150 rushing yards. (ESPN)
4. Indianapolis scored four touchdowns
The Colts scored four touchdowns:
- Tyler Warren receiving touchdown
- Daniel Jones rushing touchdown
- Josh Downs receiving touchdown
- Jonathan Taylor rushing touchdown
Arizona scored three:
- Bam Knight rushing touchdown
- Trey McBride receiving touchdown
- Greg Dortch receiving touchdown
The Colts therefore converted their offensive production into one additional touchdown. (Arizona Cardinals)
Fourth Quarter Decided the Game
The final quarter is where the scoring balance shifted decisively.
Arizona entered the fourth quarter with a 24-17 lead after scoring 14 points in the third quarter. Indianapolis responded with 14 fourth-quarter points while Arizona managed only three. (Arizona Cardinals)
The Colts first tied the game when Daniel Jones connected with Josh Downs for a five-yard touchdown.
Arizona then answered with Chad Ryland’s 44-yard field goal to make it 27-24.
Indianapolis responded with Taylor’s touchdown run, taking a 31-27 lead.
Arizona still had a final opportunity.
Brissett drove the Cardinals into Indianapolis territory and eventually to the Colts’ 9-yard line. The Cardinals were unable to complete the final pass, allowing Indianapolis to preserve the four-point victory. (Arizona Cardinals)
That sequence explains why looking only at the full-game yardage totals can be misleading. Arizona generated plenty of offense, but Indianapolis made the decisive plays late.
Player Stat Comparison: Cardinals vs Colts
A compact comparison makes the contrast easier to understand.
| Category | Cardinals Leader | Colts Leader |
| Passing yards | Jacoby Brissett, 320 | Daniel Jones, 212 |
| Passing TDs | Jacoby Brissett, 2 | Daniel Jones, 2 |
| Rushing yards | Bam Knight, 34 | Jonathan Taylor, 123 |
| Rushing TDs | Bam Knight, 1 | Jonathan Taylor, 1 |
| Receptions | Trey McBride, 8 | Tyler Warren/Josh Downs, 6 each |
| Receiving yards | Zay Jones, 79 | Tyler Warren, 63 |
| Receiving TDs | Trey McBride, 1 | Tyler Warren/Josh Downs, 1 each |
| Tackles | Mack Wilson Sr., 9 | Germaine Pratt, 11 |
| Interceptions | Mack Wilson Sr., 1 | Mekhi Blackmon, 1 |
| Sacks | Team total, 1 | Team total, 2 |
| Kick return yards | Greg Dortch, 114 | Gould/Dulin, 135 combined |
The contrast is striking.
Arizona’s passing leaders accumulated more yardage than Indianapolis’ passing leaders. Indianapolis’ rushing leader, however, produced dramatically more than Arizona’s top rusher.
That difference helped shape the game’s outcome.
Key Takeaways From the Player Stats
Jacoby Brissett was productive, but the offense needed more efficiency
Brissett’s 320 passing yards and two touchdowns were strong volume numbers. He also completed 27 passes.
But Arizona’s offense ultimately went 3-for-6 in the red zone and finished with one fewer touchdown than Indianapolis. (NFL)
The quarterback statistics therefore need to be read alongside situational performance.
Jonathan Taylor changed the offensive balance
Taylor’s 123 yards on 21 carries gave Indianapolis a reliable rushing foundation.
His 30-yard longest run also demonstrated the ability to create explosive gains rather than simply grind out short runs.
Most importantly, his late touchdown put the Colts ahead.
Trey McBride remained a major part of Arizona’s passing attack
Eight catches on 11 targets made McBride Arizona’s most frequently targeted receiver.
His 72 yards were not the team high, but his touchdown and involvement in critical situations made him one of the most important players in the Cardinals’ passing game. (ESPN)
Tyler Warren provided efficient scoring production
Warren caught six of nine targets for 63 yards and a touchdown.
He led Indianapolis in receiving yards and opened the scoring with an eight-yard touchdown reception from Jones, according to Arizona’s official scoring summary. (Arizona Cardinals)
The defenses were close in overall volume
Arizona recorded 66 total tackles, while Indianapolis recorded 65.
Neither defense dominated the turnover battle because both teams intercepted one pass and neither team lost a fumble.
The Colts did generate one additional sack and more tackles for loss, while Arizona created more passes defended. (ESPN)
A Note About Passing Yards in the Box Score
One of the most common mistakes when analyzing football statistics is mixing gross passing yards with net passing yards.
For this game:
Arizona
- Gross passing yards: 320
- Sack yards lost: 8
- Net passing yards: 312
Indianapolis
- Gross passing yards: 212
- Sack yards lost: 7
- Net passing yards: 205
The player passing lines normally show the quarterback’s passing yard total before subtracting sack yardage. Team net passing statistics account for sack yardage. The NFL gamebook confirms this distinction. (NFL)
This explains why the Cardinals can have a quarterback listed with 320 passing yards while the team is listed with 312 net passing yards.
It is not a contradiction.
What the Team Stats Say About Game Control
There is another useful statistical contradiction in this matchup.
Arizona had:
- More total yards
- More offensive plays
- More passing first downs
- More third-down conversions
- More time of possession
Indianapolis had:
- More rushing yards
- Better yards per rushing attempt
- Better red-zone efficiency
- More total touchdowns
- The decisive fourth-quarter scoring advantage
That combination created a game in which Arizona could look statistically productive while Indianapolis controlled the most valuable scoring situations.
The official game statistics show Arizona converting 9 of 14 third downs, or 64.3%, while Indianapolis converted 4 of 8, or 50%. Yet the Colts were perfect in the red zone. (NFL)
This is why third-down conversion percentage and total yardage should not be treated as standalone measures of who played the more effective game.
What Happened in Each Quarter?
First Quarter
Both teams scored seven points.
Indianapolis opened the scoring with Tyler Warren’s touchdown reception.
Arizona answered with Bam Knight’s one-yard rushing touchdown.
The opening quarter therefore ended tied at 7-7. (Arizona Cardinals)
Second Quarter
The Colts added a rushing touchdown from Daniel Jones.
Arizona responded with a Chad Ryland field goal.
Indianapolis entered halftime with a 14-10 advantage. (Arizona Cardinals)
Third Quarter
Arizona produced its biggest offensive surge of the game.
McBride caught a one-yard touchdown pass from Brissett, and Greg Dortch later caught a 12-yard touchdown pass.
The Cardinals scored 14 points in the quarter.
Indianapolis managed only three points, allowing Arizona to take a 24-17 lead entering the fourth quarter. (Arizona Cardinals)
Fourth Quarter
Indianapolis reversed the momentum.
Josh Downs caught a five-yard touchdown pass to tie the game.
Arizona answered with a field goal.
Taylor then scored the go-ahead touchdown, giving Indianapolis a 31-27 lead.
Arizona reached the Colts’ 9-yard line on its final possession but failed to complete the game-tying or go-ahead touchdown pass. (ESPN)
How to Read These Player Stats Correctly
For readers checking a box score for fantasy football, historical research or game analysis, several numbers deserve more attention than others.
Start with volume
Targets, carries and pass attempts show how frequently a player was involved.
McBride’s 11 targets and Taylor’s 21 carries were strong indicators of offensive involvement.
Then check efficiency
Volume alone does not show how productive those opportunities were.
Taylor averaged 5.9 yards per carry.
Jones completed 73.3% of his passes.
Zay Jones averaged 15.8 yards per reception.
Alec Pierce averaged 24.0 yards on his two catches.
These figures reveal different types of offensive impact.
Finally, check scoring situations
The red-zone numbers provide critical context.
Indianapolis went 4-for-4.
Arizona went 3-for-6.
That difference helps explain why the Colts won despite Arizona finishing with 45 more total yards. (NFL)
Official Game Information
For readers who want to cross-check individual statistics, scoring plays and team totals, the official NFL Game Center provides the game’s official information and scoring breakdown. (NFL)
The NFL gamebook also confirms the final team statistics, including 400 total yards for Arizona, 355 for Indianapolis, 150 rushing yards for the Colts and 88 for the Cardinals. (NFL)
Frequently Asked Questions
Who led the Cardinals in passing against the Colts?
Jacoby Brissett led Arizona with 27 completions on 44 attempts for 320 gross passing yards, two touchdowns and one interception. He finished with an 89.2 passer rating. (ESPN)
Who led the Colts in rushing?
Jonathan Taylor led Indianapolis with 21 carries for 123 yards, an average of 5.9 yards per carry, and one touchdown. His longest run was 30 yards. (ESPN)
Who had the most receiving yards for Arizona?
Zay Jones led the Cardinals with 79 receiving yards on five catches. Trey McBride had more receptions, with eight, and also scored a touchdown. (ESPN)
Who led the Colts in receiving?
Tyler Warren led Indianapolis with six receptions for 63 yards and one touchdown. Josh Downs also caught six passes and scored a touchdown, finishing with 42 receiving yards. (ESPN)
How many turnovers did each team have?
Both teams had one turnover. Arizona intercepted Daniel Jones once, while Indianapolis intercepted Jacoby Brissett once. Neither team lost a fumble. (ESPN)
Why did Indianapolis win despite Arizona gaining more yards?
The Colts were more efficient in key scoring situations. Indianapolis went 4-for-4 in the red zone, while Arizona went 3-for-6. The Colts also ran for 150 yards compared with Arizona’s 88 and scored 14 fourth-quarter points compared with Arizona’s three. (Arizona Cardinals)
Conclusion
The arizona cardinals vs colts match player stats show a game that cannot be explained by total yardage alone.
Arizona generated 400 total yards and 320 gross passing yards from Brissett. The Cardinals also converted 64.3% of their third-down attempts and held possession for more than 32 minutes. Those numbers demonstrate that Arizona was able to sustain offensive drives and move the football. (NFL)
Indianapolis answered with a more efficient rushing attack. Taylor’s 123 yards led a 150-yard team rushing performance, while Daniel Jones contributed 20 rushing yards and a touchdown. The Colts also converted every red-zone opportunity into points. (ESPN)
The fourth quarter ultimately separated the teams. Indianapolis scored 14 points in the final period, including Taylor’s go-ahead touchdown, while Arizona scored only three. The Cardinals had one final opportunity and moved to the Indianapolis 9-yard line, but the Colts’ defense held on the final sequence. (ESPN)
For anyone studying this box score, the most useful takeaway is the relationship between volume, efficiency and scoring opportunities. Brissett produced more passing yards than Jones, Arizona produced more total yards than Indianapolis, and the Cardinals converted more third downs. Yet Indianapolis finished every red-zone trip with points, ran the ball more effectively and made the decisive plays late.
That is what makes this 31-27 result particularly useful for understanding NFL player statistics. Individual numbers become much more meaningful when they are connected to how each team converted those opportunities into points.