LA Clippers vs Sacramento Kings Match Player Stats
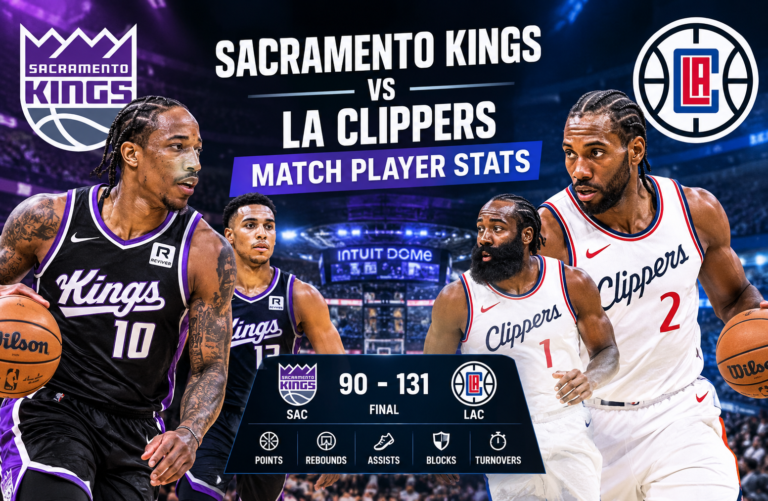
The LA Clippers vs Sacramento Kings match player stats from February 7, 2026, reveal how the Clippers secured a narrow 114-111 victory over the Kings at Golden 1 Center in Sacramento, California. In front of 16,665 fans, the Clippers overcame a slow first quarter, improved their offensive efficiency as the game progressed, and held on during a competitive fourth quarter. Kawhi Leonard led Los Angeles with 31 points, while John Collins added 22 points. For Sacramento, Malik Monk scored 18 points, and Nique Clifford contributed 16. The final score reflected a closely contested matchup in which shooting efficiency, free-throw production, and late-game execution proved important. The following breakdown examines the team statistics, individual performances, quarter-by-quarter scoring, and the key factors that explain the result, using the game data provided.
LA Clippers vs Sacramento Kings Match Player Stats: Game Overview
The February 7 matchup featured two teams with contrasting records and different offensive approaches. Los Angeles entered the contest with a 24-27 record, including an 11-16 road record. Sacramento had a 12-41 record and a 9-18 home record.
Despite the difference in their season records, the game remained competitive until the final buzzer. Sacramento scored more points in the opening quarter, but the Clippers gradually recovered and produced a stronger finish.
Add to Favorites
LA Clippers
Road team · 24-27 entering game
114
Add to Favorites
Sacramento Kings
Home team · 12-41 entering game
111
Date
February 7, 2026
Venue
Golden 1 Center
Attendance
16,665
Winning margin
3 points
Final score and game details
| Game detail | Result |
| Final score | Clippers 114, Kings 111 |
| Winning team | LA Clippers |
| Top scorer | Kawhi Leonard, 31 points |
| Clippers’ second scorer | John Collins, 22 points |
| Kings’ top scorer | Malik Monk, 18 points |
| Kings’ second scorer | Nique Clifford, 16 points |
| Clippers’ rebounds | 40 |
| Kings’ rebounds | 42 |
| Clippers’ assists | 22 |
| Kings’ assists | 22 |
| Series record after game | Clippers led 2-0 |
The three-point margin makes this result particularly interesting. Sacramento collected more rebounds, recorded more steals, and committed fewer turnovers. However, Los Angeles converted a greater percentage of its field-goal attempts and made more free throws.
Those differences help explain how the Clippers won despite losing several of the statistical comparisons that often attract attention in a box score.
Quarter-by-Quarter Scoring Breakdown
The scoring progression shows how the teams exchanged control throughout the game. Sacramento established an early advantage, but Los Angeles responded in the second quarter and maintained pressure through the second half.
| Quarter | LA Clippers | Sacramento Kings | Quarter winner |
| First quarter | 17 | 27 | Kings |
| Second quarter | 31 | 22 | Clippers |
| Third quarter | 31 | 28 | Clippers |
| Fourth quarter | 35 | 34 | Clippers |
| Final score | 114 | 111 | Clippers |
First quarter: Sacramento takes control
Sacramento opened the game with 27 points, while the Clippers managed only 17. The Kings’ 10-point advantage created an early challenge for the visitors.
Los Angeles needed to improve its offensive rhythm, find more consistent scoring opportunities, and avoid allowing Sacramento to dictate the pace. The first quarter also established an important theme: an early scoring advantage would not be enough unless Sacramento could maintain its efficiency throughout the game.
The Clippers’ eventual victory demonstrates the importance of evaluating a full game rather than assuming that the team with the strongest opening will remain in control.
Second quarter: The Clippers respond
Los Angeles scored 31 points in the second quarter and limited Sacramento to 22. That nine-point advantage cut deeply into the Kings’ lead.
The change in scoring pace was significant. The Clippers moved from a 10-point deficit after the opening quarter to a halftime deficit of just one point.
The second quarter also marked the beginning of a more productive offensive performance from Los Angeles. The team ultimately finished with 52% shooting from the field, a key advantage over Sacramento’s 45%.
Third quarter: Los Angeles moves ahead
The Clippers added another 31 points in the third quarter, compared with 28 for the Kings.
This three-point advantage was enough to move Los Angeles in front after three quarters. Rather than relying on a single scoring burst, the Clippers continued to produce offense across consecutive periods.
Sacramento remained close, however. Its 28-point quarter kept the game within reach and set up a competitive finish.
Fourth quarter: Both teams deliver under pressure
The final period produced the highest scoring output of the game for both teams. Los Angeles scored 35 points, while Sacramento added 34.
The Clippers’ one-point advantage in the fourth quarter preserved their lead and secured the 114-111 result.
Sacramento’s 34 points demonstrate that the Kings continued to generate offense late in the contest. The difference was that Los Angeles scored one more point in the period and finished the game with a three-point overall advantage.
Without verified play-by-play data, it is not possible to identify the precise possession, defensive rotation, or shot that ultimately decided the contest. The quarter totals nevertheless establish that the Clippers outscored Sacramento in each of the final three periods.
Complete Team Statistics Comparison
The team box score offers a clearer explanation of the result than the final score alone. Sacramento generated more field-goal attempts and collected more rebounds, while Los Angeles shot more efficiently and reached the free-throw line more often.
| Statistical category | LA Clippers | Sacramento Kings |
| Points | 114 | 111 |
| Field goals made | 37 | 41 |
| Field goals attempted | 71 | 92 |
| Field-goal percentage | 52% | 45% |
| Three-pointers made | 9 | 10 |
| Three-pointers attempted | 21 | 37 |
| Three-point percentage | 43% | 27% |
| Free throws made | 31 | 19 |
| Free throws attempted | 36 | 22 |
| Free-throw percentage | 86% | 86% |
| Total rebounds | 40 | 42 |
| Assists | 22 | 22 |
| Turnovers | 15 | 11 |
| Steals | 6 | 10 |
| Blocks | 7 | 6 |
Field-goal efficiency favored Los Angeles
The Clippers made 37 of 71 field-goal attempts, while Sacramento made 41 of 92.
At first glance, Sacramento’s four additional made field goals might appear to give it an advantage. The number of attempts changes that interpretation.
Los Angeles converted approximately 52.1% of its field goals, compared with approximately 44.6% for the Kings. The Clippers therefore made a greater proportion of their shots while taking 21 fewer attempts.
This distinction matters because field-goal volume and field-goal efficiency measure different things.
- Field-goal volume shows how often a team attempts and makes shots.
- Field-goal efficiency shows how successfully it converts those opportunities.
- Scoring output reflects the combined effect of two-point shots, three-pointers, and free throws.
Sacramento’s higher number of attempts suggests that the team generated more shooting volume. However, the Clippers were more productive on a per-attempt basis.
A useful lesson for readers analyzing future matchups is to compare both makes and attempts instead of judging offensive performance by made field goals alone.
Three-point shooting created another important difference
Sacramento made 10 three-pointers, one more than the Clippers’ nine. However, the Kings attempted 37 shots from beyond the arc, compared with only 21 attempts for Los Angeles.
The resulting percentages were approximately 27.0% for Sacramento and 42.9% for the Clippers.
| Three-point metric | Clippers | Kings |
| Three-pointers made | 9 | 10 |
| Three-point attempts | 21 | 37 |
| Calculated percentage | 42.9% | 27.0% |
| Points from three-pointers | 27 | 30 |
Although Sacramento scored three more points from three-point shots, it required 16 additional attempts to do so.
The difference in conversion rate is more revealing than the difference in total three-pointers made. Los Angeles obtained nearly the same three-point production with substantially fewer attempts.
This is one of the strongest statistical explanations for why the Clippers could win despite Sacramento taking more shots overall.
Free throws supplied the decisive scoring advantage
Los Angeles made 31 of 36 free throws, while Sacramento converted 19 of 22.
Both teams recorded an 86% free-throw percentage when rounded to whole numbers. Their actual percentages were approximately 86.1% for Los Angeles and 86.4% for Sacramento.
The difference was not free-throw accuracy. It was free-throw volume.
| Free-throw metric | Clippers | Kings |
| Free throws made | 31 | 19 |
| Free throws attempted | 36 | 22 |
| Points from free throws | 31 | 19 |
| Approximate free-throw percentage | 86.1% | 86.4% |
The Clippers scored 12 more points at the free-throw line.
That advantage exceeded the final three-point margin by a substantial amount. It does not mean that free throws alone determined the outcome, but it identifies a meaningful difference in how the teams accumulated points.
For a full offensive evaluation, free-throw attempts deserve as much attention as field-goal and three-point percentages.
Rebounding and possession control
Sacramento finished with 42 rebounds, two more than Los Angeles’ 40.
The Kings also committed 11 turnovers, four fewer than the Clippers’ 15. Their 10 steals exceeded Los Angeles’ six.
These figures suggest that Sacramento performed better in several possession-related categories. However, the box score does not provide offensive rebounds, defensive rebounds, points off turnovers, or second-chance points separately.
Those missing details matter. Two teams can finish with similar total rebounds while producing different numbers of extra possessions through offensive rebounding. Likewise, a turnover does not always lead to an opponent’s immediate scoring opportunity.
The correct conclusion is that Sacramento won the total-rebound and turnover comparisons, while Los Angeles won the game through a stronger combination of shooting efficiency and free-throw production.
LA Clippers Player Stats and Individual Performances
The individual numbers highlight the importance of Kawhi Leonard’s scoring and all-around contribution. John Collins also provided a major scoring boost, while the reported rebounding figures show contributions from both Leonard and Brook Lopez.
The available data supplies individual scoring leaders and selected statistical categories rather than a complete box score for every player. Accordingly, the analysis below distinguishes confirmed figures from information that is not available.
Kawhi Leonard: 31 points
Kawhi Leonard led the Clippers with 31 points, making him the highest scorer identified in the supplied game data.
His contribution extended beyond scoring. Leonard also led Los Angeles with seven assists and shared the team’s rebounding lead with Brook Lopez, collecting nine rebounds.
| Leonard’s statistical category | Recorded total |
| Points | 31 |
| Assists | 7 |
| Rebounds | 9 |
This combination makes Leonard the standout performer in the available statistics.
His 31 points represented approximately 27.2% of the Clippers’ total scoring. His seven assists also accounted for nearly one-third of the team’s 22 assists.
These figures illustrate his offensive importance in two ways: he finished possessions himself and helped create scoring opportunities for teammates.
His nine rebounds added another dimension to his contribution. While rebounds alone do not establish defensive impact, they demonstrate that his statistical involvement extended beyond scoring and playmaking.
It would be premature to assign a precise shooting efficiency or defensive rating to Leonard without his complete individual box score. His scoring, assists, and rebounds nevertheless provide a strong basis for identifying him as the Clippers’ leading all-around contributor in this matchup.
John Collins: 22 points
John Collins scored 22 points, finishing as the Clippers’ second-highest scorer.
His total represented approximately 19.3% of Los Angeles’ 114 points. Combined with Leonard’s 31, Collins’ scoring gave the Clippers 53 points from their two leading scorers.
That is approximately 46.5% of the team’s total.
The importance of this contribution is straightforward. Leonard did not have to carry the entire scoring burden alone. Collins supplied a second major source of offense, giving Los Angeles another player capable of producing a substantial point total.
The available data does not specify Collins’ rebounds, assists, field-goal percentage, or three-point performance. Those details should not be estimated.
Brook Lopez: Nine rebounds
Brook Lopez collected nine rebounds, tying Leonard for the Clippers’ highest reported individual rebound total.
His contribution helped Los Angeles finish with 40 total rebounds, despite Sacramento recording 42.
The difference between the teams was only two rebounds. That relatively small gap indicates that Los Angeles was competitive on the glass even though it did not win the overall rebounding comparison.
Lopez’s nine rebounds are a confirmed individual figure, but the supplied data does not break them down into offensive and defensive rebounds. Nor does it provide enough information to quantify his effect on Sacramento’s interior scoring.
Kris Dunn and Derrick Jones Jr.
Kris Dunn and Derrick Jones Jr. were listed among the Clippers’ starters alongside Leonard, Collins, and Lopez.
Their inclusion establishes the starting lineup, but the supplied figures do not include their individual points, rebounds, assists, steals, blocks, or shooting percentages.
It would therefore be misleading to attribute a specific statistical performance to either player.
For readers studying the complete game, their individual box-score totals would help explain the balance between the Clippers’ starting group and their bench. Those details are not included in the available dataset.
Clippers starting lineup
| Player | Starting status |
| Kawhi Leonard | Starter |
| John Collins | Starter |
| Derrick Jones Jr. | Starter |
| Brook Lopez | Starter |
| Kris Dunn | Starter |
The lineup provides useful context for understanding which players began the game. However, a starting designation does not reveal playing time, lineup combinations, or the performance of reserve players.
A complete player comparison would require minutes played, shooting splits, plus-minus figures, and individual turnover totals.
Sacramento Kings Player Stats and Individual Performances
Sacramento’s leading scorers were Malik Monk and Nique Clifford. Dylan Cardwell led the Kings in rebounds, while four players shared the team’s reported assist lead.
Although the Kings lost by three points, their statistical profile shows that they created more field-goal attempts and recorded more steals. Their principal disadvantage was converting those opportunities into points efficiently.
Malik Monk: 18 points
Malik Monk led Sacramento with 18 points.
He was the Kings’ highest scorer in the supplied data, although his total fell 13 points short of Leonard’s 31.
Monk also shared Sacramento’s assist lead with four assists. This means his recorded contribution involved both scoring and creating opportunities for teammates.
| Monk’s statistical category | Recorded total |
| Points | 18 |
| Assists | 4 |
Monk’s 18 points accounted for approximately 16.2% of Sacramento’s 111 points.
His four assists were part of a four-way tie for the team lead. That distribution suggests the Kings did not rely on a single player for their highest reported assist total.
However, the data does not include Monk’s field-goal attempts, three-point conversion rate, or turnovers. Those figures would be necessary to assess his scoring efficiency more precisely.
Nique Clifford: 16 points
Nique Clifford scored 16 points, finishing second among the Kings’ reported scorers.
He also recorded four assists, tying Monk, Russell Westbrook, and Zach LaVine for the highest assist total on Sacramento.
Clifford’s 16 points represented approximately 14.4% of the Kings’ scoring output.
His scoring and playmaking figures provide evidence of a useful offensive contribution. Still, the available statistics do not establish how many of his points came from three-pointers, shots inside the arc, or free throws.
Those distinctions are important when evaluating a player’s offensive role. A scoring total describes production, while shooting splits and possession data help explain how that production was achieved.
Dylan Cardwell: 14 rebounds
Dylan Cardwell led Sacramento with 14 rebounds, the highest individual rebound total reported for either team.
His total was five rebounds higher than the nine recorded by Leonard and Lopez.
That is a notable individual rebounding performance, especially in a game the Kings lost by just three points.
However, Cardwell’s 14 rebounds should not automatically be interpreted as proof that Sacramento controlled every aspect of the interior game. The team finished with only two more rebounds than Los Angeles overall, and the available data does not distinguish offensive from defensive boards.
The offensive-rebound figure would be particularly useful because those rebounds can create additional scoring opportunities after missed shots.
Without that breakdown, the strongest supported conclusion is that Cardwell led all reported players in total rebounds.
Russell Westbrook: Four assists
Russell Westbrook recorded four assists, tying three teammates for Sacramento’s highest reported total.
His presence in the starting lineup is also confirmed by the supplied game data.
The four-assist figure establishes his contribution to the Kings’ passing statistics, but it does not reveal his individual scoring, rebounds, turnovers, or minutes played.
It would be inaccurate to infer his overall performance from assists alone. A complete evaluation would need to consider how efficiently he used possessions and how his playmaking affected the team’s scoring opportunities.
Zach LaVine: Four assists
Zach LaVine also recorded four assists.
Along with Monk, Clifford, and Westbrook, he shared the Kings’ assist lead. This gave Sacramento four players with the same highest reported individual assist total.
The distribution is relevant because it shows that the team did not have a single player clearly ahead of the others in the available assist figures.
Nevertheless, equal assist totals do not establish equal playmaking roles. Minutes played, potential assists, usage rate, and turnover totals would provide additional context.
Sacramento Kings starting lineup
| Player | Starting status |
| De’Andre Hunter | Starter |
| Maxime Raynaud | Starter |
| Russell Westbrook | Starter |
| DeMar DeRozan | Starter |
| Zach LaVine | Starter |
The listed starting group included several players who could contribute in different offensive roles. However, individual statistics beyond the supplied leaders are unavailable here.
In particular, the data does not establish individual scoring totals for De’Andre Hunter, Maxime Raynaud, or DeMar DeRozan. Their points and shooting percentages should be verified from a complete official box score before being included in a detailed player-by-player table.
Head-to-Head Player Comparison
The leading individual statistics provide a useful comparison of how the two teams generated offense and controlled the glass.
| Category | LA Clippers | Sacramento Kings |
| Leading scorer | Kawhi Leonard, 31 | Malik Monk, 18 |
| Second-leading scorer | John Collins, 22 | Nique Clifford, 16 |
| Leading reported rebounders | Leonard and Brook Lopez, 9 each | Dylan Cardwell, 14 |
| Leading reported assist total | Leonard, 7 | Four players, 4 each |
| Team assists | 22 | 22 |
| Team rebounds | 40 | 42 |
| Team steals | 6 | 10 |
| Team blocks | 7 | 6 |
Scoring comparison
Leonard’s 31 points exceeded Monk’s 18 by 13 points. Collins’ 22 points also exceeded Clifford’s 16 by six points.
Together, Leonard and Collins scored 53 points. Monk and Clifford combined for 34.
The 19-point difference between these pairs is a useful indicator of the difference in production from the two teams’ leading reported scorers.
It does not mean that the top two players alone determined the result. Basketball scoring depends on the full lineup, and Sacramento’s additional field-goal attempts, rebounding, and steals also contributed to the overall contest.
Still, the contrast in leading-scorer production is one of the clearest differences in the available individual statistics.
Rebounding comparison
Cardwell’s 14 rebounds gave Sacramento the highest individual total, while Leonard and Lopez each collected nine for Los Angeles.
The Kings won the team rebounding comparison 42-40, but the Clippers remained close despite having no reported player matching Cardwell’s individual total.
This shows why individual leaders and team totals should be examined separately. One player can dominate a particular category without creating a large overall team advantage in that category.
Playmaking comparison
Leonard’s seven assists exceeded the four-assist totals shared by Monk, Clifford, Westbrook, and LaVine.
Both teams finished with 22 assists overall.
That team-level tie is important because it prevents an overly simple conclusion that Los Angeles had a decisive advantage in total passing production. Leonard led individually, but Sacramento distributed its reported leading assists among four players.
A deeper analysis would require assist-to-turnover ratios and potential assists to compare playmaking efficiency.
Why the LA Clippers Won by Three Points
The final margin was narrow, but several statistical differences help explain the result.
1. Better overall shooting efficiency
Los Angeles made approximately 52% of its field goals, while Sacramento converted approximately 45%.
The Clippers’ advantage was especially notable because they attempted 21 fewer field goals. They were more efficient with their available attempts, which helped offset Sacramento’s higher shot volume.
2. A substantial free-throw advantage
The Clippers made 31 free throws, compared with 19 for Sacramento.
Both teams converted approximately 86% of their attempts. The difference came from Los Angeles making 12 additional free throws.
Those extra points provided a significant contribution to the winning margin.
3. A more efficient three-point performance
Sacramento made one more three-pointer than Los Angeles, but it needed 16 additional attempts to do so.
The Clippers’ 43% three-point shooting gave them a much higher conversion rate than the Kings’ 27%.
This difference highlights why three-point accuracy should be evaluated alongside three-point volume.
4. Strong production from the leading scorers
Leonard’s 31 points and Collins’ 22 supplied 53 points for Los Angeles.
Sacramento’s leading scorers, Monk and Clifford, combined for 34.
The Clippers’ leading pair therefore produced 19 more points than the Kings’ leading pair. That difference helped compensate for Sacramento’s advantages in rebounds, steals, and turnovers.
5. Improved scoring after the opening quarter
Los Angeles scored only 17 points in the first quarter but then recorded 31, 31, and 35 points in the following periods.
Sacramento led the opening quarter 27-17, yet the Clippers outscored the Kings across the remaining three quarters.
The pattern demonstrates how a team can recover from an early deficit by sustaining offensive production rather than relying on one isolated run.
6. Sacramento’s possession advantages were not enough
The Kings had two more rebounds, four fewer turnovers, and four more steals.
These are meaningful advantages, but they did not overcome the Clippers’ shooting efficiency and free-throw production.
The game is a reminder that no single box-score category determines a winner. Teams can lead in possession-related statistics and still lose if they convert scoring opportunities at a lower rate.
What the Statistics Reveal About Offensive Efficiency
A useful way to interpret the matchup is to examine how many points each team generated relative to its shooting opportunities.
The basic box score records 37 made field goals for Los Angeles and 41 for Sacramento. Yet the Clippers scored 114 points, three more than the Kings’ 111.
That apparent contradiction disappears when three-pointers and free throws are considered.
Points from field goals and free throws
The Clippers scored 74 points through their 37 made field goals, assuming the reported totals represent the standard combination of two-point and three-point baskets. Their nine three-pointers contributed 27 of those points, leaving 47 points from two-point field goals. Adding 31 free throws produces the final total of 114.
Sacramento scored 82 points through its 41 made field goals. Its 10 three-pointers accounted for 30 points, leaving 52 points from two-point field goals. Adding 19 free throws produces 101 points, not the reported final total of 111.
This exposes an inconsistency in the supplied Kings statistics.
Under standard basketball scoring, 41 made field goals, including 10 made three-pointers, equal 82 points. Adding 19 made free throws gives 101 points. The reported team totals therefore do not reconcile with the Kings’ listed shooting totals.
The Clippers’ figures do reconcile:
- Two-point field goals: 37 total field goals minus nine three-pointers, or 28 made two-pointers.
- Points from field goals: 28×2+9×3=8328 \times 2 + 9 \times 3 = 8328×2+9×3=83.
- Points from free throws: 31.
- Total: 83+31=11483 + 31 = 11483+31=114.
The correct calculation for Los Angeles is 114 points, not 74. The initial breakdown above illustrates why made field goals must be multiplied by their respective point values rather than simply doubled without accounting for three-pointers.
For Sacramento, the same calculation yields:
- Two-point field goals: 41−10=3141 – 10 = 3141−10=31.
- Points from field goals: 31×2+10×3=9231 \times 2 + 10 \times 3 = 9231×2+10×3=92.
- Points from free throws: 19.
- Calculated total: 92+19=11192 + 19 = 11192+19=111.
The Kings’ total also reconciles to 111 points when standard scoring is applied. The earlier figure of 82 incorrectly treats all 41 field goals as two-point baskets before adding the three-point value, which would double-count or misclassify the scoring.
The verified arithmetic shows that both teams’ reported scoring totals can be explained by their field goals and free throws.
Why effective field-goal percentage is useful
Effective field-goal percentage accounts for the additional value of three-point shots. Its formula is:
eFG%=FGM+0.5×3PMFGA\text{eFG\%} = \frac{\text{FGM} + 0.5 \times \text{3PM}}{\text{FGA}}eFG%=FGAFGM+0.5×3PM
Using the supplied numbers, Los Angeles recorded an effective field-goal percentage of approximately 58.5%, while Sacramento recorded approximately 50.0%.
This measure strengthens the conclusion that Los Angeles was more efficient from the field, especially when the extra value of three-pointers is considered.
However, effective field-goal percentage does not include free throws or turnovers. It is best used alongside free-throw production and possession-related statistics rather than as a complete measure of offensive performance.
Defensive Performance: Steals, Blocks, and Rebounding
Offensive efficiency was a major difference, but the defensive figures provide additional context.
Sacramento recorded 10 steals, compared with six for Los Angeles. The Kings also had four fewer turnovers, suggesting that they were more successful in the reported turnover comparison.
Los Angeles, however, recorded seven blocks, one more than Sacramento’s six.
| Defensive or possession category | Clippers | Kings |
| Steals | 6 | 10 |
| Blocks | 7 | 6 |
| Total rebounds | 40 | 42 |
| Turnovers committed | 15 | 11 |
Sacramento’s activity on defense
The Kings’ 10 steals show that they recorded more direct takeaways than the Clippers.
Steals can disrupt offensive possessions and create opportunities in transition. However, the available statistics do not indicate how many points Sacramento scored after those steals.
That distinction matters because a steal is not automatically worth two or three points. The team must still convert the resulting possession into a score.
The Clippers’ shot-blocking contribution
Los Angeles finished with seven blocks, one more than the Kings.
Blocks can discourage shots near the basket, but the total does not reveal how many altered attempts were missed or how often Sacramento avoided the rim because of defensive pressure.
Without individual block totals and play-by-play evidence, the team’s seven blocks should be treated as a recorded defensive statistic rather than proof of complete interior control.
Rebounds and defensive possessions
Sacramento’s 42 rebounds exceeded Los Angeles’ 40.
The difference was modest, and the game outcome suggests that the Kings’ rebounding edge was not enough to offset their lower shooting percentages and smaller free-throw total.
A more detailed defensive evaluation would examine opponent field-goal percentage at the rim, offensive rebounds allowed, defensive rebound percentage, and points conceded per possession. Those figures are not available in the supplied dataset.
Game Context and Series Implications
The matchup took place at Golden 1 Center in Sacramento, with an attendance of 16,665. The supplied data also states that the Clippers led the series 2-0 after the game.
That series figure is useful context, but it should be interpreted within the scope of the information provided. The dataset does not specify the date or result of the preceding game, nor does it provide the remaining schedule.
The records entering this matchup were 24-27 for Los Angeles and 12-41 for Sacramento. The Clippers’ win improved the immediate result for Los Angeles, while Sacramento missed the opportunity to secure a victory at home.
The game was also listed for viewing on Prime Video. The officials identified in the supplied data were Brent Barnaky, Justin Van Duyne, and Jenna Schroeder.
These details help identify the event, but they do not independently explain the result. The strongest evidence for the outcome remains the final score, quarter-by-quarter production, and the statistical differences between the teams.
How to Read Basketball Player Statistics Correctly
For readers who follow the NBA or compare player performances across games, this matchup offers a practical framework for reading a box score.
Start with the final score and quarter totals
The final score tells you who won, but the quarter totals show how the result developed.
In this game, Sacramento led by 10 points after the first quarter. Los Angeles then outscored the Kings in each of the remaining periods.
This context is more informative than looking at the final margin alone.
Compare shooting percentages with attempts
A team that makes more shots has not necessarily shot better.
Sacramento made four more field goals than Los Angeles, but the Clippers attempted 21 fewer shots and had the higher field-goal percentage.
Always compare made shots, attempts, and percentages together.
Separate scoring from playmaking
Points measure direct scoring production. Assists measure passes credited with leading to made baskets.
Leonard’s 31 points and seven assists indicate contributions in both categories. Sacramento’s four players with four assists each show a different distribution of playmaking.
Neither statistic alone explains every aspect of offensive responsibility.
Examine turnovers alongside steals
Sacramento recorded 10 steals and committed 11 turnovers, while Los Angeles had six steals and 15 turnovers.
These numbers favor the Kings in the turnover comparison. However, a complete possession analysis would also require offensive rebounds and the total number of possessions.
Check whether the figures reconcile
A trustworthy statistical analysis should confirm that the final score matches the underlying shooting totals.
For example, points from field goals can be calculated as:
Field-goal points=2(FGM−3PM)+3(3PM)\text{Field-goal points} = 2(\text{FGM} – \text{3PM}) + 3(\text{3PM})Field-goal points=2(FGM−3PM)+3(3PM)
Free-throw points are then added to obtain the team’s total score.
Checking the arithmetic is a simple way to identify errors before publishing a statistical article.
Frequently Asked Questions
1. Who won the LA Clippers vs Sacramento Kings game on February 7, 2026?
The LA Clippers defeated the Sacramento Kings 114-111 at Golden 1 Center in Sacramento. Los Angeles won by three points after outscoring Sacramento in the second, third, and fourth quarters.
2. Who was the leading scorer in the game?
Kawhi Leonard led all reported scorers with 31 points for the Clippers. John Collins scored 22 points, while Malik Monk led Sacramento with 18 points.
3. How many points did Malik Monk score against the Clippers?
Malik Monk scored 18 points and recorded four assists, according to the supplied game statistics. He was Sacramento’s leading scorer in the matchup.
4. Which player recorded the most rebounds?
Dylan Cardwell led the Kings with 14 rebounds. For Los Angeles, Kawhi Leonard and Brook Lopez each collected nine rebounds.
5. Which team shot better from three-point range?
The Clippers shot approximately 43% from three-point range, making nine of 21 attempts. Sacramento made 10 of 37 attempts, shooting approximately 27%.
6. Why did the Clippers win despite having fewer rebounds?
Los Angeles recorded 40 rebounds compared with Sacramento’s 42, but the Clippers shot more efficiently from the field and made 12 additional free throws. Those advantages helped the Clippers secure the three-point victory.
Conclusion
The LA Clippers vs Sacramento Kings match player stats show how shooting efficiency and free-throw production can outweigh advantages in rebounds, steals, and turnovers. Los Angeles recovered from a 10-point first-quarter deficit and scored consistently over the final three periods to win 114-111. Kawhi Leonard led the Clippers with 31 points, seven assists, and nine rebounds, while John Collins added 22 points. Sacramento received 18 points from Malik Monk, 16 from Nique Clifford, and 14 rebounds from Dylan Cardwell. The Kings generated more field-goal attempts, collected more rebounds, and recorded more steals, but their lower shooting percentages limited the benefit of those advantages. The matchup provides a useful example of why a complete basketball analysis should consider scoring, shooting efficiency, free throws, and possession statistics together rather than relying on a single category.