White Sox vs Milwaukee Brewers Match Player Stats
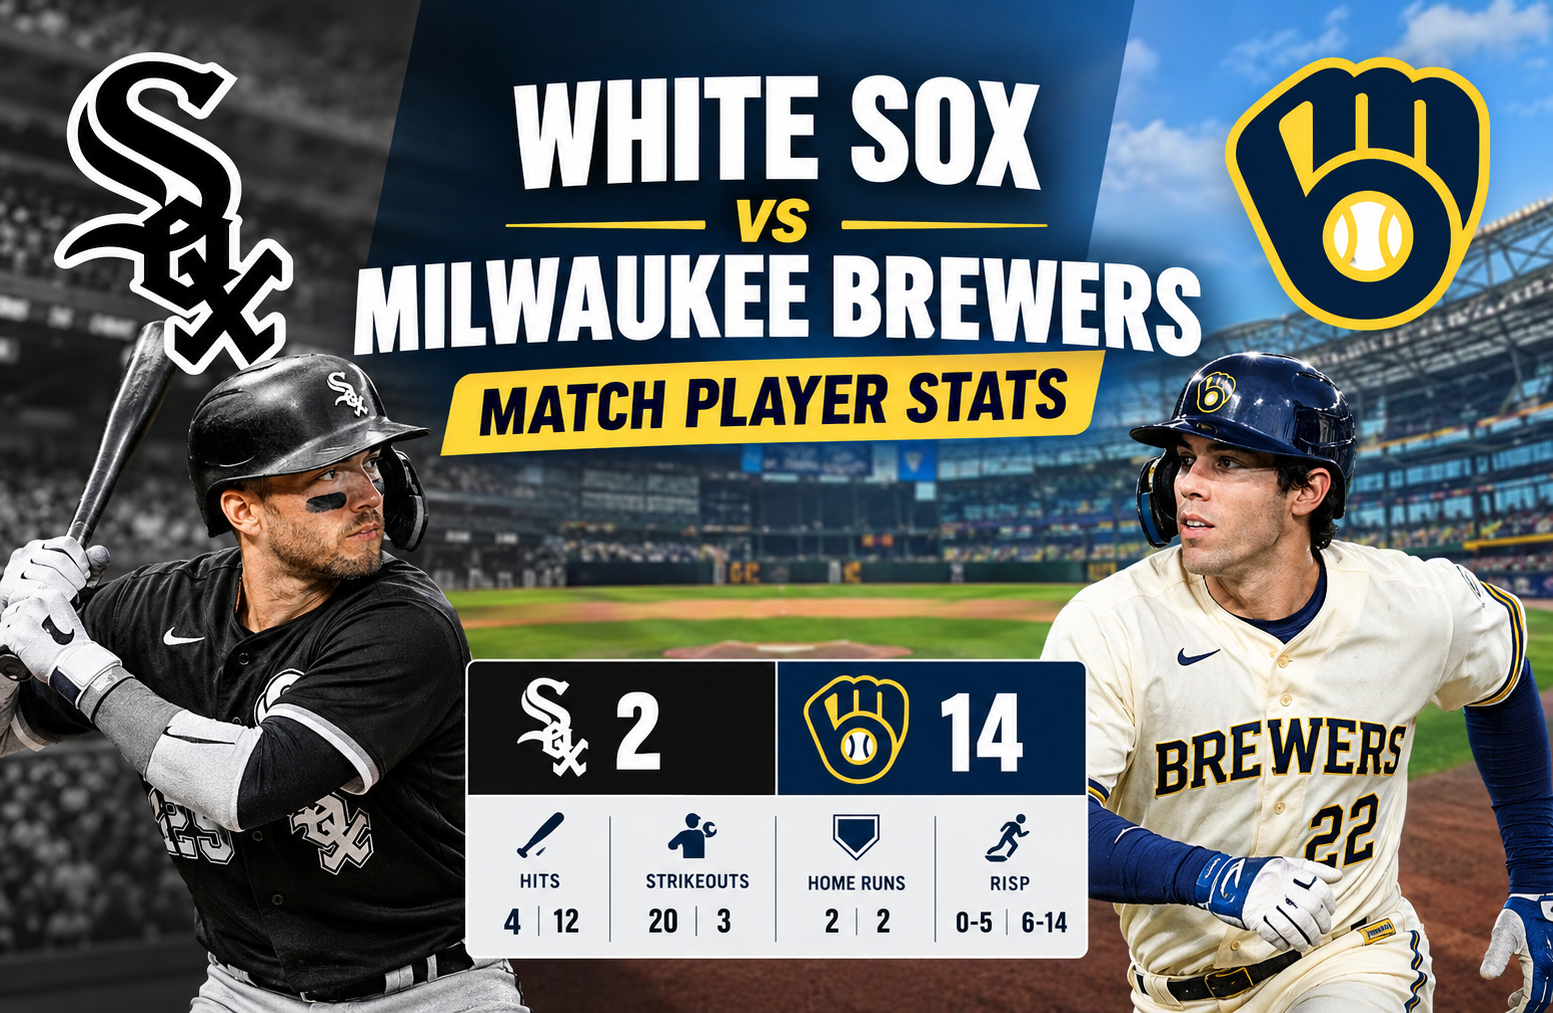
The white sox vs milwaukee brewers match player stats from March 26, 2026, show a game that quickly moved away from Chicago and became a dominant Milwaukee performance. The Brewers defeated the White Sox 14-2 at American Family Field, combining 12 hits, 10 walks, two home runs, and only three strikeouts as a team. Chicago managed four hits and two home runs but struck out 20 times against Milwaukee pitching. Jacob Misiorowski led the Brewers from the mound with five innings of one-run baseball and 11 strikeouts, while Chase Meidroth and Munetaka Murakami supplied Chicago’s only home runs. The official MLB game record confirms the 14-2 result and Misiorowski’s 11-strikeout performance.
The game was played in front of 43,001 fans and lasted 3 hours and 6 minutes. Beyond the final score, the box score provides several useful details about how the result developed. Milwaukee scored in five different innings, including four runs in the second, two in the fourth, two in the fifth, three in the sixth, and three in the seventh. Chicago scored once in the first and once in the ninth.
That scoring pattern matters because it shows that Milwaukee did not rely on one isolated offensive burst. The Brewers repeatedly created pressure, extended innings, moved runners, and converted opportunities with runners in scoring position. Chicago, by contrast, struggled to maintain offensive pressure after its early lead.
Game Overview
The matchup between the Chicago White Sox and Milwaukee Brewers was played on March 26, 2026, at American Family Field in Milwaukee, Wisconsin. Milwaukee entered the game with a 1-0 home record, while Chicago was 0-1 on the road after the result.
The final statistical picture was:
| Category | White Sox | Brewers |
| Runs | 2 | 14 |
| Hits | 4 | 12 |
| Errors | 1 | 0 |
| At-Bats | 31 | 33 |
| RBIs | 2 | 14 |
| Home Runs | 2 | 2 |
| Walks | 5 | 10 |
| Strikeouts | 20 | 3 |
| Team LOB | 7 | 7 |
| RISP | 0-5 | 6-14 |
The most striking contrast is not simply 14 runs against two. It is the combination of Milwaukee’s offensive efficiency and Chicago’s difficulty putting balls in play.
The Brewers scored 14 runs from 12 hits, while Chicago scored only two runs from four hits. Milwaukee also drew twice as many walks, 10 compared with five, while striking out only three times compared with Chicago’s 20.
That difference created far more opportunities for Milwaukee hitters to attack with runners on base.
White Sox vs Milwaukee Brewers Match Player Stats: Offensive Breakdown
The white sox vs milwaukee brewers match player stats become more meaningful when the individual performances are separated from the team totals.
Chicago’s offense had two players who produced the team’s only runs. Chase Meidroth hit a first-inning home run, and Munetaka Murakami hit a solo homer in the ninth. Those two swings accounted for all of Chicago’s scoring.
The problem for the White Sox was the lack of sustained offense between those home runs.
Chicago went 0-for-5 with runners in scoring position. That statistic is particularly important because it shows that the White Sox had opportunities but did not turn them into hits with runners in scoring position.
Chase Meidroth Sets the Tone Early
Chase Meidroth provided Chicago’s best offensive moment of the game almost immediately.
He opened the scoring with a solo home run in the top of the first inning. The home run traveled 417 feet to left-center field and gave the White Sox an early 1-0 advantage.
The official MLB tracking information listed the exit velocity at 107.7 mph and the launch angle at 28 degrees.
Meidroth finished 1-for-2 with one run, one RBI, one home run, and two walks. His individual slash line for the game was .500/.750/2.000.
Those numbers need to be viewed in the context of the small sample size. He had only two official at-bats, so the game does not provide enough evidence to make broader season conclusions. However, within this particular matchup, he was one of Chicago’s most productive hitters.
His two walks also show that his contribution went beyond the home run. He reached base three times despite Chicago’s overall offensive struggles.
Munetaka Murakami Provides a Ninth-Inning Highlight
Munetaka Murakami supplied Chicago’s second and final run in the ninth inning.
With the Brewers already leading 14-1, Murakami hit a solo home run to right field. The home run traveled 384 feet and represented his first Major League home run. MLB’s game coverage also identified it as his first Major League hit.
Murakami finished 1-for-2 with one run, one RBI, one home run, and two walks.
Like Meidroth, he finished with a .500 batting average in the game and reached base frequently. The difference was that his contribution came too late to affect the result.
Still, the ninth-inning homer was an important individual moment. For a player recording his first Major League home run, it provided a notable positive takeaway from an otherwise difficult team performance.
Other White Sox Hitters
The White Sox recorded only two additional hits beyond the home runs.
Andrew Vaughn did not produce a hit in the supplied box score, although his RBI opportunity came during Milwaukee’s sixth-inning scoring sequence. Luisangel Acuña recorded one of Chicago’s four hits, finishing 1-for-3.
Andrew Benintendi, Colson Montgomery, Miguel Vargas, Austin Hays, Edgar Quero, Everson Pereira, and the other Chicago hitters struggled to generate consistent contact.
The most concerning team-wide figure was the 20 strikeouts.
Twenty strikeouts across nine innings means Chicago’s lineup lost a substantial number of plate appearances without putting the ball in play. Against a pitching staff that also issued five walks, that combination made it difficult for the White Sox to build innings.
Milwaukee Brewers Offensive Performance
Milwaukee’s offense was much more balanced.
The Brewers scored 14 runs while collecting 12 hits and drawing 10 walks. They also struck out only three times.
That combination allowed Milwaukee to create pressure without needing every batter to record a hit.
The Brewers’ biggest contributors included Jake Bauers, William Contreras, Joey Ortiz, Sal Frelick, Christian Yelich, and David Hamilton.
Jake Bauers Delivers a Three-Run Home Run
Jake Bauers played a major role in the middle-to-late stages of the game.
He finished 2-for-5 with two runs, three RBIs, one home run, and no walks. His home run came in the seventh inning and gave Milwaukee a 14-1 lead.
The three-run blast followed earlier Milwaukee scoring and effectively put the result beyond reach.
Bauers’ final batting line produced a .400 average and a 1.000 slugging percentage for the game.
His home run was one of two Brewers homers, with the other coming from Sal Frelick.
William Contreras Creates the Second-Inning Breakthrough
William Contreras was central to Milwaukee’s first major offensive inning.
The Brewers entered the second inning trailing 1-0. They then scored four times, turning a one-run deficit into a 4-1 advantage.
Contreras delivered the biggest hit of the inning with a three-run double.
He finished the game 1-for-3 with one run, three RBIs, and two walks. His ability to drive in three runs with one swing made his performance especially valuable.
The important point is that Milwaukee did not need a home run to create its first major scoring burst. A well-timed extra-base hit with runners available produced the same kind of scoreboard impact.
Joey Ortiz Produces Two-RBI Game
Joey Ortiz was another important part of the Brewers’ offensive attack.
He finished 2-for-3 with two runs and two RBIs. His two RBI singles came in different innings, helping Milwaukee continue to add pressure after its second-inning explosion.
Ortiz’s performance illustrates how Milwaukee’s scoring was distributed.
Instead of relying entirely on one slugger, the Brewers received production from multiple spots in the lineup.
Sal Frelick Adds Another Two-Run Home Run
Sal Frelick added a two-run home run in the fifth inning.
The blast increased Milwaukee’s advantage from 6-1 to 8-1 and continued an offensive sequence in which the Brewers repeatedly expanded their lead.
Frelick finished 1-for-3 with two runs, two RBIs, one home run, and two walks.
His .333 batting average was accompanied by a .600 on-base percentage because of the two walks.
The combination of hits and walks is important when analyzing this game because Milwaukee’s offense was not simply a home-run-dependent attack.
Christian Yelich Contributes to the Scoring
Christian Yelich also played a role in Milwaukee’s offensive production.
He went 2-for-4 with two runs, one RBI, and one walk. His RBI single came during the fourth inning and helped Milwaukee increase its advantage to 6-1.
Yelich’s two hits also helped extend innings and put additional pressure on Chicago pitching.
David Hamilton Creates Pressure on the Bases
David Hamilton finished 1-for-2 with two runs, one RBI, two walks, and a stolen base.
His baserunning added another dimension to Milwaukee’s attack.
The Brewers recorded one stolen base in the game, credited to Hamilton. Brice Turang was also caught stealing.
The stolen base itself did not determine the result, but it illustrates that Milwaukee generated offense through several methods: hits, walks, extra-base hits, home runs, and baserunning.
Pitching Comparison
The pitching statistics provide one of the clearest explanations for the final score.
Milwaukee’s pitchers combined for nine innings, four hits allowed, two runs, two earned runs, five walks, and 20 strikeouts.
Chicago’s pitching staff allowed 12 hits, 14 runs, 13 earned runs, 10 walks, and two home runs while recording only three strikeouts.
The difference in strikeouts was enormous.
Jacob Misiorowski’s 11-Strikeout Start
Jacob Misiorowski delivered the game’s standout pitching performance.
He worked five innings, allowing two hits and one earned run. He walked three batters but struck out 11.
His official pitching line was:
- 5.0 innings
- 2 hits allowed
- 1 earned run
- 3 walks
- 11 strikeouts
- 1 win
- Game Score: 67
The 11 strikeouts were particularly significant. MLB reported that Misiorowski set a Brewers franchise Opening Day record for strikeouts, while Milwaukee’s pitching staff reached 20 strikeouts overall.
That performance also explains why Chicago struggled to maintain offensive momentum.
Even when White Sox hitters reached base, Misiorowski repeatedly ended plate appearances with strikeouts.
Shane Smith’s Difficult Outing
Chicago starter Shane Smith had a difficult start to the game.
He pitched 1.2 innings and allowed three hits, three earned runs, and two walks while striking out two.
His Game Score was 35.
The most damaging sequence came in the second inning. Milwaukee scored four runs, including Contreras’ three-run double.
Smith was charged with the loss.
The result demonstrates how quickly a pitching matchup can change when walks and extra-base hits occur in the same inning. Milwaukee did not need a large number of hits to create its early four-run advantage.
Milwaukee’s Bullpen Completes the Job
After Misiorowski completed five innings, Milwaukee’s bullpen finished the game.
The Brewers’ pitching staff ultimately limited Chicago to four hits and two runs while striking out 20 hitters.
That is important because a strong starting performance alone does not explain the full result. Chicago continued to face significant swing-and-miss production after Misiorowski left.
The final run allowed by Milwaukee came on Murakami’s ninth-inning home run.
Otherwise, the Brewers’ pitching staff prevented Chicago from turning baserunners into sustained scoring.
Why the Second Inning Changed the Game
The second inning was arguably the most important turning point.
Chicago entered the inning with a 1-0 lead after Meidroth’s home run.
Milwaukee responded with four runs.
Joey Ortiz started the scoring with an RBI single. Contreras then delivered the decisive three-run double.
That sequence changed the game from a narrow early lead for Chicago into a 4-1 advantage for Milwaukee.
Once Milwaukee moved ahead, the White Sox were unable to respond.
This is an important lesson when reading a box score. A final score can make a game appear one-sided from beginning to end, but the actual turning point can be much more specific.
Here, the second inning was the first major shift.
How Milwaukee Built a 14-Run Offense
The Brewers did not score 14 runs in one massive inning.
Their scoring was distributed across several innings:
| Inning | White Sox | Brewers |
| 1st | 1 | 0 |
| 2nd | 0 | 4 |
| 3rd | 0 | 0 |
| 4th | 0 | 2 |
| 5th | 0 | 2 |
| 6th | 0 | 3 |
| 7th | 0 | 3 |
| 8th | 0 | 0 |
| 9th | 1 | 0 |
This pattern shows sustained offensive production rather than a single isolated explosion.
Milwaukee scored in five separate innings.
The Brewers also scored at least two runs in each of those scoring innings.
That consistency is one of the most useful insights from the game data.
The Importance of Plate Discipline
The walk totals tell another part of the story.
Milwaukee drew 10 walks.
Chicago drew five.
A walk does not automatically produce a run, but it gives the offense another opportunity. When walks are combined with timely hits, the effect can become substantial.
Milwaukee’s 10 walks contributed to extended innings and gave hitters more chances to bat with runners on base.
Chicago’s five walks were not enough to compensate for the team’s 20 strikeouts and 0-for-5 performance with runners in scoring position.
This is why looking only at batting average can miss important details.
A player who reaches base through a walk can contribute to a scoring inning even without recording a hit.
RISP Performance Explains the Difference
The Brewers went 6-for-14 with runners in scoring position.
The White Sox went 0-for-5.
That is a major difference in situational hitting.
Chicago’s four hits included two home runs, but neither home run came with runners on base. Both were solo shots.
Milwaukee, on the other hand, converted multiple opportunities with runners in scoring position.
Contreras’ three-run double is the clearest example. One hit produced three runs because Milwaukee had already created the necessary baserunners.
This is a useful way to understand the 12-to-4 hit difference without assuming that every hit had equal value.
The timing of a hit matters.
Defensive and Baserunning Details
The Brewers finished without an error.
Chicago was charged with one fielding error, listed as catcher’s interference involving Edgar Quero.
The White Sox’s defensive mistake did not alone decide the game, but it was part of a broader performance in which Milwaukee consistently created pressure.
Milwaukee also stole one base.
David Hamilton recorded the stolen base, while Brice Turang was caught stealing.
The Brewers therefore mixed aggressive baserunning with controlled offensive execution.
White Sox vs Milwaukee Brewers Match Player Stats and Individual Impact
The white sox vs milwaukee brewers match player stats also show why individual box-score lines need context.
Meidroth and Murakami each hit a home run for Chicago, but both were solo shots.
Bauers and Frelick hit Milwaukee’s two home runs, while Contreras produced a three-run double and Ortiz recorded two RBI singles.
That distinction is critical.
Chicago’s home runs produced two total runs.
Milwaukee’s home runs produced five RBIs combined because Frelick hit a two-run homer and Bauers hit a three-run homer.
Meanwhile, Contreras’ three-run double added another three RBIs.
The Brewers therefore generated runs through multiple types of offensive events.
A Closer Look at the White Sox Offensive Numbers
Chicago’s team batting line was:
- 31 at-bats
- 2 runs
- 4 hits
- 2 RBIs
- 2 home runs
- 5 walks
- 20 strikeouts
- 7 runners left on base
- 0-for-5 with runners in scoring position
The four-hit total means Chicago’s two home runs represented half of its hits.
That is unusual in terms of how the offense generated its production during this game.
There were also 25 plate appearances that did not result in a hit, with walks and strikeouts accounting for important portions of those outcomes.
The 20 strikeouts were the biggest obstacle.
An offense can survive a few strikeouts if it generates frequent hits and productive outs elsewhere. In this game, Chicago did not have enough contact to offset the strikeout total.
A Closer Look at the Brewers Offensive Numbers
Milwaukee’s team batting line was:
- 33 at-bats
- 14 runs
- 12 hits
- 14 RBIs
- 2 home runs
- 10 walks
- 3 strikeouts
- 7 runners left on base
- 6-for-14 with runners in scoring position
The contrast with Chicago is clear.
Milwaukee had only two more hits than Chicago but scored 12 more runs.
That is because the Brewers combined hits with walks and situational execution.
The 10 walks created additional baserunners, while the low strikeout total allowed more balls to remain in play.
The six hits in 14 opportunities with runners in scoring position were especially important.
What the Game Says About Misiorowski’s Performance
Misiorowski’s five-inning outing deserves separate attention because of the quality of his strikeout production.
He allowed only two hits.
His three walks were the main source of traffic.
Yet Chicago could not convert those opportunities into a large inning.
The 11 strikeouts meant that Misiorowski controlled many plate appearances without needing fielders to make a play.
The official MLB record also identifies the performance as a Brewers Opening Day strikeout record.
For readers studying pitching statistics, the game illustrates why strikeouts, walks, hits allowed, and earned runs should be examined together rather than separately.
Misiorowski did issue three walks, but the combination of limited hits and 11 strikeouts kept Chicago’s scoring under control.
What the Game Says About Chicago’s Pitching
The White Sox pitching staff had the opposite statistical profile.
Chicago allowed:
- 12 hits
- 14 runs
- 13 earned runs
- 10 walks
- 2 home runs
- Only 3 strikeouts
Allowing 10 walks gave Milwaukee repeated opportunities to extend innings.
The 12 hits then converted many of those opportunities into actual production.
The two home runs added another layer of damage.
This combination is much more important than any one statistic alone.
A pitching staff can sometimes overcome walks by generating strikeouts or limiting hard contact. Chicago did not get enough of either in this matchup.
The Game’s Most Important Statistical Contrasts
Several numbers immediately explain the final result.
20 Strikeouts vs. 3 Strikeouts
This was perhaps the clearest difference.
Milwaukee pitching struck out 20 Chicago hitters.
Chicago pitching struck out only three Milwaukee hitters.
That created a huge difference in the number of plate appearances ending without the ball being put into play.
10 Walks vs. 5 Walks
Milwaukee’s offense also reached base through walks twice as often.
That helped create the baserunner volume needed for multi-run innings.
12 Hits vs. 4 Hits
Milwaukee produced three times as many hits as Chicago.
More importantly, those hits came with runners in scoring position frequently enough to produce 14 runs.
6-for-14 vs. 0-for-5 with Runners in Scoring Position
This was one of the biggest situational differences.
The Brewers converted 42.9% of their RISP opportunities into hits, while Chicago went hitless in five such opportunities.
The percentages should be treated as game-specific rather than predictive, but they accurately describe what happened on March 26.
The Role of Home Runs
Both teams hit two home runs.
That makes the home-run count look even at first glance.
However, the impact was very different.
Chicago:
- Meidroth: 1 RBI
- Murakami: 1 RBI
- Total: 2 home runs, 2 RBIs
Milwaukee:
- Frelick: 2 RBIs
- Bauers: 3 RBIs
- Total: 2 home runs, 5 RBIs
The difference came from the runners already on base.
A home run with nobody aboard produces one run. A home run with two runners aboard produces three.
That simple distinction explains why identical home-run totals can coexist with dramatically different scores.
Series Context
The supplied series data shows Milwaukee completed a three-game sweep of Chicago.
The series results were:
- Game 1: Brewers 14, White Sox 2
- Game 2: Brewers 6, White Sox 1
- Game 3: Brewers 9, White Sox 7
That gives Milwaukee a 3-0 series result.
The March 26 game was therefore not an isolated Milwaukee victory within the series. It was the opening game of the listed series and featured the largest scoring margin of the three results.
For readers reviewing the matchup beyond one box score, the series context provides additional perspective on the final 14-2 score.
What Readers Should Take From the Box Score
A useful player-stat analysis should answer more than “who scored the most?”
The deeper questions are:
- Who created scoring opportunities?
- Who converted those opportunities?
- Which pitching performances limited the opponent?
- Where did the game change?
- Which statistics explain the final score?
For this game, the answers are relatively clear.
Milwaukee created opportunities through 10 walks and 12 hits.
The Brewers converted those opportunities with a 6-for-14 performance with runners in scoring position.
Misiorowski prevented Chicago from responding by allowing only one earned run across five innings and striking out 11.
Chicago’s offense struggled because it struck out 20 times and went 0-for-5 with runners in scoring position.
That combination provides a much stronger explanation than simply stating that Milwaukee won 14-2.
Frequently Asked Questions
What was the final score between the White Sox and Brewers?
The Milwaukee Brewers defeated the Chicago White Sox 14-2 on March 26, 2026, at American Family Field.
Who was the winning pitcher for the Brewers?
Jacob Misiorowski earned the win after pitching five innings, allowing two hits and one earned run while striking out 11 and walking three.
Who hit home runs for the White Sox?
Chase Meidroth and Munetaka Murakami each hit a solo home run for Chicago. Meidroth homered in the first inning, while Murakami homered in the ninth.
Who hit home runs for the Brewers?
Sal Frelick hit a two-run home run in the fifth inning, and Jake Bauers hit a three-run home run in the seventh inning.
How many strikeouts did the Brewers pitching staff record?
Milwaukee’s pitching staff recorded 20 strikeouts against Chicago. Misiorowski accounted for 11 of them in his five innings.
How did the teams perform with runners in scoring position?
The Brewers went 6-for-14 with runners in scoring position, while the White Sox went 0-for-5.
Conclusion
The white sox vs milwaukee brewers match player stats from March 26, 2026, reveal a game defined by Milwaukee’s sustained offensive pressure and dominant strikeout production.
The Brewers finished with 12 hits, 10 walks, 14 runs, and only three strikeouts. Their ability to create baserunners and convert opportunities with runners in scoring position allowed them to turn a 1-0 first-inning deficit into a 14-2 victory.
Jacob Misiorowski was the standout pitcher after striking out 11 White Sox hitters over five innings. William Contreras provided a three-run double, Sal Frelick hit a two-run homer, Jake Bauers added a three-run homer, and Joey Ortiz contributed two RBI singles.
Chicago’s best offensive moments came from Chase Meidroth and Munetaka Murakami, who each hit solo home runs. However, the White Sox finished with only four hits, struck out 20 times, and went 0-for-5 with runners in scoring position.
The most revealing numbers are therefore not simply the 14-2 final score. Milwaukee’s 10-5 advantage in walks, 12-4 advantage in hits, 20-3 advantage in strikeouts, and 6-for-14 versus 0-for-5 performance with runners in scoring position collectively explain how the game developed.
For anyone reviewing this matchup through player statistics, those numbers provide the clearest picture of how Milwaukee controlled the game from the second inning onward.