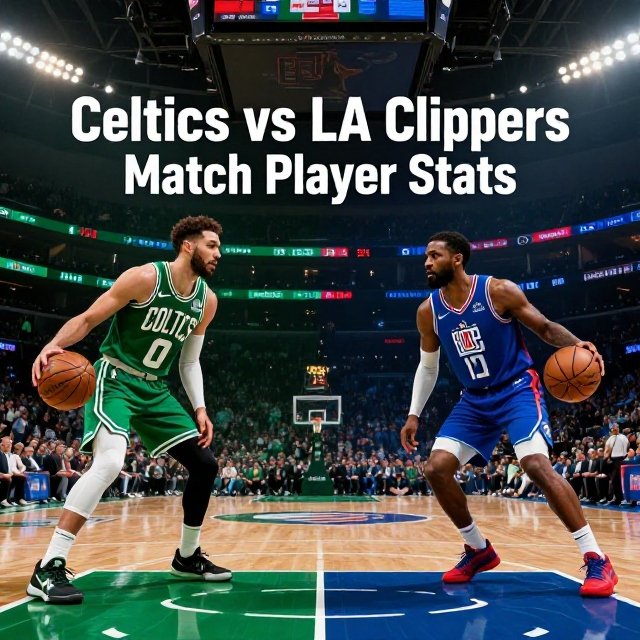
Celtics vs LA Clippers Match Player Stats
Celtics vs LA Clippers Match Player Stats from the January 3, 2026 matchup at Intuit Dome tell a much bigger story than the final 146-115 score. Boston did not simply win on shot-making. The Celtics combined elite three-point efficiency, low turnover volume, offensive rebounding, balanced playmaking, and a historic individual scoring night from Jaylen Brown to pull away from Los Angeles.
The official NBA record lists the game as January 3 in Inglewood, while the game recap and reporting were published on January 4. That distinction explains why some databases display January 3 and others show January 4. (NBA.com)
Brown finished with 50 points on 18-of-26 shooting, including 6-of-10 from three-point range. Derrick White added 29 points, Payton Pritchard produced 12 points and 8 assists, and Neemias Queta grabbed 9 rebounds. Boston also committed only six turnovers while shooting 55.2% from the field and 47.1% from three. (ESPN)
For the Clippers, Kawhi Leonard and John Collins led the scoring with 22 points apiece. James Harden recorded 18 points and 12 assists, while Ivica Zubac finished with 7 rebounds. The Clippers actually shot 50% from the field, but Boston’s efficiency, ball security, rebounding edge, and explosive third quarter proved too much to overcome. (NBA.com)
Celtics vs LA Clippers Match Player Stats
The most useful way to understand this matchup is to look beyond points scored. The box score shows how Boston created its 31-point advantage and why Los Angeles could not sustain its offensive momentum.
| Category | Boston Celtics | LA Clippers |
| Final Score | 146 | 115 |
| Field Goals | 53-96 | 42-84 |
| Field Goal % | 55% | 50% |
| Three-Pointers | 24-51 | 15-38 |
| Three-Point % | 47% | 39% |
| Free Throws | 16-19 | 16-17 |
| Free Throw % | 84% | 94% |
| Rebounds | 46 | 30 |
| Assists | 30 | 26 |
| Turnovers | 6 | 9 |
| Steals | 4 | 4 |
| Blocks | 6 | 4 |
| Offensive Rebounds | 16 | 8 |
| Defensive Rebounds | 30 | 22 |
| Personal Fouls | 20 | 15 |
The official NBA box score confirms Boston’s 53 field goals, 24 made threes, 46 rebounds, 30 assists and only six turnovers. (NBA.com)
That combination is particularly important. A team can survive a modest shooting night if it controls possessions. Boston did both: it shot extremely well and created extra possessions through offensive rebounding while giving the ball away just six times.
Final Score and Game Context
Boston entered the game with a 22-12 record, including a 12-7 mark on the road. Los Angeles entered at 12-22 and had an 8-9 home record.
The Celtics ultimately won 146-115, improving to 22-12. The Clippers dropped to 12-22. (ESPN)
The game was played at Intuit Dome in Inglewood, California, with an attendance of 17,927. The officiating crew consisted of CJ Washington, Dedric Taylor and Jacyn Goble. (NBA.com)
This was also a particularly notable result because Boston completed a strong road stretch while Los Angeles saw its six-game winning streak come to an end. The NBA’s recap reported that Boston had won 17 of its previous 22 games at that point. (NBA.com)
The previous meeting between the teams had been much closer. Boston won 121-118 on November 17, 2025. That means the two meetings produced very different game scripts, with the January matchup turning into a decisive Boston victory.
Jaylen Brown’s 50-Point Masterclass
The headline from the matchup is impossible to miss.
Jaylen Brown scored 50 points, tying his career high. He shot 18-of-26 from the field, 6-of-10 from three and 8-of-10 at the free-throw line. He also added 3 rebounds and 5 assists. (NBA.com)
His shooting efficiency is what makes the performance especially impressive.
Brown attempted 26 field goals and made 18. That works out to a 69.2% field-goal percentage. He also converted 60% of his three-point attempts.
A 50-point game can sometimes come from extreme volume. This one did not require inefficient shot hunting. Brown reached 50 while remaining highly efficient.
His scoring breakdown:
- 50 points
- 18-of-26 field goals
- 6-of-10 three-pointers
- 8-of-10 free throws
- 3 rebounds
- 5 assists
- 2 turnovers
- 21 plus/minus
Brown also produced 19 points during the third quarter, helping Boston turn a competitive game into a near runaway. (NBA.com)
The most important tactical point is that Brown’s scoring did not happen in isolation. Boston’s spacing created driving and shooting opportunities, while Pritchard and White helped keep the Clippers’ defense moving.
The NBA reported that Brown matched his career high with the performance, while ESPN also documented the 18-of-26 shooting line. (ESPN)
Derrick White Provides the Perfect Second Scoring Option
While Brown received most of the attention, Derrick White’s 29 points were crucial.
White finished 10-of-20 from the field, including 5-of-12 from three. He also contributed 4 rebounds, 7 assists, 1 steal and 2 blocks. His plus/minus was +17.
That is an important part of understanding Boston’s offensive structure.
The Clippers could not simply overload their defense toward Brown because White was capable of punishing defensive rotations. When the defense gave him room, he shot. When teammates became available, he passed. That versatility helped Boston avoid becoming overly dependent on one scorer.
White and Brown combined for 79 points.
The NBA’s game recap specifically noted that White scored 29 points and Brown scored 50, while Boston shot above 55% overall and above 47% from three. (NBA.com)
Payton Pritchard’s Impact Goes Beyond His 12 Points
Pritchard scored 12 points, but his eight assists and +27 plus/minus tell the more interesting story.
He shot 5-of-10 from the field and 2-of-3 from three. More importantly, he finished with 8 assists and zero turnovers.
That is excellent possession management.
A guard does not have to score 25 points to control a game. Pritchard’s role was to keep Boston’s offense organized, find shooters, move the ball and avoid giving Los Angeles easy transition opportunities.
His +27 was the best plus/minus on either team.
That statistic should not be interpreted as a perfect measure of individual performance, but in this particular game it fits the larger evidence. Boston scored 146 points, recorded 30 assists and committed only six turnovers. Pritchard was central to that efficient offensive environment.
Neemias Queta Wins the Rebounding Battle
Neemias Queta scored 8 points but collected 9 rebounds.
His contribution becomes more meaningful when viewed alongside Boston’s team rebounding numbers.
Boston finished with 46 total rebounds compared with only 30 for Los Angeles. The Celtics also collected 16 offensive rebounds, twice the Clippers’ total of 8.
That is a major possession advantage.
Offensive rebounds are especially valuable against a team that is already struggling to contain efficient scoring. Every extra possession creates another opportunity for Boston’s shooters and playmakers.
Queta’s 9 rebounds helped Boston control the interior possession battle even though he was not one of the team’s leading scorers.
Boston’s Three-Point Shooting Was a Major Difference
One of the clearest statistical separators was three-point production.
Boston made 24 of 51 three-point attempts.
Los Angeles made 15 of 38.
That gave Boston a nine-made-three advantage.
Nine additional three-pointers represent 27 points of difference before considering any other offensive effects.
Boston’s 47% three-point shooting was also outstanding at that volume. The Celtics did not merely take a large number of threes. They converted them at an elite rate.
The NBA’s game coverage confirms the 24-of-51 performance from beyond the arc. (NBA.com)
This is where the matchup became difficult for the Clippers. If Los Angeles focused heavily on Brown, Boston had White and other perimeter options. If the Clippers stayed home on shooters, Brown could attack.
That is the basic mathematical pressure created by good spacing.
Boston’s Ball Security Was Exceptional
Boston committed only 6 turnovers.
Los Angeles committed 9.
The difference may look small, but it matters because Boston was already generating more possessions through offensive rebounds.
Think of the possession battle this way:
- Boston generated 16 offensive rebounds.
- Boston surrendered only 6 turnovers.
- Los Angeles collected only 8 offensive rebounds.
- Los Angeles committed 9 turnovers.
- Boston converted its possessions at a much higher scoring rate.
This helped the Celtics maintain offensive pressure without handing the Clippers many transition opportunities.
For a 146-point performance, six turnovers is an especially clean offensive profile.
The Quarter-by-Quarter Story
The final score does not fully explain how the game developed.
| Quarter | Celtics | Clippers | Boston Lead |
| 1st | 42 | 28 | 14 |
| 2nd | 29 | 35 | 8 |
| 3rd | 42 | 36 | 14 |
| 4th | 33 | 16 | 31 |
Boston started quickly, scoring 42 points in the opening quarter.
Los Angeles responded in the second quarter by outscoring Boston 35-29. That reduced the Celtics’ advantage and briefly gave the Clippers a path back into the game.
The third quarter changed the trajectory.
Boston scored another 42 points while Los Angeles managed 36. Brown’s 19-point third quarter was a major part of that surge. (NBA.com)
Then came the fourth quarter.
Boston scored 33.
Los Angeles scored only 16.
That 17-point fourth-quarter advantage turned a 14-point lead entering the final period into a 31-point final margin.
The fourth quarter is particularly revealing because the Clippers were not simply beaten by hot shooting for 48 minutes. Their offense collapsed late while Boston continued producing.
Clippers Player Stats: Kawhi Leonard and John Collins
Kawhi Leonard led Los Angeles with 22 points.
John Collins also scored 22.
Collins was particularly efficient early. According to the Associated Press recap carried by NBA.com, Collins made his first eight shots and finished 9-of-10 from the field. (NBA.com)
That is a significant detail because it shows the Clippers were capable of creating high-quality offensive possessions.
The problem was consistency.
A team can shoot 50% overall and still lose by 31 points if the opponent controls the volume of possessions, dominates three-point scoring and wins the rebounding battle.
That is effectively what happened here.
Leonard’s 22 points were solid, but they did not match Brown’s scoring explosion. Collins’ efficiency was excellent, yet the Clippers could not sustain the same level of offensive output across four quarters.
James Harden’s 12 Assists
James Harden finished with 18 points and 12 assists.
His 12 assists were the Clippers’ highest total in the game.
That indicates Harden was creating opportunities, even though the overall offense could not keep pace with Boston.
The challenge for Los Angeles was not simply playmaking. The Clippers recorded 26 assists, which is a respectable number. The larger issue was how those assisted possessions compared with Boston’s scoring efficiency.
Boston had 30 assists while scoring 146 points.
Los Angeles had 26 assists while scoring 115.
The difference was not a complete absence of passing. It was the quality and efficiency of the possessions produced by that passing.
Ivica Zubac’s Rebounding Contribution
Zubac led the Clippers with 7 rebounds.
He also scored 4 points.
The seven rebounds were useful, but they were not enough to prevent Boston from winning the overall rebounding battle by 16.
Boston’s 46 rebounds compared with Los Angeles’ 30.
That gap is one of the clearest explanations for why the final margin became so large.
The Clippers also had only eight offensive rebounds. Boston doubled that number.
Derrick Jones Jr. and the Fourth-Quarter Issue
Derrick Jones Jr. scored 19 points for Los Angeles before leaving the game in the fourth quarter with an apparent right knee injury, according to the Associated Press recap. (NBA.com)
That detail matters when evaluating the final period, because Los Angeles lost one of its contributors while the game was already slipping away.
It would be too simplistic to attribute the fourth-quarter collapse entirely to that development. Boston had already built a substantial advantage through three quarters.
Still, the absence of another scoring option made it harder for the Clippers to respond when Boston continued attacking.
Boston’s Offensive Formula
The Celtics’ offensive success can be broken into several connected factors.
1. Elite perimeter efficiency
Boston made 24 threes on 51 attempts.
2. Efficient primary scoring
Brown shot 69.2% from the field while scoring 50.
3. Secondary scoring
White added 29.
4. Playmaking
Pritchard produced 8 assists and White added 7.
5. Extra possessions
Boston collected 16 offensive rebounds.
6. Ball security
The Celtics committed only 6 turnovers.
These factors reinforce one another.
Good shooting creates scoring.
Good spacing creates driving and passing lanes.
Offensive rebounding creates additional possessions.
Low turnovers prevent the opponent from getting transition chances.
When all four happen together, a large scoring night becomes much easier to sustain.
Why the Clippers Could Not Keep Up
Los Angeles did several things well.
The Clippers shot 50% from the field.
They shot 94% from the free-throw line.
They recorded 26 assists.
Harden had 12 assists.
Leonard and Collins both scored 22.
Yet those positives were overwhelmed by the statistical disadvantages.
The largest problems were:
- Nine fewer made three-pointers
- 16 fewer total rebounds
- Eight fewer offensive rebounds
- Three more turnovers
- 31 fewer total points
- A fourth-quarter scoring deficit of 17 points
This is why simply looking at field-goal percentage can be misleading.
Los Angeles actually shot 50% from the field, which is normally a strong number. But Boston’s 55% shooting came with dramatically greater three-point volume and efficiency.
Boston attempted 51 threes.
Los Angeles attempted 38.
That extra perimeter volume mattered.
A Closer Look at Shooting Efficiency
Boston’s overall field-goal line was 53-of-96.
That translates to approximately 55%.
The Celtics also made 24-of-51 from three, or approximately 47%.
Los Angeles made 42-of-84 from the field, exactly 50%, and 15-of-38 from three, approximately 39%.
The difference in effective scoring value is substantial.
A made three is worth 50% more than a made two.
Boston’s nine-made-three advantage therefore had a huge effect on the scoreboard.
The Celtics were not simply taking more shots. They were generating more points per successful perimeter possession.
Free Throw Shooting Was Not the Deciding Factor
Interestingly, Los Angeles was better at the free-throw line.
The Clippers made 16-of-17, or 94%.
Boston made 16-of-19, or 84%.
If free throws had been the primary issue, Los Angeles would have had an advantage.
But free throws were not enough to offset the Celtics’ three-point and possession advantages.
This is an important lesson when analyzing player stats. A single efficiency category rarely explains an entire basketball game.
The best analysis compares the categories together.
The Plus/Minus Numbers
Payton Pritchard led Boston at +27.
Jaylen Brown was +21.
Derrick White was +17.
For Los Angeles, Nicolas Batum was the Clippers’ best listed plus/minus at -10.
Plus/minus should never be used alone to judge an individual player. It is influenced by lineup combinations, opponent lineups and game situation.
However, in this matchup, Pritchard’s +27 supports the broader story because his 12 points, 8 assists and zero turnovers came within an offense that produced 146 points.
Brown’s +21 also reflects how strongly Boston performed while its leading scorer was on the floor.
Boston’s Bench and Supporting Production
The Celtics received meaningful contributions outside Brown and White.
Anfernee Simons scored 15 points.
Jordan Walsh scored 13 points and grabbed 13 rebounds.
Luka Garza added 11 points.
Sam Hauser scored 8 points.
Neemias Queta added 8 points and 9 rebounds.
This distribution matters because Boston did not need Brown to create every basket.
The Celtics had multiple players capable of scoring, rebounding and moving the ball.
That depth made the offense harder to disrupt.
The Importance of Jordan Walsh’s 13 Rebounds
Walsh’s 13 rebounds were the highest individual total in the game according to the box score data.
That is an easy statistic to overlook because Brown’s 50 points dominates the headline.
But 13 rebounds from Walsh helped Boston maintain its possession advantage.
Boston finished with 46 rebounds overall, and Walsh was responsible for a significant share.
This is exactly why player-stat analysis should not focus only on points.
A player can influence the game through rebounds, assists, defensive plays, screens, spacing and possession control.
What the Two Games in the Season Series Tell Us
Boston completed a 2-0 season-series sweep over Los Angeles.
The first meeting ended 121-118.
The second ended 146-115.
The difference is striking.
The first game was decided by only three points.
The second was decided by 31.
That contrast shows why season-series records alone are not enough to predict the shape of a matchup.
The teams changed.
Lineups changed.
Form changed.
And, most importantly, the second game featured one of Brown’s biggest scoring performances.
What These Player Stats Mean for Future Matchups
For readers studying the matchup rather than simply looking for a box score, several trends are especially useful.
Boston’s spacing creates difficult defensive choices
When Brown and White are both shooting efficiently, opponents cannot easily send extra defenders toward either player.
Boston can win without relying on one statistical category
The Celtics won the shooting battle, rebounding battle and turnover battle.
That creates multiple paths to victory.
The Clippers need more balance
Los Angeles had strong individual performances but could not sustain them for four quarters.
Rebounding can swing the matchup
The 46-30 rebounding advantage was enormous.
Turnovers can determine whether a hot-shooting opponent gets extra possessions
Boston’s six turnovers limited Los Angeles’ chances to capitalize on transition opportunities.
What Fantasy Basketball and Statistical Analysis Can Take From This Game
For fantasy basketball analysis, this matchup demonstrates why a player’s box-score value should be evaluated across categories.
Brown’s 50 points obviously created tremendous scoring value, but his five assists also mattered.
White’s 29 points combined with seven assists, four rebounds and two blocks.
Pritchard’s 12 points might appear modest next to Brown’s total, but eight assists and a +27 mark show how valuable his all-around contribution was.
On the Clippers side, Harden’s 18 points with 12 assists represented a different type of production.
Zubac’s seven rebounds were useful despite his four-point scoring total.
This reinforces a simple rule: points are only one part of player impact.
How to Read a Box Score Like an Analyst
If you are researching Celtics and Clippers player performance, use this sequence rather than looking only at the leading scorer.
Step 1: Start with the final score
This establishes the basic result.
Step 2: Check shooting percentages
Look at both overall field-goal percentage and three-point percentage.
Step 3: Examine three-point volume
A team shooting well from three can create a large scoring advantage.
Step 4: Check rebounds
Offensive rebounds are especially valuable because they generate additional possessions.
Step 5: Check turnovers
Turnovers can erase good shooting efficiency.
Step 6: Examine assists
Assists help reveal whether scoring came through ball movement or isolated creation.
Step 7: Review individual efficiency
A 30-point performance on 12-of-30 shooting is very different from 30 points on 12-of-18 shooting.
Step 8: Use plus/minus as supporting evidence
Never treat plus/minus as the only measure of individual quality.
Using that approach makes the numbers much easier to understand.
Official Box Score and Data Verification
For anyone publishing a match report, fantasy analysis, historical record or player-stat article, the safest approach is to verify the main numbers against the official game record.
The official NBA box score contains the individual player lines, team totals, quarter scoring and game information. (NBA.com)
This is particularly useful for avoiding common mistakes such as confusing the local game date with the publication date, mixing up rebounds and offensive rebounds, or reporting rounded shooting percentages without checking the underlying attempts.
Frequently Asked Questions
Who scored the most points in the Celtics vs Clippers game?
Jaylen Brown led all players with 50 points for Boston. He shot 18-of-26 from the field, 6-of-10 from three and 8-of-10 from the free-throw line. (NBA.com)
What was the final score between Boston and the LA Clippers?
Boston defeated Los Angeles 146-115 at Intuit Dome. (NBA.com)
How many points did Kawhi Leonard score?
Kawhi Leonard scored 22 points for the Clippers. John Collins also scored 22.
How many assists did James Harden have?
James Harden recorded 12 assists along with 18 points for Los Angeles. (NBA.com)
Who led the Celtics in assists?
Payton Pritchard led Boston with 8 assists. He also scored 12 points and finished with a team-best +27 plus/minus.
Did Boston win the season series against the Clippers?
Yes. Boston won both meetings between the teams during the 2025-26 regular season.
Conclusion
The Celtics vs LA Clippers Match Player Stats reveal a game that was decided by far more than Jaylen Brown’s 50 points.
Brown’s career-high-tying performance was the headline, but Boston’s victory came from a complete statistical profile. The Celtics shot 55% from the field, made 24 three-pointers, collected 46 rebounds, recorded 30 assists and committed only six turnovers.
Derrick White supplied 29 points and seven assists. Payton Pritchard controlled the offense with eight assists and zero turnovers. Neemias Queta contributed nine rebounds, while Jordan Walsh added 13 rebounds. Together, those contributions prevented the Clippers from concentrating entirely on Brown.
Los Angeles had legitimate positives. Leonard and Collins each scored 22 points, Harden produced 12 assists, and the Clippers shot 50% overall while making 94% of their free throws.
The decisive difference was the combination of Boston’s three-point shooting, offensive rebounding, ball security and fourth-quarter execution.
The 146-115 result also completed Boston’s 2-0 season-series sweep and showed how dramatically the second meeting differed from the earlier 121-118 Celtics victory.
For anyone studying the game through player statistics, the biggest lesson is simple: the most useful box-score analysis connects individual performances to possession control, shooting efficiency, rebounding and team strategy. That broader view explains not just who scored, but why the game ended with such a large margin.