Detroit Pistons vs Celtics Match Player Stats
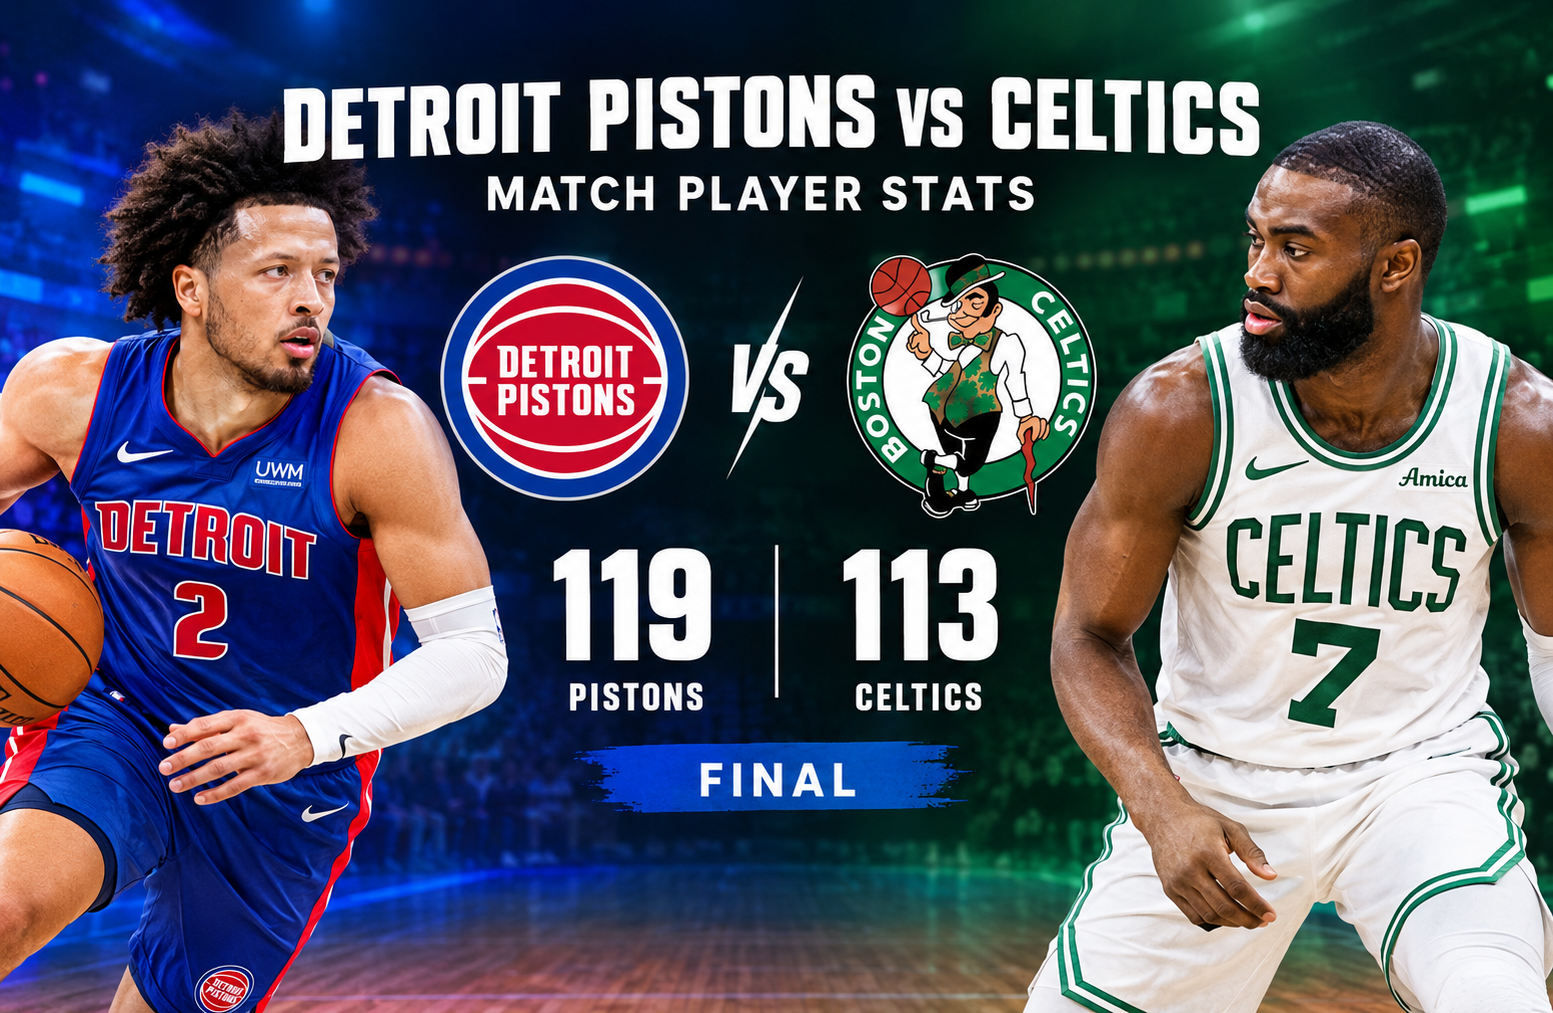
The detroit pistons vs celtics match player stats from October 27, 2025, highlight Detroit’s 119-113 victory over Boston at Little Caesars Arena in Detroit, Michigan. Jaylen Brown led all scorers with 41 points, but the Pistons secured the win through superior rebounding, efficient free-throw shooting, and balanced scoring. Cade Cunningham finished with 25 points and eight assists, while Jalen Duren contributed 24 points and 18 rebounds according to the supplied player box score.
The six-point result demonstrated how a team can win without dominating every shooting category. Boston made 15 three-pointers compared with Detroit’s nine, yet the Pistons collected 17 more rebounds and made 14 additional free throws. Those advantages helped Detroit overcome a difficult opening quarter and withstand Boston’s fourth-quarter comeback attempt.
This breakdown examines the final score, individual player performances, team statistics, quarter-by-quarter scoring, and the key factors behind the result. All statistical figures are based on the supplied ESPN-derived data. A discrepancy in Duren’s rebound total is noted where relevant.
Detroit Pistons vs Celtics Match Player Stats: Game Summary
The matchup brought together Boston’s perimeter-oriented offense and Detroit’s more balanced scoring approach. Brown delivered the game’s biggest individual scoring performance, but Detroit received substantial contributions from several starters.
| Game information | Details |
| Date | October 27, 2025 |
| Venue | Little Caesars Arena |
| Location | Detroit, Michigan |
| Attendance | 20,062 |
| Final score | Detroit 119, Boston 113 |
| Winning team | Detroit Pistons |
| Winning margin | 6 points |
| Detroit’s displayed record | 2-1 overall, 1-0 at home |
| Boston’s displayed record | 0-3 overall, 0-2 away |
Detroit’s win came from a combination of interior scoring, second-chance opportunities, and free throws. Boston had the advantage in three-point shooting, steals, and blocks, but those strengths did not compensate for its disadvantages on the glass and at the line.
The most important statistical differences were:
- Detroit collected 55 rebounds, compared with Boston’s 38.
- Detroit made 32 of 36 free throws, while Boston converted 18 of 24.
- Boston made six more three-pointers than Detroit.
- Detroit recorded 22 assists, compared with Boston’s 17.
- Detroit scored 50 points in the paint, while Boston scored 40.
These figures explain why the Pistons won despite shooting a lower percentage from three-point range.
Quarter-by-Quarter Scoring Breakdown
The scoring pattern reveals how Detroit recovered from an early deficit and established enough separation to survive Boston’s late push.
| Quarter | Boston Celtics | Detroit Pistons |
| First quarter | 33 | 24 |
| Second quarter | 25 | 36 |
| Third quarter | 23 | 34 |
| Fourth quarter | 32 | 25 |
| Final score | 113 | 119 |
First Quarter: Boston Takes Control
Boston opened with 33 points while limiting Detroit to 24. The Celtics established a nine-point advantage by using their scoring ability and perimeter shooting to put pressure on the home team.
Detroit faced an early challenge in finding consistent offensive production. Boston’s lead also gave the visitors an opportunity to dictate the pace of the game.
However, the Pistons responded in the second quarter rather than allowing the opening deficit to grow.
Second Quarter: Detroit Changes the Game
Detroit scored 36 points in the second quarter, while Boston managed 25. The Pistons erased their nine-point deficit and entered halftime with a two-point lead.
The improvement was consistent with Detroit’s eventual statistical strengths. The team generated points from the interior, earned free throws, and continued attacking the basket. Its rebounding advantage also created opportunities to recover missed shots.
The quarter marked the beginning of Detroit’s strongest stretch.
Third Quarter: The Decisive Period
Detroit outscored Boston 34-23 in the third quarter. Its two-point halftime advantage grew to 13 points entering the final period.
This was the most important scoring stretch of the game. Detroit created separation while Boston struggled to match its output.
The Pistons’ interior presence and ability to generate additional possessions helped maintain offensive pressure. Boston still had enough scoring talent to threaten a comeback, but it entered the fourth quarter needing a major response.
Fourth Quarter: Boston Makes a Late Push
Boston scored 32 points in the final quarter, seven more than Detroit’s 25. The Celtics reduced the deficit, but the earlier gap proved too large to overcome.
Detroit’s 13-point lead entering the quarter gave it room to absorb Boston’s improved scoring. The Pistons did not need to win the final period. They needed to protect their advantage, secure important possessions, and make enough shots and free throws to finish ahead.
The quarter-by-quarter figures demonstrate why a strong finish is not always sufficient. Boston won the first and fourth quarters, but Detroit’s 70 points across the second and third periods decided the game.
Complete Detroit Pistons Player Statistics
Detroit’s balanced scoring was central to the result. Cunningham, Duren, Thompson, and Harris each scored at least 18 points, giving the Pistons several reliable offensive options.
| Player | MIN | PTS | REB | AST | FG | 3PT | FT |
| Cade Cunningham | 38 | 25 | 3 | 8 | 8/18 | 2/5 | 7/7 |
| Jalen Duren | 28 | 24 | 18 | 1 | 6/12 | 0/0 | 12/13 |
| Ausar Thompson | 36 | 21 | 12 | 3 | 7/16 | 0/2 | 7/8 |
| Tobias Harris | 35 | 18 | 8 | 4 | 7/14 | 2/7 | 2/2 |
| Duncan Robinson | 30 | 8 | 4 | 1 | 2/7 | 2/7 | 2/3 |
| Isaiah Stewart | 21 | 9 | 6 | 1 | 3/6 | 2/2 | 1/2 |
| Ronald Holland II | 19 | 7 | 1 | 1 | 3/9 | 0/4 | 1/1 |
| Javonte Green | 17 | 7 | 3 | 1 | 3/9 | 1/5 | 0/0 |
| Chaz Lanier | 5 | 0 | 0 | 1 | 0/2 | 0/2 | 0/0 |
| Daniss Jenkins | 10 | 0 | 0 | 1 | 0/0 | 0/0 | 0/0 |
MIN means minutes played, PTS means points, REB means rebounds, AST means assists, FG means field goals, 3PT means three-pointers, and FT means free throws.
Cade Cunningham: 25 Points and Eight Assists
Cade Cunningham finished with 25 points, eight assists, and three rebounds in 38 minutes. He shot 8-for-18 from the field, made two of five three-point attempts, and converted all seven free throws.
His eight assists were particularly important because they show how he contributed to Detroit’s offense beyond his own scoring. As a primary ball handler, Cunningham helped create opportunities for teammates and organize possessions.
His six turnovers were a weakness. Turnovers end possessions without a shot and can give the opponent opportunities to score in transition. Detroit’s ability to win despite 16 team turnovers illustrates the importance of its advantages elsewhere.
Cunningham’s perfect free-throw shooting also provided seven points without requiring a made field goal. In a six-point game, reliable scoring from the line is especially valuable.
Jalen Duren: 24 Points and Dominant Rebounding
Jalen Duren recorded 24 points and 18 rebounds in the supplied player box score. He made six of 12 field-goal attempts and converted 12 of 13 free throws.
Eight of his rebounds came on the offensive end, giving Detroit additional opportunities after missed shots. His other 10 rebounds were defensive, helping the Pistons end Boston possessions.
Duren also blocked two shots and played only 28 minutes. His combination of interior scoring, rebounding, and shot protection made him one of Detroit’s most influential players.
There is a statistical discrepancy worth noting: the supplied player box score lists Duren with 18 rebounds, while the accompanying game recap reports 17. This article uses 18 for the player table and retains the supplied team total of 55 rebounds for Detroit.
Ausar Thompson: Two-Way Impact
Ausar Thompson recorded 21 points, 12 rebounds, three assists, and two steals in 36 minutes.
His five offensive rebounds were particularly valuable because they helped Detroit extend possessions. Thompson also converted seven of eight free throws, providing points even when his outside shooting was unsuccessful.
He went zero-for-two from three-point range, but his contributions in other areas helped offset that limitation.
Thompson finished with a plus-minus of +15, the highest among Detroit’s listed players. This means Detroit outscored Boston by 15 points during his minutes on the court. Plus-minus also reflects teammates, opponents, and substitutions, so it should be considered alongside his individual statistics rather than treated as proof of individual impact by itself.
Tobias Harris: Balanced Scoring and Playmaking
Tobias Harris scored 18 points and added eight rebounds and four assists. He made seven of 14 field-goal attempts, including two three-pointers, and converted both free throws.
His balanced contribution helped Detroit avoid relying exclusively on Cunningham and Duren. Harris could score, rebound, and create opportunities for teammates, making him an important supporting presence.
His rebounding also helped Detroit maintain its physical advantage. In a contest decided by several different statistical categories, contributions beyond scoring were essential.
Detroit’s Bench Contributions
Isaiah Stewart scored nine points and collected six rebounds in 21 minutes. He made both of his three-point attempts and added a steal and a block.
Ronald Holland II and Javonte Green each contributed seven points. Green recorded three offensive rebounds, while Holland added two steals and one block.
Duncan Robinson scored eight points and made two three-pointers. His outside shooting gave Detroit another perimeter option, although he made only two of seven field-goal attempts.
The bench’s role was not simply to match Boston’s individual scoring. It was to contribute enough shooting, defense, and rebounding to support Detroit’s overall strategy.
Complete Boston Celtics Player Statistics
Boston received an exceptional scoring performance from Jaylen Brown and additional production from Payton Pritchard, Derrick White, and the bench.
| Player | MIN | PTS | REB | AST | FG | 3PT | FT |
| Jaylen Brown | 35 | 41 | 6 | 4 | 12/25 | 5/9 | 12/15 |
| Payton Pritchard | 34 | 21 | 10 | 4 | 8/16 | 2/8 | 3/5 |
| Derrick White | 37 | 15 | 4 | 3 | 6/18 | 3/11 | 0/0 |
| Anfernee Simons | 23 | 12 | 1 | 0 | 5/13 | 2/7 | 0/0 |
| Sam Hauser | 24 | 8 | 4 | 0 | 3/7 | 2/5 | 0/0 |
| Josh Minott | 14 | 10 | 1 | 1 | 3/5 | 1/3 | 3/3 |
| Neemias Queta | 26 | 4 | 6 | 3 | 2/4 | 0/0 | 0/0 |
| Luka Garza | 13 | 2 | 2 | 1 | 1/2 | 0/1 | 0/1 |
| Chris Boucher | 9 | 0 | 1 | 1 | 0/2 | 0/1 | 0/0 |
| Hugo Gonzalez | 18 | 0 | 1 | 0 | 0/2 | 0/0 | 0/0 |
| Baylor Scheierman | 5 | 0 | 2 | 0 | 0/0 | 0/0 | 0/0 |
The supplied data lists Xavier Tillman and Jordan Walsh as did not play, by coach’s decision.
Jaylen Brown: Game-High 41 Points
Jaylen Brown led all players with 41 points in 35 minutes. He made 12 of 25 field-goal attempts, including five of nine three-pointers, and converted 12 of 15 free throws.
Brown’s scoring represented approximately 36% of Boston’s total points. He scored effectively from the perimeter and generated additional points at the free-throw line.
He also recorded six rebounds and four assists. However, his four turnovers reduced the number of productive possessions Boston could generate.
Brown’s plus-minus was -1. This does not mean his scoring performance was poor. It means Boston was outscored by one point during his minutes. His output kept the Celtics competitive, but Detroit’s collective advantages elsewhere proved more important to the final result.
Payton Pritchard: A Double-Double
Payton Pritchard recorded 21 points, 10 rebounds, and four assists. He shot eight-for-16 from the field and two-for-eight from three-point range.
His 10 rebounds were valuable, particularly for a guard, and helped Boston compete on the glass. His scoring also provided support for Brown.
However, Pritchard’s perimeter efficiency was limited. He made only two of eight three-point attempts, leaving opportunities for Boston to gain additional value from its outside shooting.
Derrick White: Defensive Activity
Derrick White finished with 15 points, four rebounds, and three assists. He also recorded four steals and three blocks.
Those defensive statistics show his ability to disrupt Detroit’s offense. His three made three-pointers provided additional perimeter scoring.
White shot six-for-18 from the field, however, which limited his scoring efficiency. His plus-minus of +11 was the highest among Boston’s listed players, illustrating that the Celtics performed well during his minutes despite losing the game overall.
Boston’s Bench Production
Anfernee Simons scored 12 points, while Josh Minott added 10. Sam Hauser contributed eight points and four rebounds.
Neemias Queta scored four points but recorded six rebounds, three assists, two steals, and three blocks. His contribution illustrates why scoring alone does not capture every player’s value.
Boston’s supporting players provided useful contributions, but the team needed a more consistent collective performance to overcome Detroit’s rebounding and free-throw advantages.
Team Statistics Comparison
The team box score explains how Detroit won despite Boston’s perimeter shooting advantage.
| Statistic | Boston Celtics | Detroit Pistons |
| Points | 113 | 119 |
| Field goals | 40/94 | 39/93 |
| Field-goal percentage | 43% | 42% |
| Three-pointers | 15/45 | 9/34 |
| Three-point percentage | 33% | 26% |
| Free throws | 18/24 | 32/36 |
| Free-throw percentage | 75% | 89% |
| Total rebounds | 38 | 55 |
| Offensive rebounds | 12 | 19 |
| Defensive rebounds | 26 | 36 |
| Assists | 17 | 22 |
| Turnovers | 12 | 16 |
| Steals | 11 | 7 |
| Blocks | 8 | 5 |
| Personal fouls | 26 | 24 |
Rebounding Created Additional Opportunities
Detroit’s 55 rebounds compared with Boston’s 38 represented a 17-rebound advantage. The Pistons also collected seven more offensive rebounds.
Offensive rebounds give a team another chance to score after a missed shot. They can extend possessions, force the defense to recover, and create opportunities for putbacks or passes to open shooters.
Detroit’s 19 offensive rebounds were particularly important because the team made only nine three-pointers. Additional possessions helped offset its lower perimeter shooting output.
Free Throws Made a Major Difference
Detroit made 32 free throws, compared with Boston’s 18. That difference accounted for 14 additional points from the line.
The Pistons attempted 36 free throws and converted nearly 89% of them. Boston attempted 24 and made 75%.
Detroit’s advantage came from both generating more attempts and converting them at a higher rate. Duren made 12 free throws, Cunningham made seven, and Thompson made seven.
Boston also benefited from the line, particularly through Brown, who converted 12 attempts. The difference was that Detroit generated more total opportunities.
Boston Won the Three-Point Battle
Boston made 15 three-pointers, six more than Detroit. That produced an 18-point advantage in three-point scoring.
The Celtics’ 33% shooting from beyond the arc was also better than Detroit’s 26%. Brown made five three-pointers, and White added three.
Detroit offset that difference through rebounding, free throws, and interior scoring. This is the central statistical lesson from the game: winning one shooting category does not guarantee a win when the opponent creates more opportunities elsewhere.
Assists and Turnovers
Detroit recorded 22 assists compared with Boston’s 17. Cunningham led the Pistons with eight assists, while Harris contributed four.
Boston committed 12 turnovers, four fewer than Detroit’s 16. This was a clear advantage for the Celtics, but it was not enough to determine the outcome.
Turnovers matter because they end possessions without a shot. However, they should be evaluated alongside offensive rebounds, free throws, and shooting efficiency to understand the complete picture.
Points in the Paint and Fast Breaks
Detroit scored 50 points in the paint, while Boston scored 40. The Pistons also recorded 21 fast-break points compared with Boston’s 14.
These figures support the conclusion that Detroit found effective scoring opportunities near the basket and in transition. Its interior presence created a different offensive route from Boston’s reliance on three-point shooting.
Why Detroit Won the Game
The result came down to several connected factors rather than one isolated statistic.
First, Detroit controlled the glass. Its 17-rebound advantage created additional possessions and reduced Boston’s opportunities for second-chance scoring.
Second, the Pistons generated more free throws and converted them efficiently. The 14-point advantage in made free throws was especially significant in a six-point game.
Third, Detroit had balanced scoring. Cunningham, Duren, Thompson, and Harris all scored at least 18 points. Boston’s offense was more concentrated around Brown, even though Pritchard and other teammates contributed.
Finally, Detroit’s strong second and third quarters created a lead that survived Boston’s late rally. The Pistons did not need to dominate the final quarter because their earlier scoring had created sufficient separation.
What the Game Reveals About Both Teams
Lessons for Detroit
Detroit demonstrated the value of interior pressure and rebounding. The team won without making as many three-pointers as Boston.
The key lessons were:
- Continue attacking the basket and creating free-throw opportunities.
- Maintain strong offensive rebounding to generate second chances.
- Keep distributing scoring responsibilities among several players.
- Reduce turnovers to avoid giving opponents unnecessary possessions.
Cunningham’s playmaking, Duren’s interior presence, Thompson’s activity, and Harris’s supporting scoring worked together to produce a balanced result.
Lessons for Boston
Boston’s perimeter shooting was effective, and Brown’s scoring kept the team competitive. However, the loss highlighted several areas for improvement.
- Improve defensive rebounding to reduce second-chance points.
- Limit fouls that send opponents to the free-throw line.
- Find more consistent supporting scoring when the leading scorer has a big night.
- Defend more effectively during the middle quarters to avoid building a large deficit.
Boston’s 12 turnovers were fewer than Detroit’s, and its three-point shooting was superior. The Celtics still lost because those strengths did not offset the Pistons’ advantages in other areas.
How to Interpret Basketball Player Statistics
A box score is most useful when individual numbers are considered together.
Points and Shooting Efficiency
Points identify scoring production, while field-goal, three-point, and free-throw percentages show how effectively players converted their attempts.
Brown’s 41 points were the game’s highest total. Duren’s 24 points were paired with 18 rebounds and strong free-throw shooting, giving his performance a different statistical profile.
Rebounds and Possession Control
Offensive rebounds extend possessions, while defensive rebounds help end the opponent’s possession. Detroit’s rebounding advantage was central to the final outcome.
Assists and Turnovers
Assists show passes that lead directly to made baskets. Turnovers represent possessions lost before a shot is attempted. Cunningham’s eight assists were valuable, but his six turnovers also deserve attention.
Plus-Minus
Plus-minus measures the scoring difference while a player is on the court. Thompson’s +15 and White’s +11 were notable, but these figures reflect team performance during their minutes and should not be treated as independent measures of individual skill.
For readers who want to verify the complete figures, the ESPN box score provides the game record and player statistics.
Frequently Asked Questions
1. Who won the Detroit Pistons vs Celtics game on October 27, 2025?
The Detroit Pistons defeated the Boston Celtics 119-113 at Little Caesars Arena in Detroit, Michigan.
2. Who scored the most points in the game?
Jaylen Brown led all scorers with 41 points for Boston. He made five three-pointers and converted 12 free throws.
3. How many points did Cade Cunningham score?
Cade Cunningham scored 25 points and recorded eight assists in 38 minutes. He also converted all seven of his free throws.
4. How many rebounds did Jalen Duren have?
The supplied player box score lists Duren with 18 rebounds and 24 points. The accompanying recap reports 17 rebounds, so the available records contain a discrepancy.
5. Why did Detroit beat Boston despite making fewer three-pointers?
Detroit collected 55 rebounds, made 32 free throws, and scored 50 points in the paint. Those advantages helped offset Boston’s six additional three-pointers.
6. Which team shot better from the field?
Boston shot 43% from the field, compared with Detroit’s 42%. Boston also had the higher three-point percentage, but Detroit’s superior free-throw production and rebounding helped secure the win.
Conclusion
The detroit pistons vs celtics match player stats show how Detroit secured a 119-113 victory through balanced scoring, superior rebounding, and efficient free-throw shooting. Jaylen Brown’s 41 points were the standout individual performance, while Cunningham, Duren, Thompson, and Harris provided the scoring balance that helped Detroit win.
Boston’s perimeter shooting and lower turnover total were genuine strengths, but they could not overcome Detroit’s 17-rebound advantage and 14-point edge in made free throws. The Pistons also established a decisive lead in the second and third quarters, giving them enough separation to survive Boston’s fourth-quarter push.
The game provides a clear example of why basketball analysis should extend beyond the leading scorer and final score. Rebounding, possession control, interior scoring, free throws, and team contributions all help explain how a close contest is decided.